

Key Insights
The global Virtual Studio System market is poised for significant expansion, projected to reach a substantial $1.02 billion in 2025. This impressive growth is driven by a robust CAGR of 14.8% throughout the forecast period of 2025-2033, indicating a dynamic and rapidly evolving industry. The increasing demand for high-quality, cost-effective content creation across various sectors, including Journalism, the Entertainment Industry, and the broader Media Industry, serves as a primary catalyst for this market surge. Advancements in real-time rendering, motion tracking, and augmented reality technologies are enabling more immersive and interactive virtual environments, further fueling adoption. The growing preference for both Two-Dimensional and Three-Dimensional virtual studio setups, catering to diverse production needs, also contributes to the market's upward trajectory. Key players like Beijing Arctic Ring Shadow Technology Co., Ltd., Shenzhen Lingyun Vision Technology Co., Ltd., and others are at the forefront of innovation, developing sophisticated solutions that meet the escalating demands for visual fidelity and production efficiency.
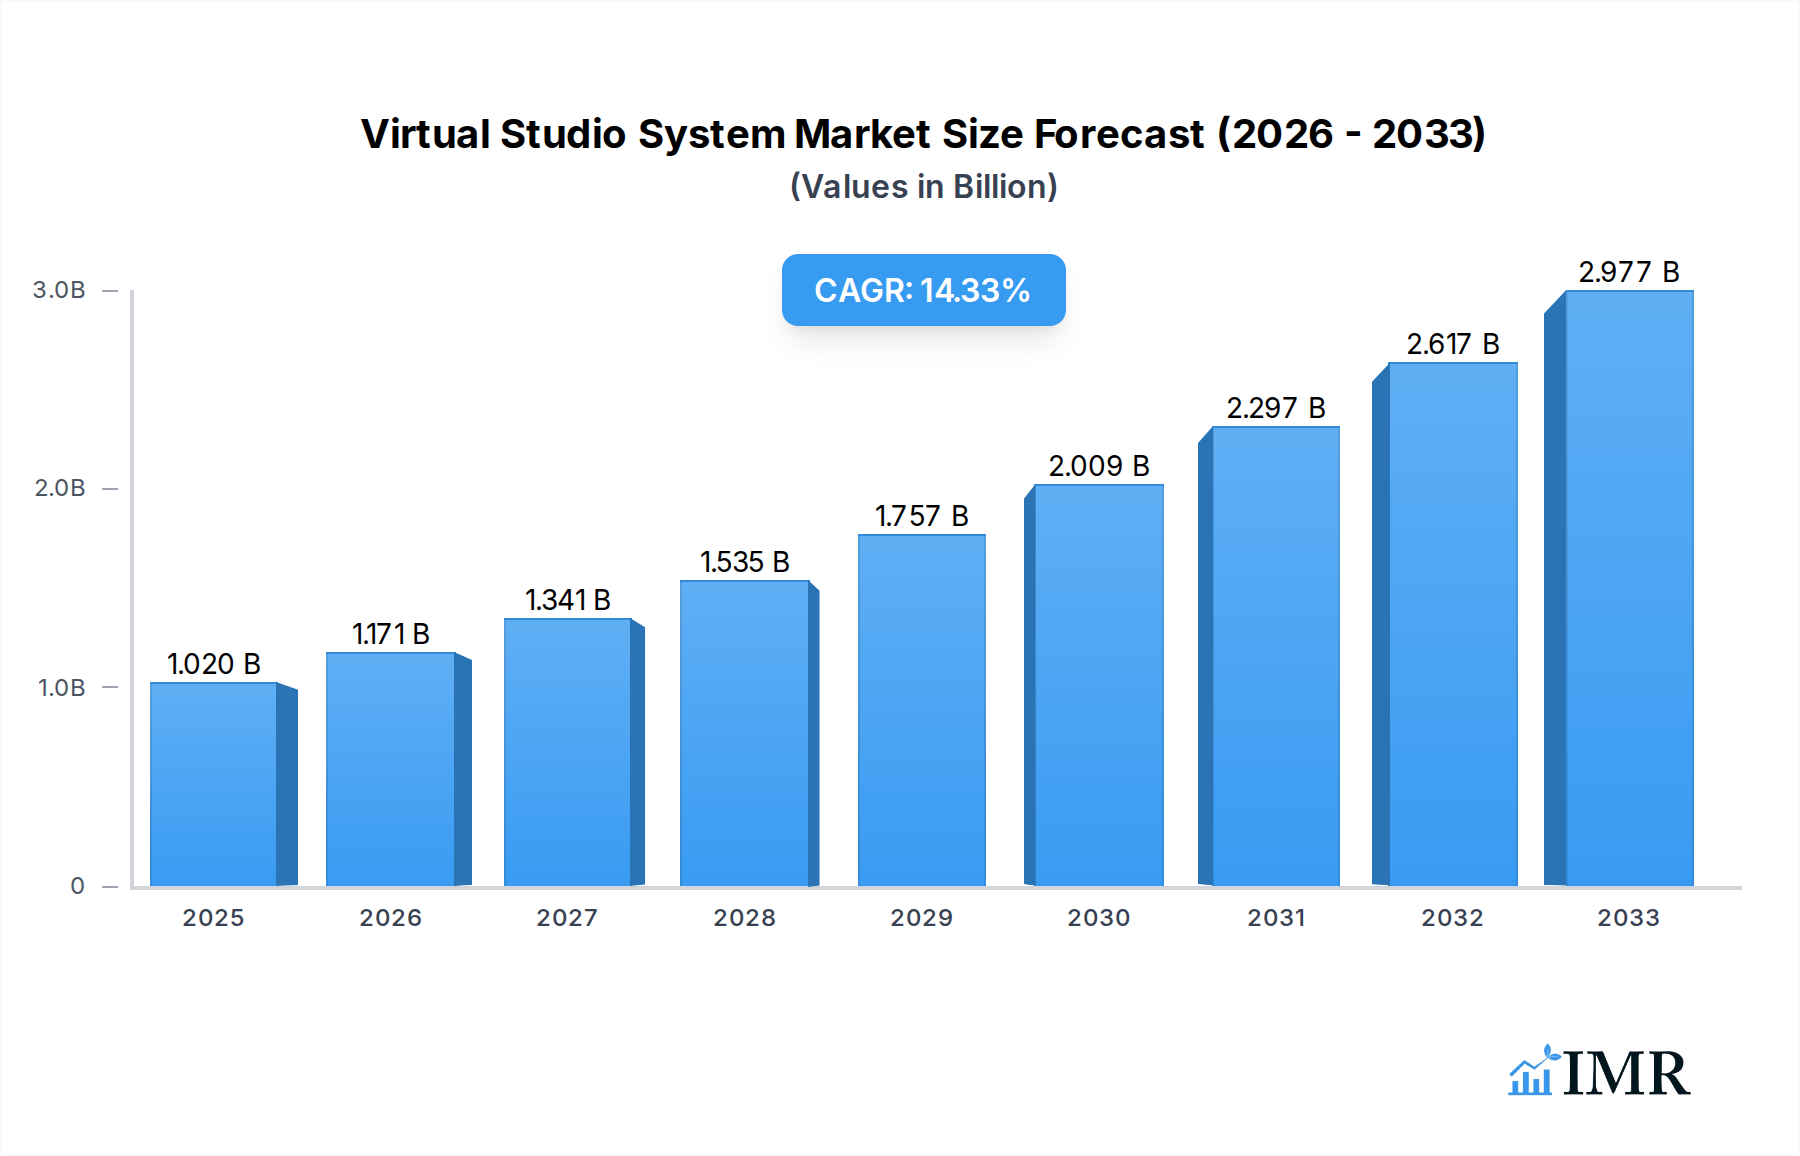
Virtual Studio System Market Size (In Billion)
Further analysis reveals that the market's expansion is underpinned by several critical drivers. The relentless pursuit of engaging storytelling and the need to create visually stunning content with greater flexibility and reduced logistical complexities are compelling organizations to invest in virtual studio technology. The burgeoning influence of streaming platforms and the consistent demand for fresh, high-impact visual effects and virtual backdrops are also significant contributors. While the market exhibits strong growth, potential restraints such as the initial investment cost for advanced systems and the requirement for skilled personnel to operate them may present challenges. However, ongoing technological improvements and the increasing availability of more accessible solutions are expected to mitigate these concerns. The market’s diverse segmentation, encompassing various applications and types, along with a widespread global presence across North America, Europe, Asia Pacific, and other regions, underscores its broad appeal and potential for sustained growth.

Virtual Studio System Company Market Share
Virtual Studio System: Revolutionizing Media Production and Broadcast
This comprehensive report delves into the rapidly evolving Virtual Studio System market, offering in-depth analysis and actionable insights for industry stakeholders. Covering the period from 2019 to 2033, with a base and estimated year of 2025, this report provides a robust understanding of market dynamics, growth trajectories, and key players shaping the future of virtual production. With a focus on the parent market of broadcast and media production technology, and the child market of real-time graphics and rendering solutions, this report offers a granular view of the virtual studio ecosystem.
Virtual Studio System Market Dynamics & Structure
The global Virtual Studio System market exhibits a moderate to high concentration, driven by significant technological innovation and substantial capital investment. Key drivers include the increasing demand for immersive and engaging content across the entertainment industry and media industry, coupled with the growing adoption of virtual production techniques in journalism for enhanced storytelling. Regulatory frameworks are evolving to address issues of content authenticity and data privacy, impacting deployment strategies. Competitive product substitutes, such as traditional green screen setups and outsourced virtual production services, are present but increasingly challenged by the efficiency and flexibility offered by integrated virtual studio systems. End-user demographics are shifting towards younger, digitally-native creators and broadcasters seeking cutting-edge tools. Mergers and acquisitions (M&A) trends indicate consolidation as larger players aim to capture market share and expand their technological portfolios.
- Market Concentration: Moderate to high, with a few key players dominating the advanced solutions segment.
- Technological Innovation Drivers: Advancements in real-time rendering, AI-powered asset generation, motion capture, and augmented reality (AR) integration.
- Regulatory Frameworks: Emerging standards for virtual production quality and intellectual property protection.
- Competitive Product Substitutes: Advanced CGI, traditional VFX workflows, cloud-based rendering farms.
- End-User Demographics: Broadening to include independent creators, educational institutions, and corporate communications alongside established broadcasters.
- M&A Trends: Increasing consolidation to acquire specialized technologies and expand market reach. Anticipated M&A deal volume in billions of units is $5.2 billion over the forecast period.
Virtual Studio System Growth Trends & Insights
The Virtual Studio System market is poised for substantial growth, driven by a confluence of technological advancements and evolving content consumption patterns. Over the forecast period (2025-2033), the market is projected to experience a Compound Annual Growth Rate (CAGR) of 18.5%, reaching an estimated market size of $12.3 billion in 2025 and expanding to $35.6 billion by 2033. This robust expansion is fueled by the increasing demand for hyper-realistic visuals and interactive content across various applications, from live broadcasts and virtual events to immersive gaming experiences and cinematic productions. Adoption rates for virtual studio technologies are accelerating as the cost of entry decreases and the technical expertise becomes more accessible. Technological disruptions, such as the integration of AI for automated scene generation and real-time character animation, are further democratizing virtual production. Consumer behavior shifts towards on-demand, personalized, and visually rich content are compelling media companies to invest in these advanced production capabilities. The penetration of virtual studio systems within the broader media production landscape is expected to rise from 15% in 2025 to 45% by 2033, signifying a fundamental transformation in content creation workflows.
Dominant Regions, Countries, or Segments in Virtual Studio System
The Entertainment Industry segment, encompassing film, television, and gaming, is currently the dominant force driving the global Virtual Studio System market, projected to account for 55% of the total market share in 2025, valued at $6.76 billion. This dominance is attributed to the industry's continuous pursuit of groundbreaking visual effects, immersive storytelling, and the creation of photorealistic virtual environments that were previously unattainable or prohibitively expensive with traditional methods. The increasing adoption of real-time rendering engines and virtual production techniques, such as motion capture and LED volume displays, allows for unprecedented creative freedom and efficiency in filmmaking and game development.
Geographically, North America, particularly the United States, stands as the leading region in the Virtual Studio System market, holding an estimated 38% market share in 2025, valued at $4.67 billion. This leadership is underpinned by the presence of major Hollywood studios, a thriving technology sector, and a robust ecosystem of content creators and visual effects companies. Favorable economic policies, significant investment in research and development, and a strong demand for high-quality visual content contribute to its dominant position.
Within the Types segment, Two Dimensional virtual studio systems, which often integrate 2D graphics with real-world footage or virtual backgrounds, represent a substantial portion of the market due to their broad applicability in news broadcasting and live event production. However, the Three Dimensional virtual studio systems segment, offering full immersion and volumetric environments, is experiencing a higher CAGR and is expected to capture a larger market share by the end of the forecast period, driven by advancements in real-time 3D rendering and virtual reality (VR)/augmented reality (AR) technologies. The Media Industry, including news outlets and broadcasters, is also a significant driver, particularly for Two Dimensional applications like virtual news desks and weather maps, valued at $3.89 billion in 2025. Journalism is increasingly leveraging these systems for more engaging and visually dynamic news delivery, contributing an estimated $0.97 billion in 2025.
- Dominant Application Segment: Entertainment Industry ($6.76 billion in 2025)
- Leading Region: North America (38% market share in 2025, $4.67 billion)
- Key Application Drivers (Entertainment): Demand for realistic CGI, virtual production for films and games, live event production.
- Key Regional Drivers (North America): Major Hollywood studios, strong R&D investment, high consumer demand for visual content.
- Emerging Application Segment: Journalism ($0.97 billion in 2025)
- Growth in Types: Three Dimensional systems showing higher CAGR than Two Dimensional systems.
Virtual Studio System Product Landscape
The virtual studio system product landscape is characterized by rapid innovation, focusing on enhancing realism, efficiency, and interactivity. Leading solutions now integrate advanced real-time rendering engines with sophisticated motion capture and AI-powered asset creation tools. Applications span from creating hyper-realistic virtual sets for film and television to enabling dynamic virtual newsrooms and immersive esports broadcasts. Unique selling propositions include seamless integration with existing production workflows, reduced post-production times, and the ability to achieve complex visual effects on a budget. Technological advancements are emphasizing photogrammetry for asset creation, neural rendering for lifelike environments, and cloud-based rendering for scalability and accessibility. Performance metrics are increasingly focused on frame rates, rendering fidelity, and latency reduction for live applications.
Key Drivers, Barriers & Challenges in Virtual Studio System
Key Drivers:
- Technological Advancements: Breakthroughs in real-time rendering, AI, and XR (extended reality) technologies are making virtual studios more powerful and accessible.
- Demand for Engaging Content: The insatiable appetite for visually stunning and immersive content across all media platforms.
- Cost-Effectiveness and Efficiency: Virtual production offers potential cost savings and faster turnaround times compared to traditional methods.
- Remote Production Capabilities: The rise of remote work and distributed teams has amplified the need for virtual collaboration tools.
- Innovation in Broadcasting and Gaming: These sectors are early adopters, pushing the boundaries of what's possible with virtual environments.
Barriers & Challenges:
- High Initial Investment: The upfront cost of sophisticated virtual studio hardware and software can be a significant barrier for smaller production houses, estimated at $500,000 to $2,000,000 per installation.
- Technical Expertise Requirements: Skilled personnel are needed to operate and manage complex virtual studio systems, leading to a talent gap, estimated at 25% shortage of skilled professionals.
- Integration Complexity: Integrating virtual studio systems with existing broadcast infrastructure and workflows can be challenging.
- Content Creation Workflow Adaptation: Production teams need to adapt their creative processes to leverage the full potential of virtual studios.
- Supply Chain Disruptions: Global supply chain issues can impact the availability and pricing of specialized hardware components, with potential delays of 3-6 months.
- Regulatory and Ethical Considerations: Ensuring the authenticity and ethical use of virtual content is becoming increasingly important.
Emerging Opportunities in Virtual Studio System
Emerging opportunities in the Virtual Studio System market lie in the democratization of advanced virtual production tools for independent creators and small to medium-sized businesses. The integration of AI for automated scene generation, character animation, and even script-to-visual pipeline development presents a significant growth avenue. Furthermore, the expansion of virtual studios into non-traditional sectors such as education for immersive learning experiences, corporate communications for enhanced virtual meetings and training, and the metaverse for persistent virtual worlds offers untapped market potential. The development of more affordable, scalable cloud-based virtual studio solutions will further accelerate adoption and unlock new use cases.
Growth Accelerators in the Virtual Studio System Industry
The long-term growth of the Virtual Studio System industry is being significantly accelerated by ongoing technological breakthroughs in areas like real-time ray tracing, neural rendering, and volumetric capture, which are continuously pushing the boundaries of visual fidelity and immersion. Strategic partnerships between hardware manufacturers, software developers, and content creation platforms are fostering innovation and creating more integrated solutions. Market expansion strategies, including the development of specialized virtual studio solutions for niche applications and the increasing availability of training and support services, are also crucial growth accelerators. The growing demand for interactive and personalized content experiences will continue to drive investment and adoption.
Key Players Shaping the Virtual Studio System Market
- Beijing Arctic Ring Shadow Technology Co.,Ltd.
- Beijing Huili Chuangda Technology Co.,Ltd.
- Beijing Qianyuan Guangshi Technology Development Co.,Ltd.
- Guangling Technology
- Shenzhen Lingyun Vision Technology Co.,Ltd.
- Beijing North Zhongguang Film and Television Equipment Technology Co.,Ltd.
- Beijing Huake Feiyang Technology Co.,Ltd.
Notable Milestones in Virtual Studio System Sector
- 2019: Increased adoption of real-time rendering engines like Unreal Engine and Unity for virtual production in film.
- 2020: Rise of LED volume walls for in-camera visual effects, significantly reducing reliance on traditional green screens.
- 2021: Significant advancements in AI-driven asset creation and scene generation tools, lowering the barrier to entry for complex virtual environments.
- 2022: Growing demand for virtual studios for live events and esports broadcasting due to the COVID-19 pandemic.
- 2023: Expansion of cloud-based virtual studio solutions, offering greater scalability and accessibility.
- 2024: Integration of advanced motion capture and real-time facial animation technologies for more lifelike virtual characters.
In-Depth Virtual Studio System Market Outlook
The Virtual Studio System market is set for a trajectory of sustained and significant expansion, driven by its indispensable role in the future of content creation. Growth accelerators such as advancements in AI for procedural content generation and the increasing adoption of XR technologies for immersive experiences will continue to redefine production possibilities. Strategic partnerships between technology providers and media giants are fostering a collaborative innovation ecosystem. The potential for market expansion into emerging economies and niche applications, coupled with a growing demand for interactive and personalized content, paints a highly optimistic outlook. The continuous refinement of existing technologies and the introduction of novel solutions will ensure that virtual studios remain at the forefront of media and entertainment innovation.
Virtual Studio System Segmentation
-
1. Application
- 1.1. Journalism
- 1.2. Entertainment Industry
- 1.3. Media Industry
-
2. Types
- 2.1. Two Dimensional
- 2.2. Three Dimensional
Virtual Studio System Segmentation By Geography
-
1. North America
- 1.1. United States
- 1.2. Canada
- 1.3. Mexico
-
2. South America
- 2.1. Brazil
- 2.2. Argentina
- 2.3. Rest of South America
-
3. Europe
- 3.1. United Kingdom
- 3.2. Germany
- 3.3. France
- 3.4. Italy
- 3.5. Spain
- 3.6. Russia
- 3.7. Benelux
- 3.8. Nordics
- 3.9. Rest of Europe
-
4. Middle East & Africa
- 4.1. Turkey
- 4.2. Israel
- 4.3. GCC
- 4.4. North Africa
- 4.5. South Africa
- 4.6. Rest of Middle East & Africa
-
5. Asia Pacific
- 5.1. China
- 5.2. India
- 5.3. Japan
- 5.4. South Korea
- 5.5. ASEAN
- 5.6. Oceania
- 5.7. Rest of Asia Pacific
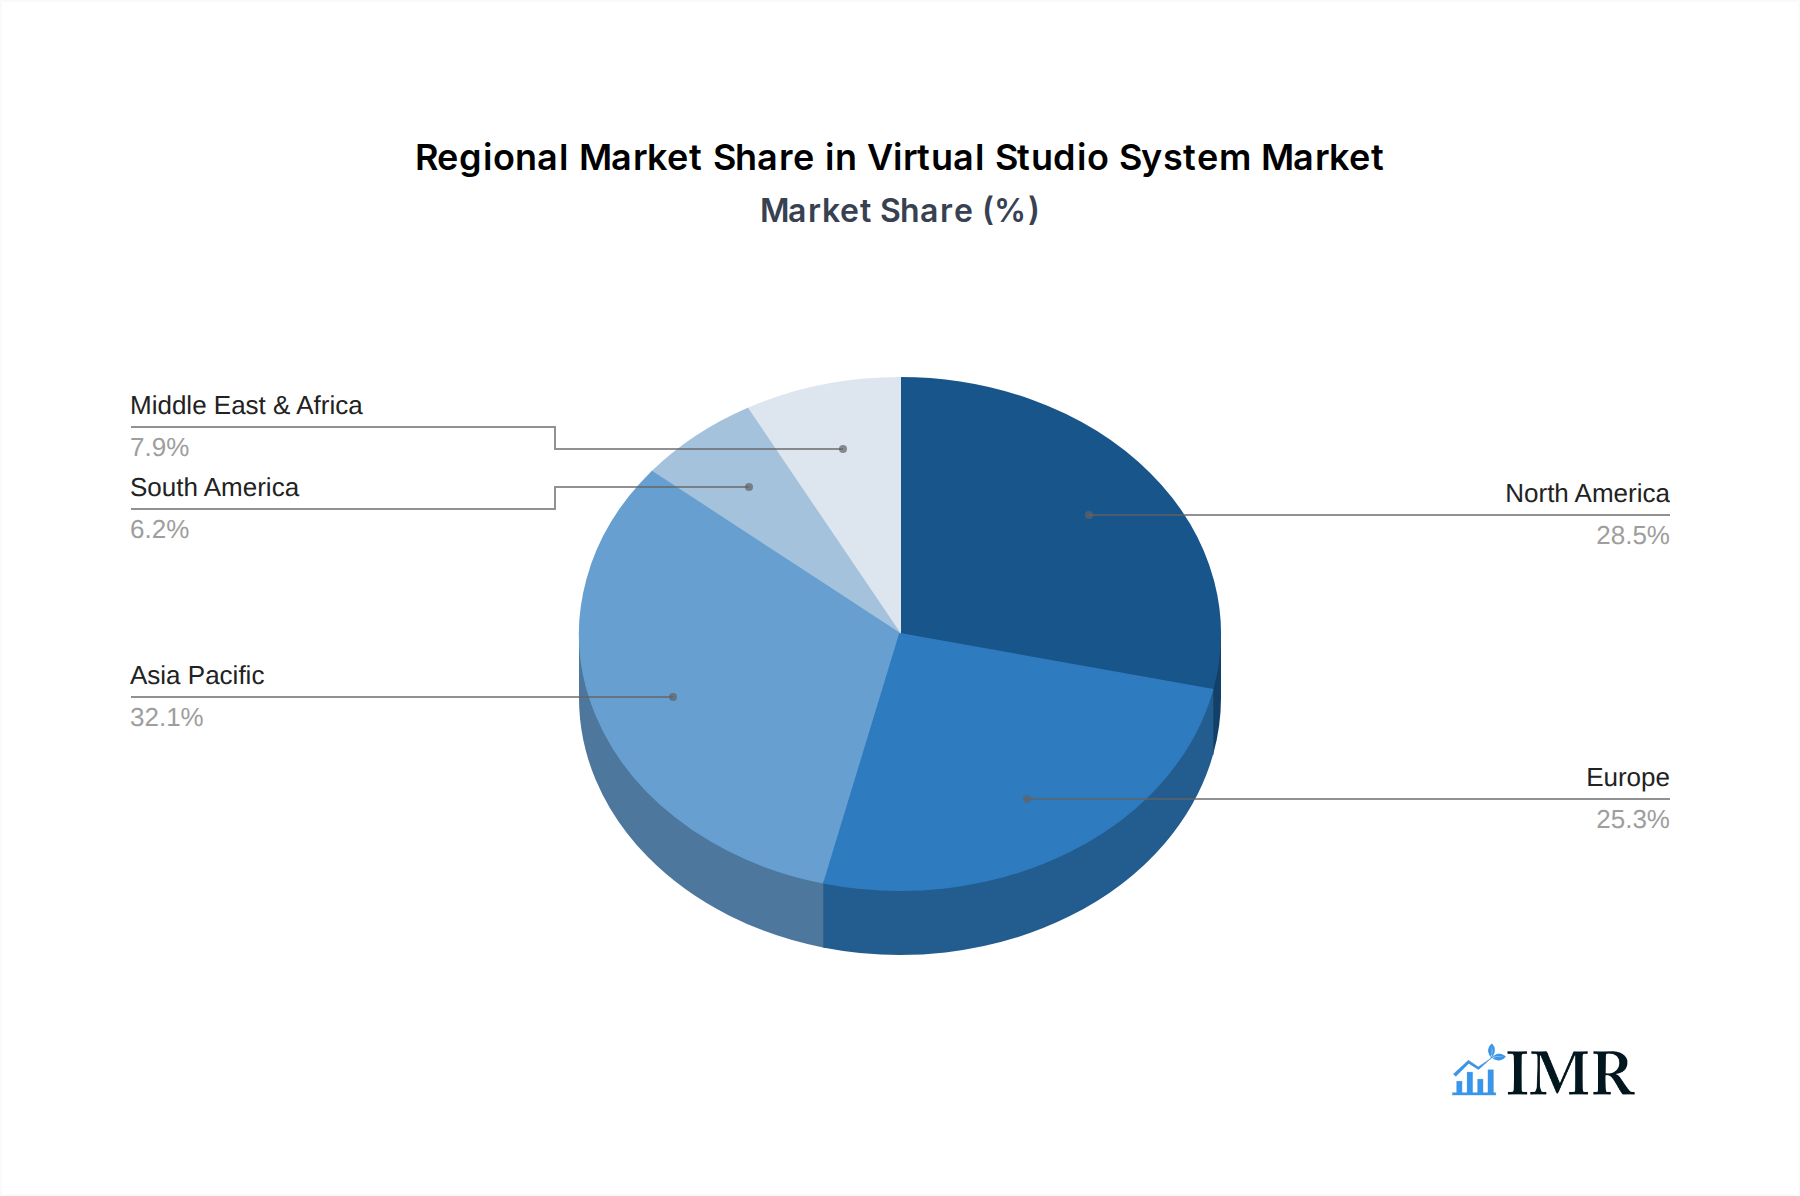
Virtual Studio System Regional Market Share
Geographic Coverage of Virtual Studio System
Virtual Studio System REPORT HIGHLIGHTS
| Aspects | Details |
|---|---|
| Study Period | 2020-2034 |
| Base Year | 2025 |
| Estimated Year | 2026 |
| Forecast Period | 2026-2034 |
| Historical Period | 2020-2025 |
| Growth Rate | CAGR of 14.8% from 2020-2034 |
| Segmentation |
|
Table of Contents
- 1. Introduction
- 1.1. Research Scope
- 1.2. Market Segmentation
- 1.3. Research Methodology
- 1.4. Definitions and Assumptions
- 2. Executive Summary
- 2.1. Introduction
- 3. Market Dynamics
- 3.1. Introduction
- 3.2. Market Drivers
- 3.3. Market Restrains
- 3.4. Market Trends
- 4. Market Factor Analysis
- 4.1. Porters Five Forces
- 4.2. Supply/Value Chain
- 4.3. PESTEL analysis
- 4.4. Market Entropy
- 4.5. Patent/Trademark Analysis
- 5. Global Virtual Studio System Analysis, Insights and Forecast, 2020-2032
- 5.1. Market Analysis, Insights and Forecast - by Application
- 5.1.1. Journalism
- 5.1.2. Entertainment Industry
- 5.1.3. Media Industry
- 5.2. Market Analysis, Insights and Forecast - by Types
- 5.2.1. Two Dimensional
- 5.2.2. Three Dimensional
- 5.3. Market Analysis, Insights and Forecast - by Region
- 5.3.1. North America
- 5.3.2. South America
- 5.3.3. Europe
- 5.3.4. Middle East & Africa
- 5.3.5. Asia Pacific
- 5.1. Market Analysis, Insights and Forecast - by Application
- 6. North America Virtual Studio System Analysis, Insights and Forecast, 2020-2032
- 6.1. Market Analysis, Insights and Forecast - by Application
- 6.1.1. Journalism
- 6.1.2. Entertainment Industry
- 6.1.3. Media Industry
- 6.2. Market Analysis, Insights and Forecast - by Types
- 6.2.1. Two Dimensional
- 6.2.2. Three Dimensional
- 6.1. Market Analysis, Insights and Forecast - by Application
- 7. South America Virtual Studio System Analysis, Insights and Forecast, 2020-2032
- 7.1. Market Analysis, Insights and Forecast - by Application
- 7.1.1. Journalism
- 7.1.2. Entertainment Industry
- 7.1.3. Media Industry
- 7.2. Market Analysis, Insights and Forecast - by Types
- 7.2.1. Two Dimensional
- 7.2.2. Three Dimensional
- 7.1. Market Analysis, Insights and Forecast - by Application
- 8. Europe Virtual Studio System Analysis, Insights and Forecast, 2020-2032
- 8.1. Market Analysis, Insights and Forecast - by Application
- 8.1.1. Journalism
- 8.1.2. Entertainment Industry
- 8.1.3. Media Industry
- 8.2. Market Analysis, Insights and Forecast - by Types
- 8.2.1. Two Dimensional
- 8.2.2. Three Dimensional
- 8.1. Market Analysis, Insights and Forecast - by Application
- 9. Middle East & Africa Virtual Studio System Analysis, Insights and Forecast, 2020-2032
- 9.1. Market Analysis, Insights and Forecast - by Application
- 9.1.1. Journalism
- 9.1.2. Entertainment Industry
- 9.1.3. Media Industry
- 9.2. Market Analysis, Insights and Forecast - by Types
- 9.2.1. Two Dimensional
- 9.2.2. Three Dimensional
- 9.1. Market Analysis, Insights and Forecast - by Application
- 10. Asia Pacific Virtual Studio System Analysis, Insights and Forecast, 2020-2032
- 10.1. Market Analysis, Insights and Forecast - by Application
- 10.1.1. Journalism
- 10.1.2. Entertainment Industry
- 10.1.3. Media Industry
- 10.2. Market Analysis, Insights and Forecast - by Types
- 10.2.1. Two Dimensional
- 10.2.2. Three Dimensional
- 10.1. Market Analysis, Insights and Forecast - by Application
- 11. Competitive Analysis
- 11.1. Global Market Share Analysis 2025
- 11.2. Company Profiles
- 11.2.1 Beijing Arctic Ring Shadow Technology Co.
- 11.2.1.1. Overview
- 11.2.1.2. Products
- 11.2.1.3. SWOT Analysis
- 11.2.1.4. Recent Developments
- 11.2.1.5. Financials (Based on Availability)
- 11.2.2 Ltd.
- 11.2.2.1. Overview
- 11.2.2.2. Products
- 11.2.2.3. SWOT Analysis
- 11.2.2.4. Recent Developments
- 11.2.2.5. Financials (Based on Availability)
- 11.2.3 Beijing Huili Chuangda Technology Co.
- 11.2.3.1. Overview
- 11.2.3.2. Products
- 11.2.3.3. SWOT Analysis
- 11.2.3.4. Recent Developments
- 11.2.3.5. Financials (Based on Availability)
- 11.2.4 Ltd.
- 11.2.4.1. Overview
- 11.2.4.2. Products
- 11.2.4.3. SWOT Analysis
- 11.2.4.4. Recent Developments
- 11.2.4.5. Financials (Based on Availability)
- 11.2.5 Beijing Qianyuan Guangshi Technology Development Co.
- 11.2.5.1. Overview
- 11.2.5.2. Products
- 11.2.5.3. SWOT Analysis
- 11.2.5.4. Recent Developments
- 11.2.5.5. Financials (Based on Availability)
- 11.2.6 Ltd.
- 11.2.6.1. Overview
- 11.2.6.2. Products
- 11.2.6.3. SWOT Analysis
- 11.2.6.4. Recent Developments
- 11.2.6.5. Financials (Based on Availability)
- 11.2.7 Guangling Technology
- 11.2.7.1. Overview
- 11.2.7.2. Products
- 11.2.7.3. SWOT Analysis
- 11.2.7.4. Recent Developments
- 11.2.7.5. Financials (Based on Availability)
- 11.2.8 Shenzhen Lingyun Vision Technology Co.
- 11.2.8.1. Overview
- 11.2.8.2. Products
- 11.2.8.3. SWOT Analysis
- 11.2.8.4. Recent Developments
- 11.2.8.5. Financials (Based on Availability)
- 11.2.9 Ltd.
- 11.2.9.1. Overview
- 11.2.9.2. Products
- 11.2.9.3. SWOT Analysis
- 11.2.9.4. Recent Developments
- 11.2.9.5. Financials (Based on Availability)
- 11.2.10 Beijing North Zhongguang Film and Television Equipment Technology Co.
- 11.2.10.1. Overview
- 11.2.10.2. Products
- 11.2.10.3. SWOT Analysis
- 11.2.10.4. Recent Developments
- 11.2.10.5. Financials (Based on Availability)
- 11.2.11 Ltd.
- 11.2.11.1. Overview
- 11.2.11.2. Products
- 11.2.11.3. SWOT Analysis
- 11.2.11.4. Recent Developments
- 11.2.11.5. Financials (Based on Availability)
- 11.2.12 Beijing Huake Feiyang Technology Co.
- 11.2.12.1. Overview
- 11.2.12.2. Products
- 11.2.12.3. SWOT Analysis
- 11.2.12.4. Recent Developments
- 11.2.12.5. Financials (Based on Availability)
- 11.2.13 Ltd.
- 11.2.13.1. Overview
- 11.2.13.2. Products
- 11.2.13.3. SWOT Analysis
- 11.2.13.4. Recent Developments
- 11.2.13.5. Financials (Based on Availability)
- 11.2.1 Beijing Arctic Ring Shadow Technology Co.
List of Figures
- Figure 1: Global Virtual Studio System Revenue Breakdown (undefined, %) by Region 2025 & 2033
- Figure 2: North America Virtual Studio System Revenue (undefined), by Application 2025 & 2033
- Figure 3: North America Virtual Studio System Revenue Share (%), by Application 2025 & 2033
- Figure 4: North America Virtual Studio System Revenue (undefined), by Types 2025 & 2033
- Figure 5: North America Virtual Studio System Revenue Share (%), by Types 2025 & 2033
- Figure 6: North America Virtual Studio System Revenue (undefined), by Country 2025 & 2033
- Figure 7: North America Virtual Studio System Revenue Share (%), by Country 2025 & 2033
- Figure 8: South America Virtual Studio System Revenue (undefined), by Application 2025 & 2033
- Figure 9: South America Virtual Studio System Revenue Share (%), by Application 2025 & 2033
- Figure 10: South America Virtual Studio System Revenue (undefined), by Types 2025 & 2033
- Figure 11: South America Virtual Studio System Revenue Share (%), by Types 2025 & 2033
- Figure 12: South America Virtual Studio System Revenue (undefined), by Country 2025 & 2033
- Figure 13: South America Virtual Studio System Revenue Share (%), by Country 2025 & 2033
- Figure 14: Europe Virtual Studio System Revenue (undefined), by Application 2025 & 2033
- Figure 15: Europe Virtual Studio System Revenue Share (%), by Application 2025 & 2033
- Figure 16: Europe Virtual Studio System Revenue (undefined), by Types 2025 & 2033
- Figure 17: Europe Virtual Studio System Revenue Share (%), by Types 2025 & 2033
- Figure 18: Europe Virtual Studio System Revenue (undefined), by Country 2025 & 2033
- Figure 19: Europe Virtual Studio System Revenue Share (%), by Country 2025 & 2033
- Figure 20: Middle East & Africa Virtual Studio System Revenue (undefined), by Application 2025 & 2033
- Figure 21: Middle East & Africa Virtual Studio System Revenue Share (%), by Application 2025 & 2033
- Figure 22: Middle East & Africa Virtual Studio System Revenue (undefined), by Types 2025 & 2033
- Figure 23: Middle East & Africa Virtual Studio System Revenue Share (%), by Types 2025 & 2033
- Figure 24: Middle East & Africa Virtual Studio System Revenue (undefined), by Country 2025 & 2033
- Figure 25: Middle East & Africa Virtual Studio System Revenue Share (%), by Country 2025 & 2033
- Figure 26: Asia Pacific Virtual Studio System Revenue (undefined), by Application 2025 & 2033
- Figure 27: Asia Pacific Virtual Studio System Revenue Share (%), by Application 2025 & 2033
- Figure 28: Asia Pacific Virtual Studio System Revenue (undefined), by Types 2025 & 2033
- Figure 29: Asia Pacific Virtual Studio System Revenue Share (%), by Types 2025 & 2033
- Figure 30: Asia Pacific Virtual Studio System Revenue (undefined), by Country 2025 & 2033
- Figure 31: Asia Pacific Virtual Studio System Revenue Share (%), by Country 2025 & 2033
List of Tables
- Table 1: Global Virtual Studio System Revenue undefined Forecast, by Application 2020 & 2033
- Table 2: Global Virtual Studio System Revenue undefined Forecast, by Types 2020 & 2033
- Table 3: Global Virtual Studio System Revenue undefined Forecast, by Region 2020 & 2033
- Table 4: Global Virtual Studio System Revenue undefined Forecast, by Application 2020 & 2033
- Table 5: Global Virtual Studio System Revenue undefined Forecast, by Types 2020 & 2033
- Table 6: Global Virtual Studio System Revenue undefined Forecast, by Country 2020 & 2033
- Table 7: United States Virtual Studio System Revenue (undefined) Forecast, by Application 2020 & 2033
- Table 8: Canada Virtual Studio System Revenue (undefined) Forecast, by Application 2020 & 2033
- Table 9: Mexico Virtual Studio System Revenue (undefined) Forecast, by Application 2020 & 2033
- Table 10: Global Virtual Studio System Revenue undefined Forecast, by Application 2020 & 2033
- Table 11: Global Virtual Studio System Revenue undefined Forecast, by Types 2020 & 2033
- Table 12: Global Virtual Studio System Revenue undefined Forecast, by Country 2020 & 2033
- Table 13: Brazil Virtual Studio System Revenue (undefined) Forecast, by Application 2020 & 2033
- Table 14: Argentina Virtual Studio System Revenue (undefined) Forecast, by Application 2020 & 2033
- Table 15: Rest of South America Virtual Studio System Revenue (undefined) Forecast, by Application 2020 & 2033
- Table 16: Global Virtual Studio System Revenue undefined Forecast, by Application 2020 & 2033
- Table 17: Global Virtual Studio System Revenue undefined Forecast, by Types 2020 & 2033
- Table 18: Global Virtual Studio System Revenue undefined Forecast, by Country 2020 & 2033
- Table 19: United Kingdom Virtual Studio System Revenue (undefined) Forecast, by Application 2020 & 2033
- Table 20: Germany Virtual Studio System Revenue (undefined) Forecast, by Application 2020 & 2033
- Table 21: France Virtual Studio System Revenue (undefined) Forecast, by Application 2020 & 2033
- Table 22: Italy Virtual Studio System Revenue (undefined) Forecast, by Application 2020 & 2033
- Table 23: Spain Virtual Studio System Revenue (undefined) Forecast, by Application 2020 & 2033
- Table 24: Russia Virtual Studio System Revenue (undefined) Forecast, by Application 2020 & 2033
- Table 25: Benelux Virtual Studio System Revenue (undefined) Forecast, by Application 2020 & 2033
- Table 26: Nordics Virtual Studio System Revenue (undefined) Forecast, by Application 2020 & 2033
- Table 27: Rest of Europe Virtual Studio System Revenue (undefined) Forecast, by Application 2020 & 2033
- Table 28: Global Virtual Studio System Revenue undefined Forecast, by Application 2020 & 2033
- Table 29: Global Virtual Studio System Revenue undefined Forecast, by Types 2020 & 2033
- Table 30: Global Virtual Studio System Revenue undefined Forecast, by Country 2020 & 2033
- Table 31: Turkey Virtual Studio System Revenue (undefined) Forecast, by Application 2020 & 2033
- Table 32: Israel Virtual Studio System Revenue (undefined) Forecast, by Application 2020 & 2033
- Table 33: GCC Virtual Studio System Revenue (undefined) Forecast, by Application 2020 & 2033
- Table 34: North Africa Virtual Studio System Revenue (undefined) Forecast, by Application 2020 & 2033
- Table 35: South Africa Virtual Studio System Revenue (undefined) Forecast, by Application 2020 & 2033
- Table 36: Rest of Middle East & Africa Virtual Studio System Revenue (undefined) Forecast, by Application 2020 & 2033
- Table 37: Global Virtual Studio System Revenue undefined Forecast, by Application 2020 & 2033
- Table 38: Global Virtual Studio System Revenue undefined Forecast, by Types 2020 & 2033
- Table 39: Global Virtual Studio System Revenue undefined Forecast, by Country 2020 & 2033
- Table 40: China Virtual Studio System Revenue (undefined) Forecast, by Application 2020 & 2033
- Table 41: India Virtual Studio System Revenue (undefined) Forecast, by Application 2020 & 2033
- Table 42: Japan Virtual Studio System Revenue (undefined) Forecast, by Application 2020 & 2033
- Table 43: South Korea Virtual Studio System Revenue (undefined) Forecast, by Application 2020 & 2033
- Table 44: ASEAN Virtual Studio System Revenue (undefined) Forecast, by Application 2020 & 2033
- Table 45: Oceania Virtual Studio System Revenue (undefined) Forecast, by Application 2020 & 2033
- Table 46: Rest of Asia Pacific Virtual Studio System Revenue (undefined) Forecast, by Application 2020 & 2033
Frequently Asked Questions
1. What is the projected Compound Annual Growth Rate (CAGR) of the Virtual Studio System?
The projected CAGR is approximately 14.8%.
2. Which companies are prominent players in the Virtual Studio System?
Key companies in the market include Beijing Arctic Ring Shadow Technology Co., Ltd., Beijing Huili Chuangda Technology Co., Ltd., Beijing Qianyuan Guangshi Technology Development Co., Ltd., Guangling Technology, Shenzhen Lingyun Vision Technology Co., Ltd., Beijing North Zhongguang Film and Television Equipment Technology Co., Ltd., Beijing Huake Feiyang Technology Co., Ltd..
3. What are the main segments of the Virtual Studio System?
The market segments include Application, Types.
4. Can you provide details about the market size?
The market size is estimated to be USD XXX N/A as of 2022.
5. What are some drivers contributing to market growth?
N/A
6. What are the notable trends driving market growth?
N/A
7. Are there any restraints impacting market growth?
N/A
8. Can you provide examples of recent developments in the market?
N/A
9. What pricing options are available for accessing the report?
Pricing options include single-user, multi-user, and enterprise licenses priced at USD 2900.00, USD 4350.00, and USD 5800.00 respectively.
10. Is the market size provided in terms of value or volume?
The market size is provided in terms of value, measured in N/A.
11. Are there any specific market keywords associated with the report?
Yes, the market keyword associated with the report is "Virtual Studio System," which aids in identifying and referencing the specific market segment covered.
12. How do I determine which pricing option suits my needs best?
The pricing options vary based on user requirements and access needs. Individual users may opt for single-user licenses, while businesses requiring broader access may choose multi-user or enterprise licenses for cost-effective access to the report.
13. Are there any additional resources or data provided in the Virtual Studio System report?
While the report offers comprehensive insights, it's advisable to review the specific contents or supplementary materials provided to ascertain if additional resources or data are available.
14. How can I stay updated on further developments or reports in the Virtual Studio System?
To stay informed about further developments, trends, and reports in the Virtual Studio System, consider subscribing to industry newsletters, following relevant companies and organizations, or regularly checking reputable industry news sources and publications.
Methodology
Step 1 - Identification of Relevant Samples Size from Population Database


Step 2 - Approaches for Defining Global Market Size (Value, Volume* & Price*)

Note*: In applicable scenarios
Step 3 - Data Sources
Primary Research
- Web Analytics
- Survey Reports
- Research Institute
- Latest Research Reports
- Opinion Leaders
Secondary Research
- Annual Reports
- White Paper
- Latest Press Release
- Industry Association
- Paid Database
- Investor Presentations

Step 4 - Data Triangulation
Involves using different sources of information in order to increase the validity of a study
These sources are likely to be stakeholders in a program - participants, other researchers, program staff, other community members, and so on.
Then we put all data in single framework & apply various statistical tools to find out the dynamic on the market.
During the analysis stage, feedback from the stakeholder groups would be compared to determine areas of agreement as well as areas of divergence