

Key Insights
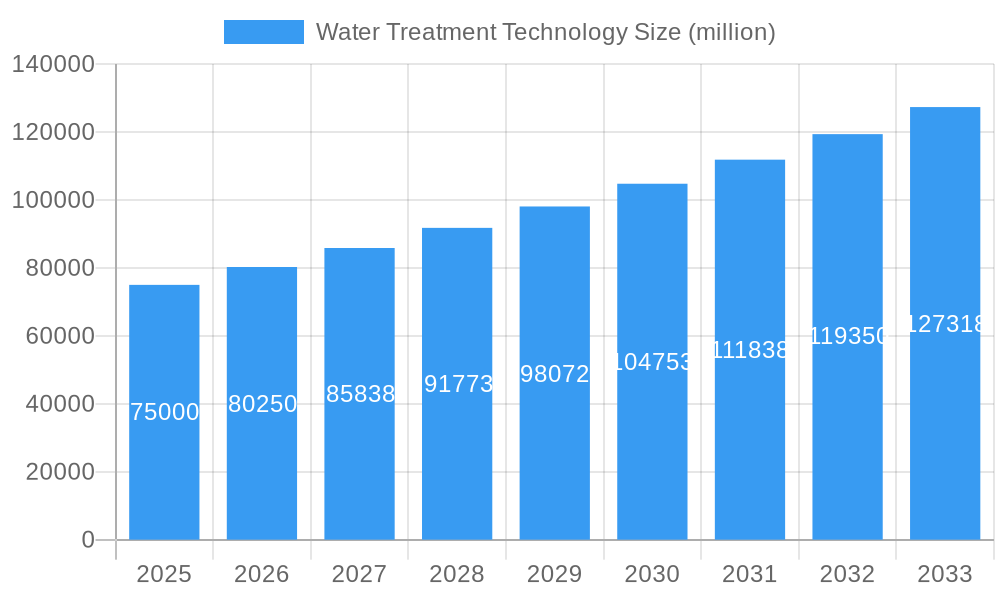
The global water treatment technology market is experiencing robust growth, driven by increasing industrialization, stringent environmental regulations, and a rising global population demanding access to clean and safe water. The market, estimated at $75 billion in 2025, is projected to exhibit a Compound Annual Growth Rate (CAGR) of 7% from 2025 to 2033, reaching approximately $130 billion by 2033. Key drivers include the escalating demand for water purification in various sectors, such as municipal water treatment, industrial processes, and residential applications. Furthermore, technological advancements in membrane filtration, reverse osmosis, and ultraviolet disinfection are contributing significantly to market expansion. The market is segmented by technology type (membrane filtration, disinfection, etc.), application (municipal, industrial, residential), and geography. Major players like Veolia, Suez, and Ecolab are actively engaged in mergers, acquisitions, and technological innovations to strengthen their market position and cater to the growing demand.
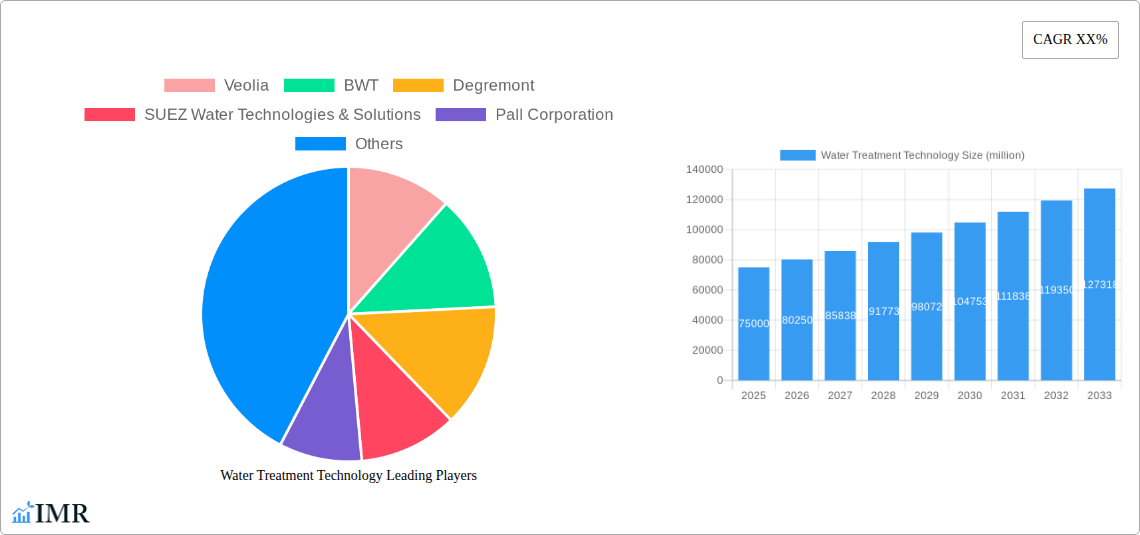
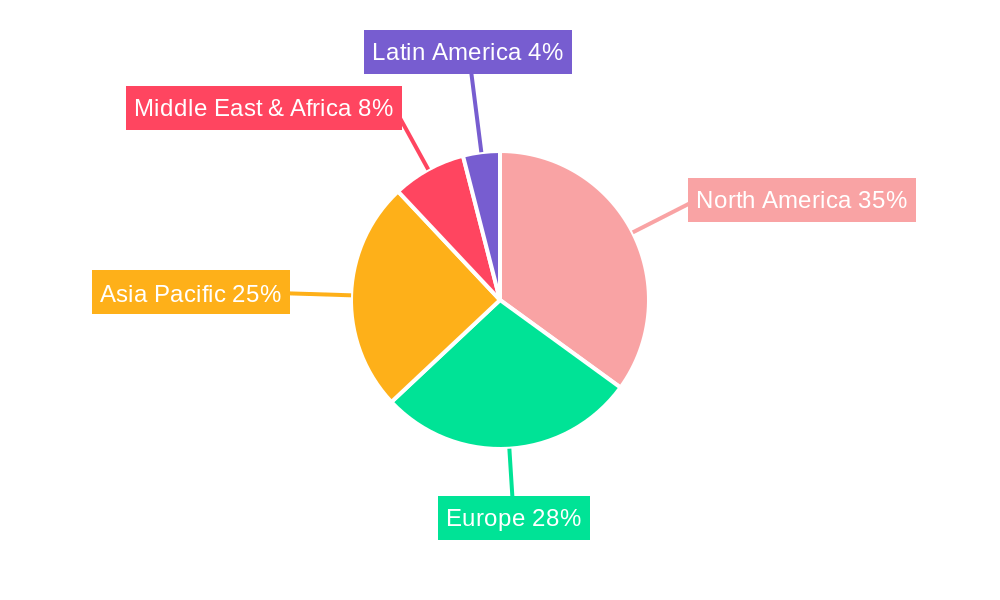
Water Treatment Technology Market Size (In Billion)
Growth is further fueled by trends toward sustainable water management practices, increasing adoption of advanced oxidation processes for treating recalcitrant pollutants, and the growing emphasis on water reuse and recycling. However, the market faces certain restraints, including high initial investment costs for water treatment infrastructure, fluctuating raw material prices, and the need for skilled labor to operate and maintain sophisticated equipment. Despite these challenges, the long-term outlook remains positive, driven by a global shift towards prioritizing water security and the ongoing development of innovative, cost-effective water treatment solutions. The regional market share is influenced by factors like economic development, population density, and environmental regulations, with North America and Europe currently holding a significant portion of the market.
Water Treatment Technology Company Market Share
Water Treatment Technology Market Report: 2019-2033
This comprehensive report provides an in-depth analysis of the global water treatment technology market, offering invaluable insights for industry professionals, investors, and strategic decision-makers. With a focus on market dynamics, growth trends, and key players, this report covers the period from 2019 to 2033, projecting robust growth driven by increasing water scarcity, stringent regulations, and technological advancements. The report segments the market by technology type (e.g., filtration, disinfection, desalination), end-user industry (e.g., municipal, industrial, residential), and geography, providing a granular view of market opportunities and challenges. Leading players such as Veolia, BWT, Degremont, SUEZ, Pall Corporation, Evoqua Water, Lenntech, Ecolab, Ecolutia, and Ovivo are profiled, highlighting their strategies and market positions. The report’s rigorous methodology incorporates both quantitative and qualitative data, providing a balanced and insightful analysis.
Water Treatment Technology Market Dynamics & Structure
The global water treatment technology market is characterized by moderate concentration, with a few large multinational corporations holding significant market share. The market is driven by technological innovation, particularly in membrane filtration, advanced oxidation processes, and water reuse technologies. Stringent environmental regulations, coupled with growing concerns over water quality and availability, further propel market growth. Competitive pressures are intense, with companies constantly striving to improve product performance, reduce costs, and expand their market reach. Mergers and acquisitions (M&A) activity remains significant, with larger players actively consolidating the market. The historical period (2019-2024) witnessed xx M&A deals, valued at approximately $xx billion. The estimated market size in 2025 is $xx billion.
- Market Concentration: Moderately concentrated, with top 5 players holding approximately xx% market share in 2025.
- Technological Innovation: Membrane filtration, UV disinfection, and desalination are key drivers of growth. Innovation barriers include high R&D costs and regulatory approvals.
- Regulatory Framework: Stringent regulations on water discharge and quality standards are driving demand for advanced treatment technologies.
- Competitive Landscape: Intense competition, with players focusing on product differentiation, technological advancements, and geographical expansion.
- M&A Activity: Significant M&A activity observed in the historical period, consolidating market share and accelerating growth.
Water Treatment Technology Growth Trends & Insights
The global water treatment technology market has experienced significant growth during the historical period (2019-2024), with a CAGR of xx%. This growth is projected to continue throughout the forecast period (2025-2033), with a projected CAGR of xx%, driven by several factors including increasing urbanization, industrialization, and rising water scarcity. The adoption rate of advanced water treatment technologies is increasing steadily, particularly in developing economies, where access to clean water remains a major challenge. Technological disruptions, such as the development of more energy-efficient and sustainable treatment processes, are further accelerating market growth. Consumer behavior is shifting towards environmentally friendly and cost-effective solutions, creating new opportunities for innovative water treatment technologies. Market penetration of advanced treatment technologies is projected to reach xx% by 2033.
Dominant Regions, Countries, or Segments in Water Treatment Technology
North America and Europe currently dominate the water treatment technology market, driven by robust infrastructure development, stringent environmental regulations, and high consumer awareness. However, Asia-Pacific is emerging as a high-growth region, fueled by rapid urbanization, industrialization, and increasing water stress. Specifically, China and India are experiencing significant growth. The municipal segment holds the largest market share due to the substantial investment in water infrastructure upgrades and expansion.
- North America: Strong regulatory framework, high technological adoption, and well-established infrastructure drive market growth.
- Europe: Similar to North America, but with a stronger emphasis on water reuse and sustainability.
- Asia-Pacific: Rapid urbanization, industrialization, and water scarcity create significant market opportunities. China and India are key growth drivers.
- Municipal Segment: Largest market share due to significant investments in water infrastructure.
Water Treatment Technology Product Landscape
The water treatment technology market offers a wide range of products catering to diverse applications and water quality needs. These include membrane filtration systems (reverse osmosis, microfiltration, ultrafiltration), disinfection technologies (UV, chlorination, ozonation), and other advanced treatment processes such as ion exchange and activated carbon adsorption. Recent innovations focus on improving energy efficiency, reducing chemical usage, and enhancing treatment effectiveness. Unique selling propositions include automation, remote monitoring, and modular design for flexibility and scalability. Technological advancements are leading to smaller footprints, higher efficiency, and lower operational costs.
Key Drivers, Barriers & Challenges in Water Treatment Technology
Key Drivers: Increasing water scarcity, stringent environmental regulations, growing industrialization, urbanization, and rising awareness of waterborne diseases are key drivers of market growth. Technological advancements and supportive government policies further propel the sector.
Challenges: High initial investment costs for advanced treatment technologies, lack of access to financing in developing countries, and complex regulatory approvals can hinder market expansion. Supply chain disruptions, particularly in the procurement of critical components, can also impact production and timelines. The intensity of competition and pressure to reduce costs present ongoing challenges.
Emerging Opportunities in Water Treatment Technology
Emerging opportunities include the increasing adoption of decentralized water treatment systems, advancements in water reuse and recycling technologies, the growth of the desalination market, and the development of sustainable and environmentally friendly treatment processes. Untapped markets in developing countries present significant growth potential. Innovative applications in industrial wastewater treatment and agricultural irrigation are emerging as key drivers.
Growth Accelerators in the Water Treatment Technology Industry
Technological breakthroughs, strategic partnerships, and market expansion strategies are major catalysts for long-term growth. The development of energy-efficient technologies, the integration of IoT and AI for improved monitoring and control, and expansion into new geographical markets are key growth drivers. Strategic collaborations between technology providers and water utilities will accelerate market adoption and deployment of innovative solutions.
Key Players Shaping the Water Treatment Technology Market
- Veolia
- BWT
- Degremont
- SUEZ Water Technologies & Solutions
- Pall Corporation
- Evoqua Water
- Lenntech
- Ecolab
- Ecolutia
- Ovivo
Notable Milestones in Water Treatment Technology Sector
- 2020: Launch of a new energy-efficient membrane filtration technology by Veolia.
- 2021: Acquisition of a smaller water treatment company by SUEZ, expanding its market reach.
- 2022: Introduction of AI-powered water quality monitoring system by a leading technology provider.
- 2023: Successful pilot project demonstrating innovative water reuse technology in a drought-prone region.
- 2024: Implementation of new stringent water quality regulations in several countries.
In-Depth Water Treatment Technology Market Outlook
The future of the water treatment technology market is bright, driven by ongoing technological advancements, supportive government policies, and the increasing urgency to address water scarcity. Strategic partnerships, focusing on innovation and sustainability, will shape the competitive landscape. The market's long-term growth potential is significant, particularly in developing economies and emerging applications such as industrial wastewater treatment and desalination. Opportunities exist for companies that can deliver cost-effective, energy-efficient, and sustainable solutions.
Water Treatment Technology Segmentation
-
1. Application
- 1.1. Power & Energy
- 1.2. Construction
- 1.3. Agriculture
- 1.4. Chemicals
- 1.5. Mining & Minerals
- 1.6. Municipal
- 1.7. Other
-
2. Types
- 2.1. Reverse Osmosis
- 2.2. Ultrafiltration
- 2.3. Microfiltration
- 2.4. Electro-dialysis
- 2.5. Gas Separation
Water Treatment Technology Segmentation By Geography
-
1. North America
- 1.1. United States
- 1.2. Canada
- 1.3. Mexico
-
2. South America
- 2.1. Brazil
- 2.2. Argentina
- 2.3. Rest of South America
-
3. Europe
- 3.1. United Kingdom
- 3.2. Germany
- 3.3. France
- 3.4. Italy
- 3.5. Spain
- 3.6. Russia
- 3.7. Benelux
- 3.8. Nordics
- 3.9. Rest of Europe
-
4. Middle East & Africa
- 4.1. Turkey
- 4.2. Israel
- 4.3. GCC
- 4.4. North Africa
- 4.5. South Africa
- 4.6. Rest of Middle East & Africa
-
5. Asia Pacific
- 5.1. China
- 5.2. India
- 5.3. Japan
- 5.4. South Korea
- 5.5. ASEAN
- 5.6. Oceania
- 5.7. Rest of Asia Pacific
Water Treatment Technology Regional Market Share
Geographic Coverage of Water Treatment Technology
Water Treatment Technology REPORT HIGHLIGHTS
| Aspects | Details |
|---|---|
| Study Period | 2020-2034 |
| Base Year | 2025 |
| Estimated Year | 2026 |
| Forecast Period | 2026-2034 |
| Historical Period | 2020-2025 |
| Growth Rate | CAGR of XX% from 2020-2034 |
| Segmentation |
|
Table of Contents
- 1. Introduction
- 1.1. Research Scope
- 1.2. Market Segmentation
- 1.3. Research Methodology
- 1.4. Definitions and Assumptions
- 2. Executive Summary
- 2.1. Introduction
- 3. Market Dynamics
- 3.1. Introduction
- 3.2. Market Drivers
- 3.3. Market Restrains
- 3.4. Market Trends
- 4. Market Factor Analysis
- 4.1. Porters Five Forces
- 4.2. Supply/Value Chain
- 4.3. PESTEL analysis
- 4.4. Market Entropy
- 4.5. Patent/Trademark Analysis
- 5. Global Water Treatment Technology Analysis, Insights and Forecast, 2020-2032
- 5.1. Market Analysis, Insights and Forecast - by Application
- 5.1.1. Power & Energy
- 5.1.2. Construction
- 5.1.3. Agriculture
- 5.1.4. Chemicals
- 5.1.5. Mining & Minerals
- 5.1.6. Municipal
- 5.1.7. Other
- 5.2. Market Analysis, Insights and Forecast - by Types
- 5.2.1. Reverse Osmosis
- 5.2.2. Ultrafiltration
- 5.2.3. Microfiltration
- 5.2.4. Electro-dialysis
- 5.2.5. Gas Separation
- 5.3. Market Analysis, Insights and Forecast - by Region
- 5.3.1. North America
- 5.3.2. South America
- 5.3.3. Europe
- 5.3.4. Middle East & Africa
- 5.3.5. Asia Pacific
- 5.1. Market Analysis, Insights and Forecast - by Application
- 6. North America Water Treatment Technology Analysis, Insights and Forecast, 2020-2032
- 6.1. Market Analysis, Insights and Forecast - by Application
- 6.1.1. Power & Energy
- 6.1.2. Construction
- 6.1.3. Agriculture
- 6.1.4. Chemicals
- 6.1.5. Mining & Minerals
- 6.1.6. Municipal
- 6.1.7. Other
- 6.2. Market Analysis, Insights and Forecast - by Types
- 6.2.1. Reverse Osmosis
- 6.2.2. Ultrafiltration
- 6.2.3. Microfiltration
- 6.2.4. Electro-dialysis
- 6.2.5. Gas Separation
- 6.1. Market Analysis, Insights and Forecast - by Application
- 7. South America Water Treatment Technology Analysis, Insights and Forecast, 2020-2032
- 7.1. Market Analysis, Insights and Forecast - by Application
- 7.1.1. Power & Energy
- 7.1.2. Construction
- 7.1.3. Agriculture
- 7.1.4. Chemicals
- 7.1.5. Mining & Minerals
- 7.1.6. Municipal
- 7.1.7. Other
- 7.2. Market Analysis, Insights and Forecast - by Types
- 7.2.1. Reverse Osmosis
- 7.2.2. Ultrafiltration
- 7.2.3. Microfiltration
- 7.2.4. Electro-dialysis
- 7.2.5. Gas Separation
- 7.1. Market Analysis, Insights and Forecast - by Application
- 8. Europe Water Treatment Technology Analysis, Insights and Forecast, 2020-2032
- 8.1. Market Analysis, Insights and Forecast - by Application
- 8.1.1. Power & Energy
- 8.1.2. Construction
- 8.1.3. Agriculture
- 8.1.4. Chemicals
- 8.1.5. Mining & Minerals
- 8.1.6. Municipal
- 8.1.7. Other
- 8.2. Market Analysis, Insights and Forecast - by Types
- 8.2.1. Reverse Osmosis
- 8.2.2. Ultrafiltration
- 8.2.3. Microfiltration
- 8.2.4. Electro-dialysis
- 8.2.5. Gas Separation
- 8.1. Market Analysis, Insights and Forecast - by Application
- 9. Middle East & Africa Water Treatment Technology Analysis, Insights and Forecast, 2020-2032
- 9.1. Market Analysis, Insights and Forecast - by Application
- 9.1.1. Power & Energy
- 9.1.2. Construction
- 9.1.3. Agriculture
- 9.1.4. Chemicals
- 9.1.5. Mining & Minerals
- 9.1.6. Municipal
- 9.1.7. Other
- 9.2. Market Analysis, Insights and Forecast - by Types
- 9.2.1. Reverse Osmosis
- 9.2.2. Ultrafiltration
- 9.2.3. Microfiltration
- 9.2.4. Electro-dialysis
- 9.2.5. Gas Separation
- 9.1. Market Analysis, Insights and Forecast - by Application
- 10. Asia Pacific Water Treatment Technology Analysis, Insights and Forecast, 2020-2032
- 10.1. Market Analysis, Insights and Forecast - by Application
- 10.1.1. Power & Energy
- 10.1.2. Construction
- 10.1.3. Agriculture
- 10.1.4. Chemicals
- 10.1.5. Mining & Minerals
- 10.1.6. Municipal
- 10.1.7. Other
- 10.2. Market Analysis, Insights and Forecast - by Types
- 10.2.1. Reverse Osmosis
- 10.2.2. Ultrafiltration
- 10.2.3. Microfiltration
- 10.2.4. Electro-dialysis
- 10.2.5. Gas Separation
- 10.1. Market Analysis, Insights and Forecast - by Application
- 11. Competitive Analysis
- 11.1. Global Market Share Analysis 2025
- 11.2. Company Profiles
- 11.2.1 Veolia
- 11.2.1.1. Overview
- 11.2.1.2. Products
- 11.2.1.3. SWOT Analysis
- 11.2.1.4. Recent Developments
- 11.2.1.5. Financials (Based on Availability)
- 11.2.2 BWT
- 11.2.2.1. Overview
- 11.2.2.2. Products
- 11.2.2.3. SWOT Analysis
- 11.2.2.4. Recent Developments
- 11.2.2.5. Financials (Based on Availability)
- 11.2.3 Degremont
- 11.2.3.1. Overview
- 11.2.3.2. Products
- 11.2.3.3. SWOT Analysis
- 11.2.3.4. Recent Developments
- 11.2.3.5. Financials (Based on Availability)
- 11.2.4 SUEZ Water Technologies & Solutions
- 11.2.4.1. Overview
- 11.2.4.2. Products
- 11.2.4.3. SWOT Analysis
- 11.2.4.4. Recent Developments
- 11.2.4.5. Financials (Based on Availability)
- 11.2.5 Pall Corporation
- 11.2.5.1. Overview
- 11.2.5.2. Products
- 11.2.5.3. SWOT Analysis
- 11.2.5.4. Recent Developments
- 11.2.5.5. Financials (Based on Availability)
- 11.2.6 Evoqua Water
- 11.2.6.1. Overview
- 11.2.6.2. Products
- 11.2.6.3. SWOT Analysis
- 11.2.6.4. Recent Developments
- 11.2.6.5. Financials (Based on Availability)
- 11.2.7 Lenntech
- 11.2.7.1. Overview
- 11.2.7.2. Products
- 11.2.7.3. SWOT Analysis
- 11.2.7.4. Recent Developments
- 11.2.7.5. Financials (Based on Availability)
- 11.2.8 Ecolab
- 11.2.8.1. Overview
- 11.2.8.2. Products
- 11.2.8.3. SWOT Analysis
- 11.2.8.4. Recent Developments
- 11.2.8.5. Financials (Based on Availability)
- 11.2.9 Ecolutia
- 11.2.9.1. Overview
- 11.2.9.2. Products
- 11.2.9.3. SWOT Analysis
- 11.2.9.4. Recent Developments
- 11.2.9.5. Financials (Based on Availability)
- 11.2.10 Ovivo
- 11.2.10.1. Overview
- 11.2.10.2. Products
- 11.2.10.3. SWOT Analysis
- 11.2.10.4. Recent Developments
- 11.2.10.5. Financials (Based on Availability)
- 11.2.1 Veolia
List of Figures
- Figure 1: Global Water Treatment Technology Revenue Breakdown (million, %) by Region 2025 & 2033
- Figure 2: North America Water Treatment Technology Revenue (million), by Application 2025 & 2033
- Figure 3: North America Water Treatment Technology Revenue Share (%), by Application 2025 & 2033
- Figure 4: North America Water Treatment Technology Revenue (million), by Types 2025 & 2033
- Figure 5: North America Water Treatment Technology Revenue Share (%), by Types 2025 & 2033
- Figure 6: North America Water Treatment Technology Revenue (million), by Country 2025 & 2033
- Figure 7: North America Water Treatment Technology Revenue Share (%), by Country 2025 & 2033
- Figure 8: South America Water Treatment Technology Revenue (million), by Application 2025 & 2033
- Figure 9: South America Water Treatment Technology Revenue Share (%), by Application 2025 & 2033
- Figure 10: South America Water Treatment Technology Revenue (million), by Types 2025 & 2033
- Figure 11: South America Water Treatment Technology Revenue Share (%), by Types 2025 & 2033
- Figure 12: South America Water Treatment Technology Revenue (million), by Country 2025 & 2033
- Figure 13: South America Water Treatment Technology Revenue Share (%), by Country 2025 & 2033
- Figure 14: Europe Water Treatment Technology Revenue (million), by Application 2025 & 2033
- Figure 15: Europe Water Treatment Technology Revenue Share (%), by Application 2025 & 2033
- Figure 16: Europe Water Treatment Technology Revenue (million), by Types 2025 & 2033
- Figure 17: Europe Water Treatment Technology Revenue Share (%), by Types 2025 & 2033
- Figure 18: Europe Water Treatment Technology Revenue (million), by Country 2025 & 2033
- Figure 19: Europe Water Treatment Technology Revenue Share (%), by Country 2025 & 2033
- Figure 20: Middle East & Africa Water Treatment Technology Revenue (million), by Application 2025 & 2033
- Figure 21: Middle East & Africa Water Treatment Technology Revenue Share (%), by Application 2025 & 2033
- Figure 22: Middle East & Africa Water Treatment Technology Revenue (million), by Types 2025 & 2033
- Figure 23: Middle East & Africa Water Treatment Technology Revenue Share (%), by Types 2025 & 2033
- Figure 24: Middle East & Africa Water Treatment Technology Revenue (million), by Country 2025 & 2033
- Figure 25: Middle East & Africa Water Treatment Technology Revenue Share (%), by Country 2025 & 2033
- Figure 26: Asia Pacific Water Treatment Technology Revenue (million), by Application 2025 & 2033
- Figure 27: Asia Pacific Water Treatment Technology Revenue Share (%), by Application 2025 & 2033
- Figure 28: Asia Pacific Water Treatment Technology Revenue (million), by Types 2025 & 2033
- Figure 29: Asia Pacific Water Treatment Technology Revenue Share (%), by Types 2025 & 2033
- Figure 30: Asia Pacific Water Treatment Technology Revenue (million), by Country 2025 & 2033
- Figure 31: Asia Pacific Water Treatment Technology Revenue Share (%), by Country 2025 & 2033
List of Tables
- Table 1: Global Water Treatment Technology Revenue million Forecast, by Application 2020 & 2033
- Table 2: Global Water Treatment Technology Revenue million Forecast, by Types 2020 & 2033
- Table 3: Global Water Treatment Technology Revenue million Forecast, by Region 2020 & 2033
- Table 4: Global Water Treatment Technology Revenue million Forecast, by Application 2020 & 2033
- Table 5: Global Water Treatment Technology Revenue million Forecast, by Types 2020 & 2033
- Table 6: Global Water Treatment Technology Revenue million Forecast, by Country 2020 & 2033
- Table 7: United States Water Treatment Technology Revenue (million) Forecast, by Application 2020 & 2033
- Table 8: Canada Water Treatment Technology Revenue (million) Forecast, by Application 2020 & 2033
- Table 9: Mexico Water Treatment Technology Revenue (million) Forecast, by Application 2020 & 2033
- Table 10: Global Water Treatment Technology Revenue million Forecast, by Application 2020 & 2033
- Table 11: Global Water Treatment Technology Revenue million Forecast, by Types 2020 & 2033
- Table 12: Global Water Treatment Technology Revenue million Forecast, by Country 2020 & 2033
- Table 13: Brazil Water Treatment Technology Revenue (million) Forecast, by Application 2020 & 2033
- Table 14: Argentina Water Treatment Technology Revenue (million) Forecast, by Application 2020 & 2033
- Table 15: Rest of South America Water Treatment Technology Revenue (million) Forecast, by Application 2020 & 2033
- Table 16: Global Water Treatment Technology Revenue million Forecast, by Application 2020 & 2033
- Table 17: Global Water Treatment Technology Revenue million Forecast, by Types 2020 & 2033
- Table 18: Global Water Treatment Technology Revenue million Forecast, by Country 2020 & 2033
- Table 19: United Kingdom Water Treatment Technology Revenue (million) Forecast, by Application 2020 & 2033
- Table 20: Germany Water Treatment Technology Revenue (million) Forecast, by Application 2020 & 2033
- Table 21: France Water Treatment Technology Revenue (million) Forecast, by Application 2020 & 2033
- Table 22: Italy Water Treatment Technology Revenue (million) Forecast, by Application 2020 & 2033
- Table 23: Spain Water Treatment Technology Revenue (million) Forecast, by Application 2020 & 2033
- Table 24: Russia Water Treatment Technology Revenue (million) Forecast, by Application 2020 & 2033
- Table 25: Benelux Water Treatment Technology Revenue (million) Forecast, by Application 2020 & 2033
- Table 26: Nordics Water Treatment Technology Revenue (million) Forecast, by Application 2020 & 2033
- Table 27: Rest of Europe Water Treatment Technology Revenue (million) Forecast, by Application 2020 & 2033
- Table 28: Global Water Treatment Technology Revenue million Forecast, by Application 2020 & 2033
- Table 29: Global Water Treatment Technology Revenue million Forecast, by Types 2020 & 2033
- Table 30: Global Water Treatment Technology Revenue million Forecast, by Country 2020 & 2033
- Table 31: Turkey Water Treatment Technology Revenue (million) Forecast, by Application 2020 & 2033
- Table 32: Israel Water Treatment Technology Revenue (million) Forecast, by Application 2020 & 2033
- Table 33: GCC Water Treatment Technology Revenue (million) Forecast, by Application 2020 & 2033
- Table 34: North Africa Water Treatment Technology Revenue (million) Forecast, by Application 2020 & 2033
- Table 35: South Africa Water Treatment Technology Revenue (million) Forecast, by Application 2020 & 2033
- Table 36: Rest of Middle East & Africa Water Treatment Technology Revenue (million) Forecast, by Application 2020 & 2033
- Table 37: Global Water Treatment Technology Revenue million Forecast, by Application 2020 & 2033
- Table 38: Global Water Treatment Technology Revenue million Forecast, by Types 2020 & 2033
- Table 39: Global Water Treatment Technology Revenue million Forecast, by Country 2020 & 2033
- Table 40: China Water Treatment Technology Revenue (million) Forecast, by Application 2020 & 2033
- Table 41: India Water Treatment Technology Revenue (million) Forecast, by Application 2020 & 2033
- Table 42: Japan Water Treatment Technology Revenue (million) Forecast, by Application 2020 & 2033
- Table 43: South Korea Water Treatment Technology Revenue (million) Forecast, by Application 2020 & 2033
- Table 44: ASEAN Water Treatment Technology Revenue (million) Forecast, by Application 2020 & 2033
- Table 45: Oceania Water Treatment Technology Revenue (million) Forecast, by Application 2020 & 2033
- Table 46: Rest of Asia Pacific Water Treatment Technology Revenue (million) Forecast, by Application 2020 & 2033
Frequently Asked Questions
1. What is the projected Compound Annual Growth Rate (CAGR) of the Water Treatment Technology?
The projected CAGR is approximately XX%.
2. Which companies are prominent players in the Water Treatment Technology?
Key companies in the market include Veolia, BWT, Degremont, SUEZ Water Technologies & Solutions, Pall Corporation, Evoqua Water, Lenntech, Ecolab, Ecolutia, Ovivo.
3. What are the main segments of the Water Treatment Technology?
The market segments include Application, Types.
4. Can you provide details about the market size?
The market size is estimated to be USD XXX million as of 2022.
5. What are some drivers contributing to market growth?
N/A
6. What are the notable trends driving market growth?
N/A
7. Are there any restraints impacting market growth?
N/A
8. Can you provide examples of recent developments in the market?
N/A
9. What pricing options are available for accessing the report?
Pricing options include single-user, multi-user, and enterprise licenses priced at USD 4900.00, USD 7350.00, and USD 9800.00 respectively.
10. Is the market size provided in terms of value or volume?
The market size is provided in terms of value, measured in million.
11. Are there any specific market keywords associated with the report?
Yes, the market keyword associated with the report is "Water Treatment Technology," which aids in identifying and referencing the specific market segment covered.
12. How do I determine which pricing option suits my needs best?
The pricing options vary based on user requirements and access needs. Individual users may opt for single-user licenses, while businesses requiring broader access may choose multi-user or enterprise licenses for cost-effective access to the report.
13. Are there any additional resources or data provided in the Water Treatment Technology report?
While the report offers comprehensive insights, it's advisable to review the specific contents or supplementary materials provided to ascertain if additional resources or data are available.
14. How can I stay updated on further developments or reports in the Water Treatment Technology?
To stay informed about further developments, trends, and reports in the Water Treatment Technology, consider subscribing to industry newsletters, following relevant companies and organizations, or regularly checking reputable industry news sources and publications.
Methodology
Step 1 - Identification of Relevant Samples Size from Population Database


Step 2 - Approaches for Defining Global Market Size (Value, Volume* & Price*)

Note*: In applicable scenarios
Step 3 - Data Sources
Primary Research
- Web Analytics
- Survey Reports
- Research Institute
- Latest Research Reports
- Opinion Leaders
Secondary Research
- Annual Reports
- White Paper
- Latest Press Release
- Industry Association
- Paid Database
- Investor Presentations

Step 4 - Data Triangulation
Involves using different sources of information in order to increase the validity of a study
These sources are likely to be stakeholders in a program - participants, other researchers, program staff, other community members, and so on.
Then we put all data in single framework & apply various statistical tools to find out the dynamic on the market.
During the analysis stage, feedback from the stakeholder groups would be compared to determine areas of agreement as well as areas of divergence