

Key Insights
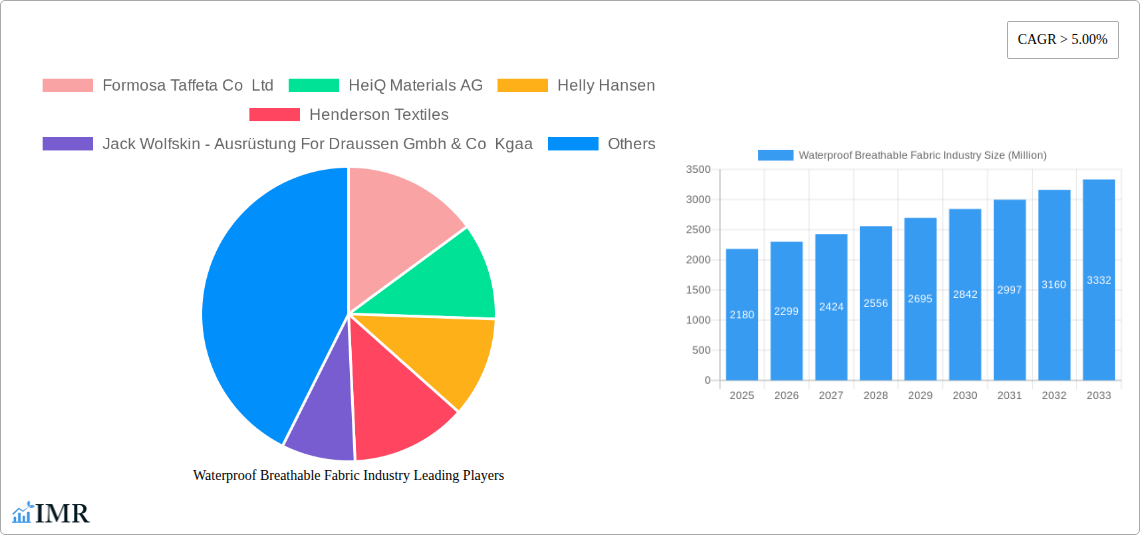
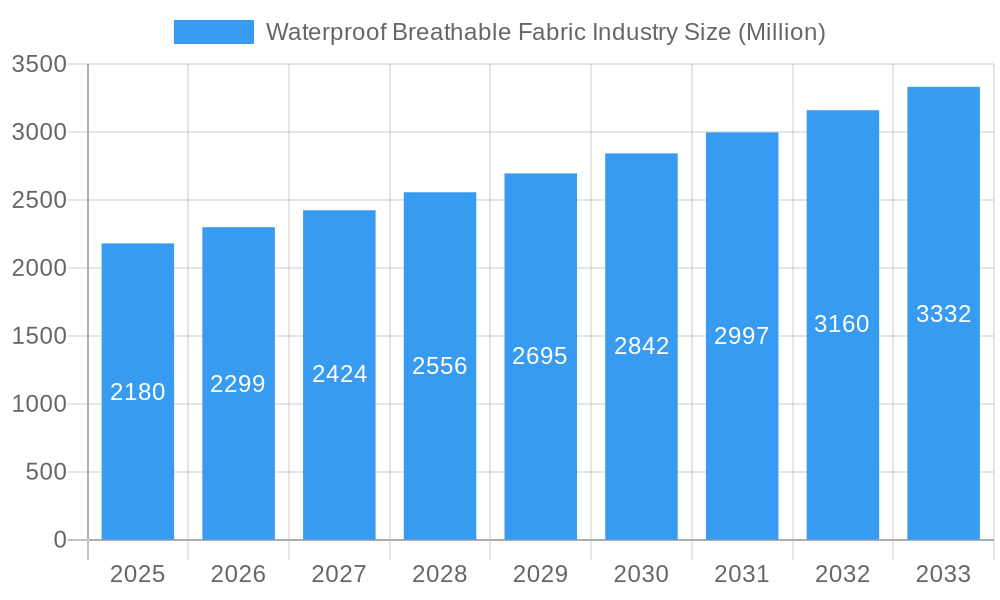
The waterproof breathable fabric market, valued at $2.18 billion in 2025, is projected to experience robust growth, exceeding a 5% Compound Annual Growth Rate (CAGR) through 2033. This expansion is driven by several key factors. The increasing popularity of outdoor activities, such as hiking, camping, and skiing, fuels demand for high-performance apparel and equipment incorporating these fabrics. Simultaneously, advancements in material science are leading to lighter, more durable, and more breathable fabrics with enhanced waterproofing capabilities. The growing awareness of sustainability and the demand for eco-friendly materials are also pushing innovation in this sector, with brands focusing on recycled and biodegradable options. Competitive landscape analysis reveals a mix of established players like Gore-Tex, Polartec, and Sympatex, alongside newer entrants focused on niche technologies. The market's segmentation likely includes categories based on fabric type (e.g., PU coated, PTFE membrane), application (e.g., apparel, footwear, equipment), and end-user (e.g., professional athletes, outdoor enthusiasts). Regional variations in market size will be influenced by factors such as climate, consumer spending power, and the prevalence of outdoor activities in different regions.
Waterproof Breathable Fabric Industry Market Size (In Billion)
The market's continued growth is expected to be influenced by several trends. The integration of smart technologies, such as sensors for temperature regulation and performance monitoring, within waterproof breathable fabrics is likely to gain traction. Furthermore, the increased focus on personalized apparel and the development of bespoke waterproof breathable fabrics tailored to individual needs represents a significant growth opportunity. However, challenges remain, including the potential for high production costs, the complexity of balancing waterproofing and breathability, and concerns about the environmental impact of certain manufacturing processes. Strategies to address these concerns, such as adopting circular economy principles and developing more sustainable manufacturing techniques, will be critical for long-term market success. Companies are likely investing in R&D to improve performance characteristics and address sustainability concerns to maintain their competitive edge.
Waterproof Breathable Fabric Industry Company Market Share
Waterproof Breathable Fabric Industry Market Report: 2019-2033
This comprehensive report provides an in-depth analysis of the waterproof breathable fabric industry, encompassing market dynamics, growth trends, regional analysis, product landscape, key players, and future outlook. The report covers the period from 2019 to 2033, with a focus on the forecast period of 2025-2033 and a base year of 2025. The study examines the parent market of technical textiles and the child market of outdoor apparel and sportswear, providing a granular understanding of this dynamic sector.
Market Size (Million Units): The global waterproof breathable fabric market size was valued at xx Million Units in 2024 and is projected to reach xx Million Units by 2033, exhibiting a CAGR of xx% during the forecast period.
Waterproof Breathable Fabric Industry Market Dynamics & Structure
The waterproof breathable fabric market is characterized by a moderately concentrated landscape, with key players like W. L. Gore & Associates Inc, Polartec, and Toray Industries Inc holding significant market share. Technological innovation, driven by advancements in membrane technology and material science, is a primary growth driver. Stringent environmental regulations and increasing consumer demand for sustainable products are also shaping the industry. Competition from alternative materials, such as traditional waterproof fabrics, influences market dynamics. The end-user demographics are largely driven by outdoor enthusiasts, athletes, and professionals requiring protective apparel. Mergers and acquisitions (M&A) activity has been moderate, with strategic partnerships playing a larger role in market expansion.
- Market Concentration: Moderately concentrated, with top 5 players holding approximately xx% market share in 2024.
- Technological Innovation: Focus on enhancing breathability, durability, and sustainability.
- Regulatory Framework: Increasingly stringent regulations regarding chemical usage and environmental impact.
- Competitive Substitutes: Traditional waterproof fabrics, but with limitations in breathability.
- End-User Demographics: Outdoor enthusiasts, athletes, professionals in various industries.
- M&A Trends: Moderate M&A activity; strategic partnerships are more prevalent. xx major M&A deals were recorded between 2019 and 2024.
Waterproof Breathable Fabric Industry Growth Trends & Insights
The waterproof breathable fabric market has witnessed consistent growth over the past few years, fueled by rising disposable incomes, increasing participation in outdoor activities, and growing awareness of the benefits of advanced protective apparel. Technological advancements, such as the introduction of lighter, more breathable membranes, have accelerated market adoption. Consumer behavior shifts toward premium, high-performance apparel and a preference for sustainable products are impacting market dynamics. The market is segmented by fabric type (e.g., laminated fabrics, coated fabrics), end-use (e.g., apparel, footwear), and region. The adoption rate of advanced waterproof breathable fabrics has been steadily increasing, particularly in developed economies, due to the growing demand for high-performance apparel in sports and outdoor activities. Technological disruptions, such as the development of new membrane technologies and the integration of smart features, are shaping the future of the market.
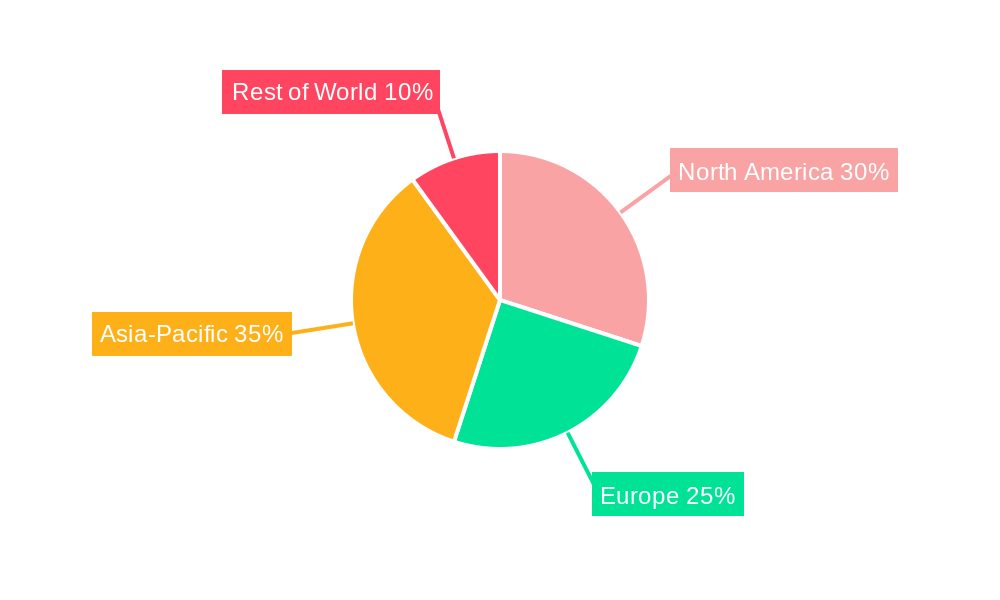
Dominant Regions, Countries, or Segments in Waterproof Breathable Fabric Industry
North America and Europe currently dominate the waterproof breathable fabric market, driven by strong consumer demand for high-performance outdoor apparel and a well-established retail infrastructure. Asia-Pacific is expected to experience significant growth in the coming years, fueled by rising disposable incomes, increased participation in outdoor activities, and a growing middle class. The apparel segment holds the largest market share, followed by footwear. Key drivers in these regions include:
- North America: High disposable incomes, strong outdoor recreation culture.
- Europe: Established sporting goods industry, high consumer awareness of technical apparel.
- Asia-Pacific: Rapid economic growth, expanding middle class, increasing participation in outdoor activities.
- Market Share: North America holds approximately xx% market share, followed by Europe (xx%) and Asia-Pacific (xx%).
- Growth Potential: Asia-Pacific shows the highest growth potential due to rising demand.
Waterproof Breathable Fabric Industry Product Landscape
The waterproof breathable fabric market offers a diverse range of products, varying in terms of membrane technology, construction, weight, and performance characteristics. Innovations include the development of lighter, more breathable membranes, improved durability, and enhanced sustainability features. Key performance metrics include water resistance, breathability, wind resistance, and durability. Unique selling propositions focus on comfort, performance, and sustainability. Technological advancements include the use of recycled materials, bio-based materials, and the integration of smart features such as temperature regulation and moisture-wicking properties.
Key Drivers, Barriers & Challenges in Waterproof Breathable Fabric Industry
Key Drivers:
- Growing demand for outdoor apparel and sportswear.
- Technological advancements in membrane technology.
- Increased consumer awareness of performance and sustainability.
Key Challenges & Restraints:
- High raw material costs
- Intense competition among established players and new entrants.
- Fluctuations in the price of raw materials, affecting production costs.
- Stringent environmental regulations limiting material choices.
Emerging Opportunities in Waterproof Breathable Fabric Industry
- Expansion into untapped markets, particularly in developing economies.
- Development of innovative applications beyond traditional apparel, including protective gear.
- Increased focus on sustainable and eco-friendly products.
Growth Accelerators in the Waterproof Breathable Fabric Industry
Technological breakthroughs in membrane technology, strategic partnerships to expand market reach, and innovative marketing strategies are key catalysts driving long-term growth in the waterproof breathable fabric industry. The development of new materials with enhanced performance characteristics will further accelerate market expansion.
Key Players Shaping the Waterproof Breathable Fabric Industry Market
- Formosa Taffeta Co Ltd
- HeiQ Materials AG
- Helly Hansen
- Henderson Textiles
- Jack Wolfskin - Ausrüstung For Draussen Gmbh & Co Kgaa
- Marmot Mountain LLC
- Pertex
- Polartec
- Schoeller Switzerland
- Stotz & Co AG
- Sympatex
- Teijin Limited
- The North Face A VF Company
- Toray Industries Inc
- W L Gore & Associates Inc
- List Not Exhaustive
Notable Milestones in Waterproof Breathable Fabric Industry Sector
- February 2022: Moncler Grenoble and Polartec collaborated on a new collection, the Grenoble Day-namic line, utilizing Polartec Neoshell technology. This collaboration showcased the high performance and brand recognition of both companies.
- February 2022: Ornot and Polartec launched the Trail Magic Jacket, combining Polartec NeoShell and detachable Polartec Alpha Direct insulation. This highlighted the versatility and adaptability of Polartec's offerings within technical apparel.
In-Depth Waterproof Breathable Fabric Industry Market Outlook
The waterproof breathable fabric market is poised for continued growth, driven by ongoing innovation in material science and increasing consumer demand for high-performance and sustainable apparel. Strategic partnerships and expansion into new market segments will further fuel market expansion. The focus on sustainability and eco-friendly manufacturing processes will also play a crucial role in shaping the future of the industry.
Waterproof Breathable Fabric Industry Segmentation
-
1. Raw Material
- 1.1. Poly Tetra Fluoro Ethylene (PTFE)
- 1.2. Polyester
- 1.3. Polyurethane
- 1.4. Other Raw Materials
-
2. Textile
- 2.1. Densely Woven
- 2.2. Membrane
- 2.3. Coated
-
3. Application
- 3.1. Sportswear and Activewear
- 3.2. Protective and Military
- 3.3. General Clothing and Home Textile
- 3.4. Other Applications
Waterproof Breathable Fabric Industry Segmentation By Geography
-
1. Asia Pacific
- 1.1. China
- 1.2. India
- 1.3. Japan
- 1.4. South Korea
- 1.5. Rest of Asia Pacific
-
2. North America
- 2.1. United States
- 2.2. Canada
- 2.3. Mexico
-
3. Europe
- 3.1. Germany
- 3.2. United Kingdom
- 3.3. France
- 3.4. Italy
- 3.5. Rest of Europe
-
4. South America
- 4.1. Brazil
- 4.2. Argentina
- 4.3. Rest of South America
-
5. Middle East and Africa
- 5.1. Saudi Arabia
- 5.2. South Africa
- 5.3. Rest of Middle East and Africa
Waterproof Breathable Fabric Industry Regional Market Share
Geographic Coverage of Waterproof Breathable Fabric Industry
Waterproof Breathable Fabric Industry REPORT HIGHLIGHTS
| Aspects | Details |
|---|---|
| Study Period | 2020-2034 |
| Base Year | 2025 |
| Estimated Year | 2026 |
| Forecast Period | 2026-2034 |
| Historical Period | 2020-2025 |
| Growth Rate | CAGR of > 5.00% from 2020-2034 |
| Segmentation |
|
Table of Contents
- 1. Introduction
- 1.1. Research Scope
- 1.2. Market Segmentation
- 1.3. Research Objective
- 1.4. Definitions and Assumptions
- 2. Executive Summary
- 2.1. Market Snapshot
- 3. Market Dynamics
- 3.1. Market Drivers
- 3.2. Market Restrains
- 3.3. Market Trends
- 3.4. Market Opportunities
- 4. Market Factor Analysis
- 4.1. Porters Five Forces
- 4.1.1. Bargaining Power of Suppliers
- 4.1.2. Bargaining Power of Buyers
- 4.1.3. Threat of New Entrants
- 4.1.4. Threat of Substitutes
- 4.1.5. Competitive Rivalry
- 4.2. PESTEL analysis
- 4.3. BCG Analysis
- 4.3.1. Stars (High Growth, High Market Share)
- 4.3.2. Cash Cows (Low Growth, High Market Share)
- 4.3.3. Question Mark (High Growth, Low Market Share)
- 4.3.4. Dogs (Low Growth, Low Market Share)
- 4.4. Ansoff Matrix Analysis
- 4.5. Supply Chain Analysis
- 4.6. Regulatory Landscape
- 4.7. Current Market Potential and Opportunity Assessment (TAM–SAM–SOM Framework)
- 4.8. IMR Analyst Note
- 4.1. Porters Five Forces
- 5. Market Analysis, Insights and Forecast 2021-2033
- 5.1. Market Analysis, Insights and Forecast - by Raw Material
- 5.1.1. Poly Tetra Fluoro Ethylene (PTFE)
- 5.1.2. Polyester
- 5.1.3. Polyurethane
- 5.1.4. Other Raw Materials
- 5.2. Market Analysis, Insights and Forecast - by Textile
- 5.2.1. Densely Woven
- 5.2.2. Membrane
- 5.2.3. Coated
- 5.3. Market Analysis, Insights and Forecast - by Application
- 5.3.1. Sportswear and Activewear
- 5.3.2. Protective and Military
- 5.3.3. General Clothing and Home Textile
- 5.3.4. Other Applications
- 5.4. Market Analysis, Insights and Forecast - by Region
- 5.4.1. Asia Pacific
- 5.4.2. North America
- 5.4.3. Europe
- 5.4.4. South America
- 5.4.5. Middle East and Africa
- 5.1. Market Analysis, Insights and Forecast - by Raw Material
- 6. Global Waterproof Breathable Fabric Industry Analysis, Insights and Forecast, 2021-2033
- 6.1. Market Analysis, Insights and Forecast - by Raw Material
- 6.1.1. Poly Tetra Fluoro Ethylene (PTFE)
- 6.1.2. Polyester
- 6.1.3. Polyurethane
- 6.1.4. Other Raw Materials
- 6.2. Market Analysis, Insights and Forecast - by Textile
- 6.2.1. Densely Woven
- 6.2.2. Membrane
- 6.2.3. Coated
- 6.3. Market Analysis, Insights and Forecast - by Application
- 6.3.1. Sportswear and Activewear
- 6.3.2. Protective and Military
- 6.3.3. General Clothing and Home Textile
- 6.3.4. Other Applications
- 6.1. Market Analysis, Insights and Forecast - by Raw Material
- 7. Asia Pacific Waterproof Breathable Fabric Industry Analysis, Insights and Forecast, 2020-2032
- 7.1. Market Analysis, Insights and Forecast - by Raw Material
- 7.1.1. Poly Tetra Fluoro Ethylene (PTFE)
- 7.1.2. Polyester
- 7.1.3. Polyurethane
- 7.1.4. Other Raw Materials
- 7.2. Market Analysis, Insights and Forecast - by Textile
- 7.2.1. Densely Woven
- 7.2.2. Membrane
- 7.2.3. Coated
- 7.3. Market Analysis, Insights and Forecast - by Application
- 7.3.1. Sportswear and Activewear
- 7.3.2. Protective and Military
- 7.3.3. General Clothing and Home Textile
- 7.3.4. Other Applications
- 7.1. Market Analysis, Insights and Forecast - by Raw Material
- 8. North America Waterproof Breathable Fabric Industry Analysis, Insights and Forecast, 2020-2032
- 8.1. Market Analysis, Insights and Forecast - by Raw Material
- 8.1.1. Poly Tetra Fluoro Ethylene (PTFE)
- 8.1.2. Polyester
- 8.1.3. Polyurethane
- 8.1.4. Other Raw Materials
- 8.2. Market Analysis, Insights and Forecast - by Textile
- 8.2.1. Densely Woven
- 8.2.2. Membrane
- 8.2.3. Coated
- 8.3. Market Analysis, Insights and Forecast - by Application
- 8.3.1. Sportswear and Activewear
- 8.3.2. Protective and Military
- 8.3.3. General Clothing and Home Textile
- 8.3.4. Other Applications
- 8.1. Market Analysis, Insights and Forecast - by Raw Material
- 9. Europe Waterproof Breathable Fabric Industry Analysis, Insights and Forecast, 2020-2032
- 9.1. Market Analysis, Insights and Forecast - by Raw Material
- 9.1.1. Poly Tetra Fluoro Ethylene (PTFE)
- 9.1.2. Polyester
- 9.1.3. Polyurethane
- 9.1.4. Other Raw Materials
- 9.2. Market Analysis, Insights and Forecast - by Textile
- 9.2.1. Densely Woven
- 9.2.2. Membrane
- 9.2.3. Coated
- 9.3. Market Analysis, Insights and Forecast - by Application
- 9.3.1. Sportswear and Activewear
- 9.3.2. Protective and Military
- 9.3.3. General Clothing and Home Textile
- 9.3.4. Other Applications
- 9.1. Market Analysis, Insights and Forecast - by Raw Material
- 10. South America Waterproof Breathable Fabric Industry Analysis, Insights and Forecast, 2020-2032
- 10.1. Market Analysis, Insights and Forecast - by Raw Material
- 10.1.1. Poly Tetra Fluoro Ethylene (PTFE)
- 10.1.2. Polyester
- 10.1.3. Polyurethane
- 10.1.4. Other Raw Materials
- 10.2. Market Analysis, Insights and Forecast - by Textile
- 10.2.1. Densely Woven
- 10.2.2. Membrane
- 10.2.3. Coated
- 10.3. Market Analysis, Insights and Forecast - by Application
- 10.3.1. Sportswear and Activewear
- 10.3.2. Protective and Military
- 10.3.3. General Clothing and Home Textile
- 10.3.4. Other Applications
- 10.1. Market Analysis, Insights and Forecast - by Raw Material
- 11. Middle East and Africa Waterproof Breathable Fabric Industry Analysis, Insights and Forecast, 2020-2032
- 11.1. Market Analysis, Insights and Forecast - by Raw Material
- 11.1.1. Poly Tetra Fluoro Ethylene (PTFE)
- 11.1.2. Polyester
- 11.1.3. Polyurethane
- 11.1.4. Other Raw Materials
- 11.2. Market Analysis, Insights and Forecast - by Textile
- 11.2.1. Densely Woven
- 11.2.2. Membrane
- 11.2.3. Coated
- 11.3. Market Analysis, Insights and Forecast - by Application
- 11.3.1. Sportswear and Activewear
- 11.3.2. Protective and Military
- 11.3.3. General Clothing and Home Textile
- 11.3.4. Other Applications
- 11.1. Market Analysis, Insights and Forecast - by Raw Material
- 12. Competitive Analysis
- 12.1. Company Profiles
- 12.1.1 Formosa Taffeta Co Ltd
- 12.1.1.1. Company Overview
- 12.1.1.2. Products
- 12.1.1.3. Company Financials
- 12.1.1.4. SWOT Analysis
- 12.1.2 HeiQ Materials AG
- 12.1.2.1. Company Overview
- 12.1.2.2. Products
- 12.1.2.3. Company Financials
- 12.1.2.4. SWOT Analysis
- 12.1.3 Helly Hansen
- 12.1.3.1. Company Overview
- 12.1.3.2. Products
- 12.1.3.3. Company Financials
- 12.1.3.4. SWOT Analysis
- 12.1.4 Henderson Textiles
- 12.1.4.1. Company Overview
- 12.1.4.2. Products
- 12.1.4.3. Company Financials
- 12.1.4.4. SWOT Analysis
- 12.1.5 Jack Wolfskin - Ausrüstung For Draussen Gmbh & Co Kgaa
- 12.1.5.1. Company Overview
- 12.1.5.2. Products
- 12.1.5.3. Company Financials
- 12.1.5.4. SWOT Analysis
- 12.1.6 Marmot Mountain LLC
- 12.1.6.1. Company Overview
- 12.1.6.2. Products
- 12.1.6.3. Company Financials
- 12.1.6.4. SWOT Analysis
- 12.1.7 Pertex
- 12.1.7.1. Company Overview
- 12.1.7.2. Products
- 12.1.7.3. Company Financials
- 12.1.7.4. SWOT Analysis
- 12.1.8 Polartec
- 12.1.8.1. Company Overview
- 12.1.8.2. Products
- 12.1.8.3. Company Financials
- 12.1.8.4. SWOT Analysis
- 12.1.9 Schoeller Switzerland
- 12.1.9.1. Company Overview
- 12.1.9.2. Products
- 12.1.9.3. Company Financials
- 12.1.9.4. SWOT Analysis
- 12.1.10 Stotz & Co AG
- 12.1.10.1. Company Overview
- 12.1.10.2. Products
- 12.1.10.3. Company Financials
- 12.1.10.4. SWOT Analysis
- 12.1.11 Sympatex
- 12.1.11.1. Company Overview
- 12.1.11.2. Products
- 12.1.11.3. Company Financials
- 12.1.11.4. SWOT Analysis
- 12.1.12 Teijin Limited
- 12.1.12.1. Company Overview
- 12.1.12.2. Products
- 12.1.12.3. Company Financials
- 12.1.12.4. SWOT Analysis
- 12.1.13 The North Face A VF Company
- 12.1.13.1. Company Overview
- 12.1.13.2. Products
- 12.1.13.3. Company Financials
- 12.1.13.4. SWOT Analysis
- 12.1.14 Toray Industries Inc
- 12.1.14.1. Company Overview
- 12.1.14.2. Products
- 12.1.14.3. Company Financials
- 12.1.14.4. SWOT Analysis
- 12.1.15 W L Gore & Associates Inc *List Not Exhaustive
- 12.1.15.1. Company Overview
- 12.1.15.2. Products
- 12.1.15.3. Company Financials
- 12.1.15.4. SWOT Analysis
- 12.1.1 Formosa Taffeta Co Ltd
- 12.2. Market Entropy
- 12.2.1 Company's Key Areas Served
- 12.2.2 Recent Developments
- 12.3. Company Market Share Analysis 2025
- 12.3.1 Top 5 Companies Market Share Analysis
- 12.3.2 Top 3 Companies Market Share Analysis
- 12.4. List of Potential Customers
- 13. Research Methodology
List of Figures
- Figure 1: Global Waterproof Breathable Fabric Industry Revenue Breakdown (Million, %) by Region 2025 & 2033
- Figure 2: Global Waterproof Breathable Fabric Industry Volume Breakdown (Billion, %) by Region 2025 & 2033
- Figure 3: Asia Pacific Waterproof Breathable Fabric Industry Revenue (Million), by Raw Material 2025 & 2033
- Figure 4: Asia Pacific Waterproof Breathable Fabric Industry Volume (Billion), by Raw Material 2025 & 2033
- Figure 5: Asia Pacific Waterproof Breathable Fabric Industry Revenue Share (%), by Raw Material 2025 & 2033
- Figure 6: Asia Pacific Waterproof Breathable Fabric Industry Volume Share (%), by Raw Material 2025 & 2033
- Figure 7: Asia Pacific Waterproof Breathable Fabric Industry Revenue (Million), by Textile 2025 & 2033
- Figure 8: Asia Pacific Waterproof Breathable Fabric Industry Volume (Billion), by Textile 2025 & 2033
- Figure 9: Asia Pacific Waterproof Breathable Fabric Industry Revenue Share (%), by Textile 2025 & 2033
- Figure 10: Asia Pacific Waterproof Breathable Fabric Industry Volume Share (%), by Textile 2025 & 2033
- Figure 11: Asia Pacific Waterproof Breathable Fabric Industry Revenue (Million), by Application 2025 & 2033
- Figure 12: Asia Pacific Waterproof Breathable Fabric Industry Volume (Billion), by Application 2025 & 2033
- Figure 13: Asia Pacific Waterproof Breathable Fabric Industry Revenue Share (%), by Application 2025 & 2033
- Figure 14: Asia Pacific Waterproof Breathable Fabric Industry Volume Share (%), by Application 2025 & 2033
- Figure 15: Asia Pacific Waterproof Breathable Fabric Industry Revenue (Million), by Country 2025 & 2033
- Figure 16: Asia Pacific Waterproof Breathable Fabric Industry Volume (Billion), by Country 2025 & 2033
- Figure 17: Asia Pacific Waterproof Breathable Fabric Industry Revenue Share (%), by Country 2025 & 2033
- Figure 18: Asia Pacific Waterproof Breathable Fabric Industry Volume Share (%), by Country 2025 & 2033
- Figure 19: North America Waterproof Breathable Fabric Industry Revenue (Million), by Raw Material 2025 & 2033
- Figure 20: North America Waterproof Breathable Fabric Industry Volume (Billion), by Raw Material 2025 & 2033
- Figure 21: North America Waterproof Breathable Fabric Industry Revenue Share (%), by Raw Material 2025 & 2033
- Figure 22: North America Waterproof Breathable Fabric Industry Volume Share (%), by Raw Material 2025 & 2033
- Figure 23: North America Waterproof Breathable Fabric Industry Revenue (Million), by Textile 2025 & 2033
- Figure 24: North America Waterproof Breathable Fabric Industry Volume (Billion), by Textile 2025 & 2033
- Figure 25: North America Waterproof Breathable Fabric Industry Revenue Share (%), by Textile 2025 & 2033
- Figure 26: North America Waterproof Breathable Fabric Industry Volume Share (%), by Textile 2025 & 2033
- Figure 27: North America Waterproof Breathable Fabric Industry Revenue (Million), by Application 2025 & 2033
- Figure 28: North America Waterproof Breathable Fabric Industry Volume (Billion), by Application 2025 & 2033
- Figure 29: North America Waterproof Breathable Fabric Industry Revenue Share (%), by Application 2025 & 2033
- Figure 30: North America Waterproof Breathable Fabric Industry Volume Share (%), by Application 2025 & 2033
- Figure 31: North America Waterproof Breathable Fabric Industry Revenue (Million), by Country 2025 & 2033
- Figure 32: North America Waterproof Breathable Fabric Industry Volume (Billion), by Country 2025 & 2033
- Figure 33: North America Waterproof Breathable Fabric Industry Revenue Share (%), by Country 2025 & 2033
- Figure 34: North America Waterproof Breathable Fabric Industry Volume Share (%), by Country 2025 & 2033
- Figure 35: Europe Waterproof Breathable Fabric Industry Revenue (Million), by Raw Material 2025 & 2033
- Figure 36: Europe Waterproof Breathable Fabric Industry Volume (Billion), by Raw Material 2025 & 2033
- Figure 37: Europe Waterproof Breathable Fabric Industry Revenue Share (%), by Raw Material 2025 & 2033
- Figure 38: Europe Waterproof Breathable Fabric Industry Volume Share (%), by Raw Material 2025 & 2033
- Figure 39: Europe Waterproof Breathable Fabric Industry Revenue (Million), by Textile 2025 & 2033
- Figure 40: Europe Waterproof Breathable Fabric Industry Volume (Billion), by Textile 2025 & 2033
- Figure 41: Europe Waterproof Breathable Fabric Industry Revenue Share (%), by Textile 2025 & 2033
- Figure 42: Europe Waterproof Breathable Fabric Industry Volume Share (%), by Textile 2025 & 2033
- Figure 43: Europe Waterproof Breathable Fabric Industry Revenue (Million), by Application 2025 & 2033
- Figure 44: Europe Waterproof Breathable Fabric Industry Volume (Billion), by Application 2025 & 2033
- Figure 45: Europe Waterproof Breathable Fabric Industry Revenue Share (%), by Application 2025 & 2033
- Figure 46: Europe Waterproof Breathable Fabric Industry Volume Share (%), by Application 2025 & 2033
- Figure 47: Europe Waterproof Breathable Fabric Industry Revenue (Million), by Country 2025 & 2033
- Figure 48: Europe Waterproof Breathable Fabric Industry Volume (Billion), by Country 2025 & 2033
- Figure 49: Europe Waterproof Breathable Fabric Industry Revenue Share (%), by Country 2025 & 2033
- Figure 50: Europe Waterproof Breathable Fabric Industry Volume Share (%), by Country 2025 & 2033
- Figure 51: South America Waterproof Breathable Fabric Industry Revenue (Million), by Raw Material 2025 & 2033
- Figure 52: South America Waterproof Breathable Fabric Industry Volume (Billion), by Raw Material 2025 & 2033
- Figure 53: South America Waterproof Breathable Fabric Industry Revenue Share (%), by Raw Material 2025 & 2033
- Figure 54: South America Waterproof Breathable Fabric Industry Volume Share (%), by Raw Material 2025 & 2033
- Figure 55: South America Waterproof Breathable Fabric Industry Revenue (Million), by Textile 2025 & 2033
- Figure 56: South America Waterproof Breathable Fabric Industry Volume (Billion), by Textile 2025 & 2033
- Figure 57: South America Waterproof Breathable Fabric Industry Revenue Share (%), by Textile 2025 & 2033
- Figure 58: South America Waterproof Breathable Fabric Industry Volume Share (%), by Textile 2025 & 2033
- Figure 59: South America Waterproof Breathable Fabric Industry Revenue (Million), by Application 2025 & 2033
- Figure 60: South America Waterproof Breathable Fabric Industry Volume (Billion), by Application 2025 & 2033
- Figure 61: South America Waterproof Breathable Fabric Industry Revenue Share (%), by Application 2025 & 2033
- Figure 62: South America Waterproof Breathable Fabric Industry Volume Share (%), by Application 2025 & 2033
- Figure 63: South America Waterproof Breathable Fabric Industry Revenue (Million), by Country 2025 & 2033
- Figure 64: South America Waterproof Breathable Fabric Industry Volume (Billion), by Country 2025 & 2033
- Figure 65: South America Waterproof Breathable Fabric Industry Revenue Share (%), by Country 2025 & 2033
- Figure 66: South America Waterproof Breathable Fabric Industry Volume Share (%), by Country 2025 & 2033
- Figure 67: Middle East and Africa Waterproof Breathable Fabric Industry Revenue (Million), by Raw Material 2025 & 2033
- Figure 68: Middle East and Africa Waterproof Breathable Fabric Industry Volume (Billion), by Raw Material 2025 & 2033
- Figure 69: Middle East and Africa Waterproof Breathable Fabric Industry Revenue Share (%), by Raw Material 2025 & 2033
- Figure 70: Middle East and Africa Waterproof Breathable Fabric Industry Volume Share (%), by Raw Material 2025 & 2033
- Figure 71: Middle East and Africa Waterproof Breathable Fabric Industry Revenue (Million), by Textile 2025 & 2033
- Figure 72: Middle East and Africa Waterproof Breathable Fabric Industry Volume (Billion), by Textile 2025 & 2033
- Figure 73: Middle East and Africa Waterproof Breathable Fabric Industry Revenue Share (%), by Textile 2025 & 2033
- Figure 74: Middle East and Africa Waterproof Breathable Fabric Industry Volume Share (%), by Textile 2025 & 2033
- Figure 75: Middle East and Africa Waterproof Breathable Fabric Industry Revenue (Million), by Application 2025 & 2033
- Figure 76: Middle East and Africa Waterproof Breathable Fabric Industry Volume (Billion), by Application 2025 & 2033
- Figure 77: Middle East and Africa Waterproof Breathable Fabric Industry Revenue Share (%), by Application 2025 & 2033
- Figure 78: Middle East and Africa Waterproof Breathable Fabric Industry Volume Share (%), by Application 2025 & 2033
- Figure 79: Middle East and Africa Waterproof Breathable Fabric Industry Revenue (Million), by Country 2025 & 2033
- Figure 80: Middle East and Africa Waterproof Breathable Fabric Industry Volume (Billion), by Country 2025 & 2033
- Figure 81: Middle East and Africa Waterproof Breathable Fabric Industry Revenue Share (%), by Country 2025 & 2033
- Figure 82: Middle East and Africa Waterproof Breathable Fabric Industry Volume Share (%), by Country 2025 & 2033
List of Tables
- Table 1: Global Waterproof Breathable Fabric Industry Revenue Million Forecast, by Raw Material 2020 & 2033
- Table 2: Global Waterproof Breathable Fabric Industry Volume Billion Forecast, by Raw Material 2020 & 2033
- Table 3: Global Waterproof Breathable Fabric Industry Revenue Million Forecast, by Textile 2020 & 2033
- Table 4: Global Waterproof Breathable Fabric Industry Volume Billion Forecast, by Textile 2020 & 2033
- Table 5: Global Waterproof Breathable Fabric Industry Revenue Million Forecast, by Application 2020 & 2033
- Table 6: Global Waterproof Breathable Fabric Industry Volume Billion Forecast, by Application 2020 & 2033
- Table 7: Global Waterproof Breathable Fabric Industry Revenue Million Forecast, by Region 2020 & 2033
- Table 8: Global Waterproof Breathable Fabric Industry Volume Billion Forecast, by Region 2020 & 2033
- Table 9: Global Waterproof Breathable Fabric Industry Revenue Million Forecast, by Raw Material 2020 & 2033
- Table 10: Global Waterproof Breathable Fabric Industry Volume Billion Forecast, by Raw Material 2020 & 2033
- Table 11: Global Waterproof Breathable Fabric Industry Revenue Million Forecast, by Textile 2020 & 2033
- Table 12: Global Waterproof Breathable Fabric Industry Volume Billion Forecast, by Textile 2020 & 2033
- Table 13: Global Waterproof Breathable Fabric Industry Revenue Million Forecast, by Application 2020 & 2033
- Table 14: Global Waterproof Breathable Fabric Industry Volume Billion Forecast, by Application 2020 & 2033
- Table 15: Global Waterproof Breathable Fabric Industry Revenue Million Forecast, by Country 2020 & 2033
- Table 16: Global Waterproof Breathable Fabric Industry Volume Billion Forecast, by Country 2020 & 2033
- Table 17: China Waterproof Breathable Fabric Industry Revenue (Million) Forecast, by Application 2020 & 2033
- Table 18: China Waterproof Breathable Fabric Industry Volume (Billion) Forecast, by Application 2020 & 2033
- Table 19: India Waterproof Breathable Fabric Industry Revenue (Million) Forecast, by Application 2020 & 2033
- Table 20: India Waterproof Breathable Fabric Industry Volume (Billion) Forecast, by Application 2020 & 2033
- Table 21: Japan Waterproof Breathable Fabric Industry Revenue (Million) Forecast, by Application 2020 & 2033
- Table 22: Japan Waterproof Breathable Fabric Industry Volume (Billion) Forecast, by Application 2020 & 2033
- Table 23: South Korea Waterproof Breathable Fabric Industry Revenue (Million) Forecast, by Application 2020 & 2033
- Table 24: South Korea Waterproof Breathable Fabric Industry Volume (Billion) Forecast, by Application 2020 & 2033
- Table 25: Rest of Asia Pacific Waterproof Breathable Fabric Industry Revenue (Million) Forecast, by Application 2020 & 2033
- Table 26: Rest of Asia Pacific Waterproof Breathable Fabric Industry Volume (Billion) Forecast, by Application 2020 & 2033
- Table 27: Global Waterproof Breathable Fabric Industry Revenue Million Forecast, by Raw Material 2020 & 2033
- Table 28: Global Waterproof Breathable Fabric Industry Volume Billion Forecast, by Raw Material 2020 & 2033
- Table 29: Global Waterproof Breathable Fabric Industry Revenue Million Forecast, by Textile 2020 & 2033
- Table 30: Global Waterproof Breathable Fabric Industry Volume Billion Forecast, by Textile 2020 & 2033
- Table 31: Global Waterproof Breathable Fabric Industry Revenue Million Forecast, by Application 2020 & 2033
- Table 32: Global Waterproof Breathable Fabric Industry Volume Billion Forecast, by Application 2020 & 2033
- Table 33: Global Waterproof Breathable Fabric Industry Revenue Million Forecast, by Country 2020 & 2033
- Table 34: Global Waterproof Breathable Fabric Industry Volume Billion Forecast, by Country 2020 & 2033
- Table 35: United States Waterproof Breathable Fabric Industry Revenue (Million) Forecast, by Application 2020 & 2033
- Table 36: United States Waterproof Breathable Fabric Industry Volume (Billion) Forecast, by Application 2020 & 2033
- Table 37: Canada Waterproof Breathable Fabric Industry Revenue (Million) Forecast, by Application 2020 & 2033
- Table 38: Canada Waterproof Breathable Fabric Industry Volume (Billion) Forecast, by Application 2020 & 2033
- Table 39: Mexico Waterproof Breathable Fabric Industry Revenue (Million) Forecast, by Application 2020 & 2033
- Table 40: Mexico Waterproof Breathable Fabric Industry Volume (Billion) Forecast, by Application 2020 & 2033
- Table 41: Global Waterproof Breathable Fabric Industry Revenue Million Forecast, by Raw Material 2020 & 2033
- Table 42: Global Waterproof Breathable Fabric Industry Volume Billion Forecast, by Raw Material 2020 & 2033
- Table 43: Global Waterproof Breathable Fabric Industry Revenue Million Forecast, by Textile 2020 & 2033
- Table 44: Global Waterproof Breathable Fabric Industry Volume Billion Forecast, by Textile 2020 & 2033
- Table 45: Global Waterproof Breathable Fabric Industry Revenue Million Forecast, by Application 2020 & 2033
- Table 46: Global Waterproof Breathable Fabric Industry Volume Billion Forecast, by Application 2020 & 2033
- Table 47: Global Waterproof Breathable Fabric Industry Revenue Million Forecast, by Country 2020 & 2033
- Table 48: Global Waterproof Breathable Fabric Industry Volume Billion Forecast, by Country 2020 & 2033
- Table 49: Germany Waterproof Breathable Fabric Industry Revenue (Million) Forecast, by Application 2020 & 2033
- Table 50: Germany Waterproof Breathable Fabric Industry Volume (Billion) Forecast, by Application 2020 & 2033
- Table 51: United Kingdom Waterproof Breathable Fabric Industry Revenue (Million) Forecast, by Application 2020 & 2033
- Table 52: United Kingdom Waterproof Breathable Fabric Industry Volume (Billion) Forecast, by Application 2020 & 2033
- Table 53: France Waterproof Breathable Fabric Industry Revenue (Million) Forecast, by Application 2020 & 2033
- Table 54: France Waterproof Breathable Fabric Industry Volume (Billion) Forecast, by Application 2020 & 2033
- Table 55: Italy Waterproof Breathable Fabric Industry Revenue (Million) Forecast, by Application 2020 & 2033
- Table 56: Italy Waterproof Breathable Fabric Industry Volume (Billion) Forecast, by Application 2020 & 2033
- Table 57: Rest of Europe Waterproof Breathable Fabric Industry Revenue (Million) Forecast, by Application 2020 & 2033
- Table 58: Rest of Europe Waterproof Breathable Fabric Industry Volume (Billion) Forecast, by Application 2020 & 2033
- Table 59: Global Waterproof Breathable Fabric Industry Revenue Million Forecast, by Raw Material 2020 & 2033
- Table 60: Global Waterproof Breathable Fabric Industry Volume Billion Forecast, by Raw Material 2020 & 2033
- Table 61: Global Waterproof Breathable Fabric Industry Revenue Million Forecast, by Textile 2020 & 2033
- Table 62: Global Waterproof Breathable Fabric Industry Volume Billion Forecast, by Textile 2020 & 2033
- Table 63: Global Waterproof Breathable Fabric Industry Revenue Million Forecast, by Application 2020 & 2033
- Table 64: Global Waterproof Breathable Fabric Industry Volume Billion Forecast, by Application 2020 & 2033
- Table 65: Global Waterproof Breathable Fabric Industry Revenue Million Forecast, by Country 2020 & 2033
- Table 66: Global Waterproof Breathable Fabric Industry Volume Billion Forecast, by Country 2020 & 2033
- Table 67: Brazil Waterproof Breathable Fabric Industry Revenue (Million) Forecast, by Application 2020 & 2033
- Table 68: Brazil Waterproof Breathable Fabric Industry Volume (Billion) Forecast, by Application 2020 & 2033
- Table 69: Argentina Waterproof Breathable Fabric Industry Revenue (Million) Forecast, by Application 2020 & 2033
- Table 70: Argentina Waterproof Breathable Fabric Industry Volume (Billion) Forecast, by Application 2020 & 2033
- Table 71: Rest of South America Waterproof Breathable Fabric Industry Revenue (Million) Forecast, by Application 2020 & 2033
- Table 72: Rest of South America Waterproof Breathable Fabric Industry Volume (Billion) Forecast, by Application 2020 & 2033
- Table 73: Global Waterproof Breathable Fabric Industry Revenue Million Forecast, by Raw Material 2020 & 2033
- Table 74: Global Waterproof Breathable Fabric Industry Volume Billion Forecast, by Raw Material 2020 & 2033
- Table 75: Global Waterproof Breathable Fabric Industry Revenue Million Forecast, by Textile 2020 & 2033
- Table 76: Global Waterproof Breathable Fabric Industry Volume Billion Forecast, by Textile 2020 & 2033
- Table 77: Global Waterproof Breathable Fabric Industry Revenue Million Forecast, by Application 2020 & 2033
- Table 78: Global Waterproof Breathable Fabric Industry Volume Billion Forecast, by Application 2020 & 2033
- Table 79: Global Waterproof Breathable Fabric Industry Revenue Million Forecast, by Country 2020 & 2033
- Table 80: Global Waterproof Breathable Fabric Industry Volume Billion Forecast, by Country 2020 & 2033
- Table 81: Saudi Arabia Waterproof Breathable Fabric Industry Revenue (Million) Forecast, by Application 2020 & 2033
- Table 82: Saudi Arabia Waterproof Breathable Fabric Industry Volume (Billion) Forecast, by Application 2020 & 2033
- Table 83: South Africa Waterproof Breathable Fabric Industry Revenue (Million) Forecast, by Application 2020 & 2033
- Table 84: South Africa Waterproof Breathable Fabric Industry Volume (Billion) Forecast, by Application 2020 & 2033
- Table 85: Rest of Middle East and Africa Waterproof Breathable Fabric Industry Revenue (Million) Forecast, by Application 2020 & 2033
- Table 86: Rest of Middle East and Africa Waterproof Breathable Fabric Industry Volume (Billion) Forecast, by Application 2020 & 2033
Frequently Asked Questions
1. What is the projected Compound Annual Growth Rate (CAGR) of the Waterproof Breathable Fabric Industry?
The projected CAGR is approximately > 5.00%.
2. Which companies are prominent players in the Waterproof Breathable Fabric Industry?
Key companies in the market include Formosa Taffeta Co Ltd, HeiQ Materials AG, Helly Hansen, Henderson Textiles, Jack Wolfskin - Ausrüstung For Draussen Gmbh & Co Kgaa, Marmot Mountain LLC, Pertex, Polartec, Schoeller Switzerland, Stotz & Co AG, Sympatex, Teijin Limited, The North Face A VF Company, Toray Industries Inc, W L Gore & Associates Inc *List Not Exhaustive.
3. What are the main segments of the Waterproof Breathable Fabric Industry?
The market segments include Raw Material, Textile, Application.
4. Can you provide details about the market size?
The market size is estimated to be USD 2.18 Million as of 2022.
5. What are some drivers contributing to market growth?
Increasing Demand for Waterproof Breathable Textiles as Protective Wear; Growing Demand from Sportswear and Activewear Industry.
6. What are the notable trends driving market growth?
Sportswear and Activewear Segment Expected to Witness High Growth.
7. Are there any restraints impacting market growth?
Increasing Demand for Waterproof Breathable Textiles as Protective Wear; Growing Demand from Sportswear and Activewear Industry.
8. Can you provide examples of recent developments in the market?
February 2022: Moncler Grenoble and Polartec collaborated on a new collection. Moncler launched its apex award-winning Grenoble Day-namic collection, a new range of activewear. This line makes use of cutting-edge Polartec technology, notably Polartec Neoshell.
9. What pricing options are available for accessing the report?
Pricing options include single-user, multi-user, and enterprise licenses priced at USD 4750, USD 5250, and USD 8750 respectively.
10. Is the market size provided in terms of value or volume?
The market size is provided in terms of value, measured in Million and volume, measured in Billion.
11. Are there any specific market keywords associated with the report?
Yes, the market keyword associated with the report is "Waterproof Breathable Fabric Industry," which aids in identifying and referencing the specific market segment covered.
12. How do I determine which pricing option suits my needs best?
The pricing options vary based on user requirements and access needs. Individual users may opt for single-user licenses, while businesses requiring broader access may choose multi-user or enterprise licenses for cost-effective access to the report.
13. Are there any additional resources or data provided in the Waterproof Breathable Fabric Industry report?
While the report offers comprehensive insights, it's advisable to review the specific contents or supplementary materials provided to ascertain if additional resources or data are available.
14. How can I stay updated on further developments or reports in the Waterproof Breathable Fabric Industry?
To stay informed about further developments, trends, and reports in the Waterproof Breathable Fabric Industry, consider subscribing to industry newsletters, following relevant companies and organizations, or regularly checking reputable industry news sources and publications.
Methodology
Step 1 - Identification of Relevant Samples Size from Population Database


Step 2 - Approaches for Defining Global Market Size (Value, Volume* & Price*)

Note*: In applicable scenarios
Step 3 - Data Sources
Primary Research
- Web Analytics
- Survey Reports
- Research Institute
- Latest Research Reports
- Opinion Leaders
Secondary Research
- Annual Reports
- White Paper
- Latest Press Release
- Industry Association
- Paid Database
- Investor Presentations

Step 4 - Data Triangulation
Involves using different sources of information in order to increase the validity of a study
These sources are likely to be stakeholders in a program - participants, other researchers, program staff, other community members, and so on.
Then we put all data in single framework & apply various statistical tools to find out the dynamic on the market.
During the analysis stage, feedback from the stakeholder groups would be compared to determine areas of agreement as well as areas of divergence