

Key Insights
The Zeolite Molecular Sieve market is poised for substantial expansion, with a projected Compound Annual Growth Rate (CAGR) of 3.9% from 2025 to 2033. This growth trajectory is propelled by escalating demand in critical sectors, notably air purification, driven by heightened environmental awareness and stringent regulatory frameworks. The petrochemical industry's indispensable use of zeolites for catalysis and separation processes further underpins market advancement. Innovations in zeolite synthesis are continuously yielding advanced, specialized sieves for applications in detergents, HVAC, and industrial gas production. The increasing adoption of zeolite-based water and wastewater treatment solutions also contributes significantly to market growth, addressing global water challenges. While raw material price volatility presents a potential constraint, ongoing R&D in cost-effective production methods is mitigating this risk. Robust competition from key players such as BASF SE, Clariant AG, and Kuraray Co Ltd, alongside emerging manufacturers, stimulates innovation and market accessibility. The Asia-Pacific region, led by China and India, is expected to spearhead growth due to rapid industrialization and infrastructure development.
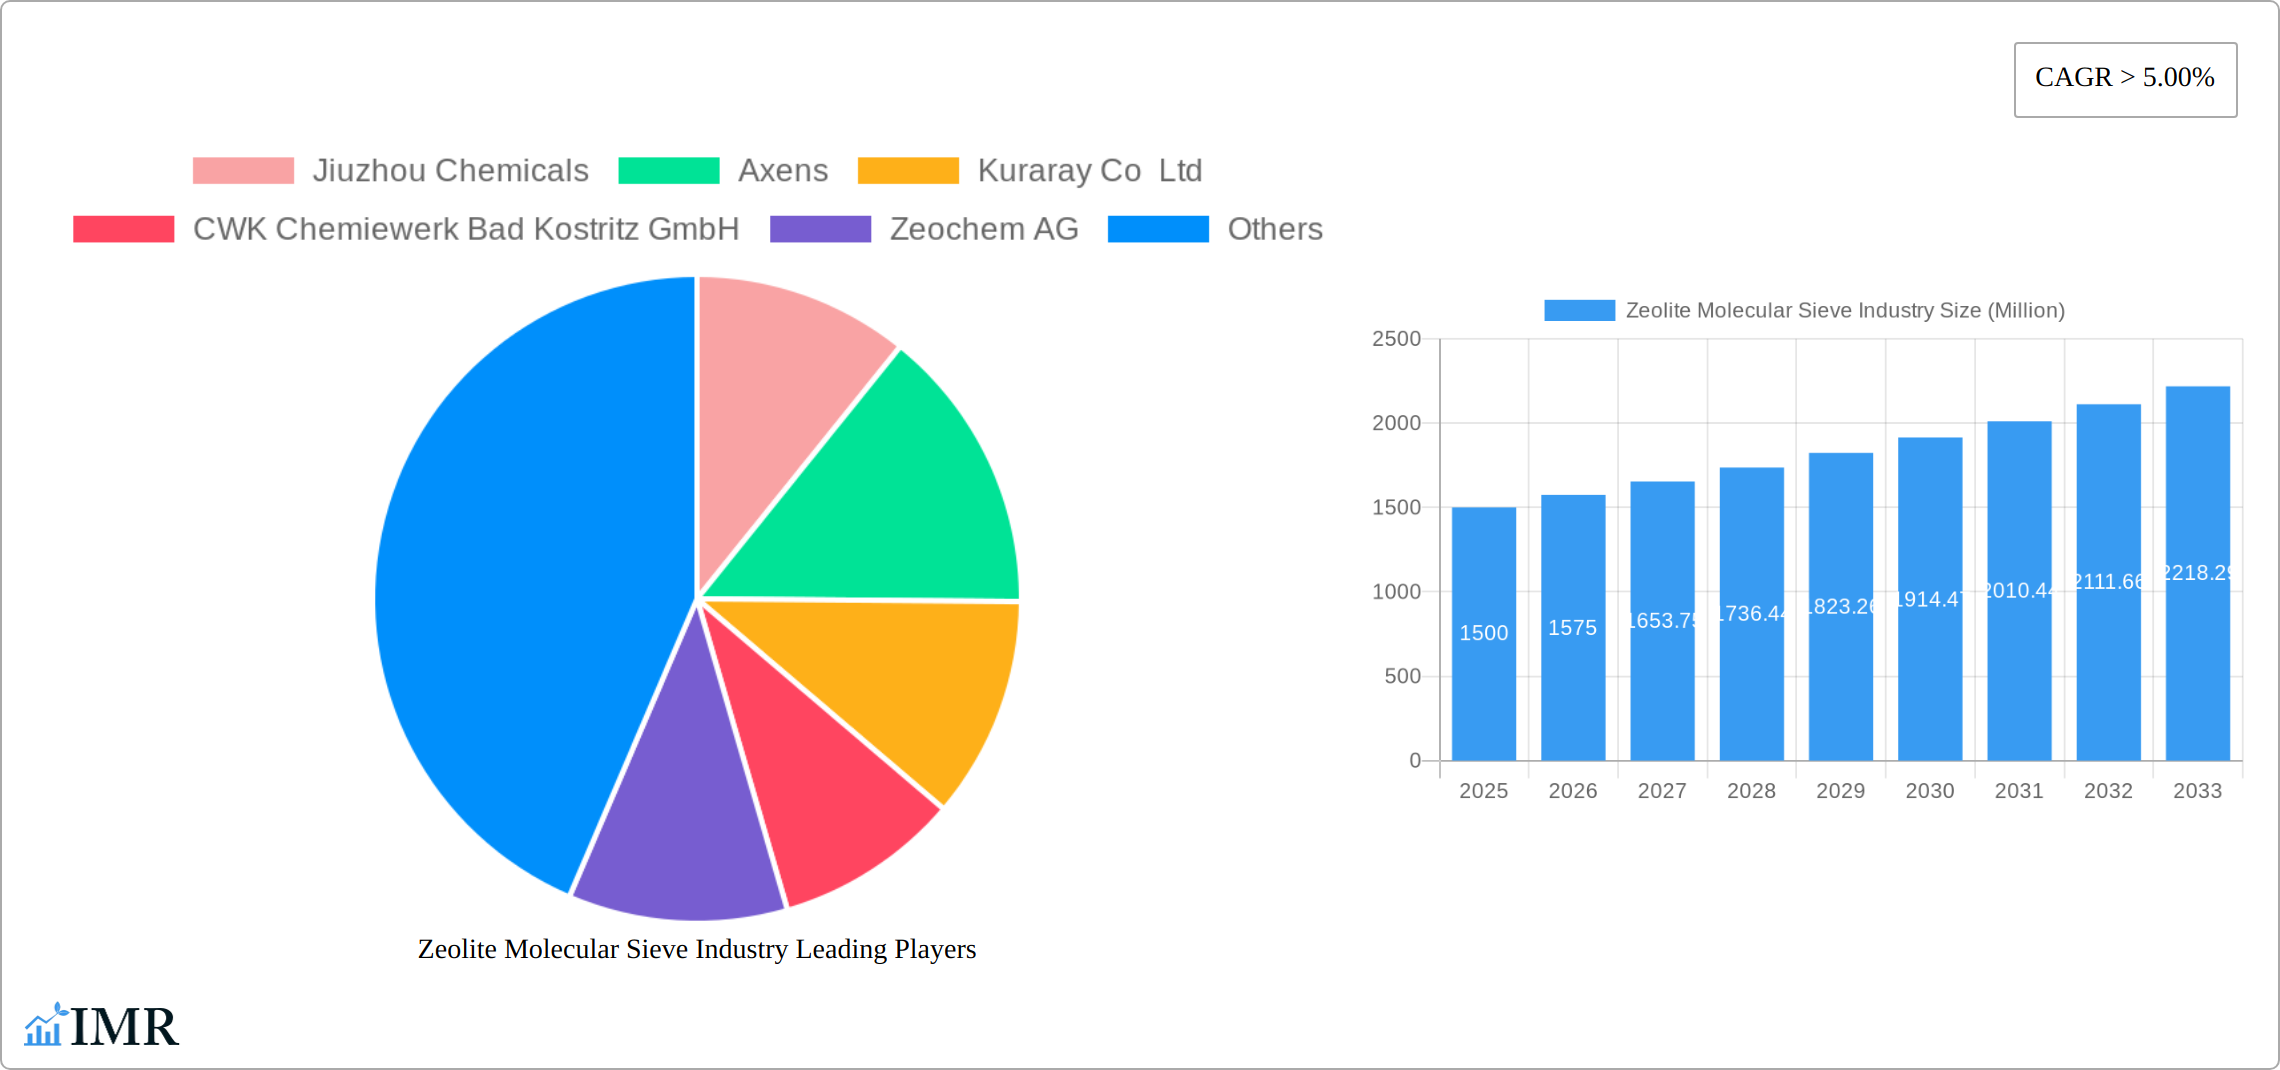
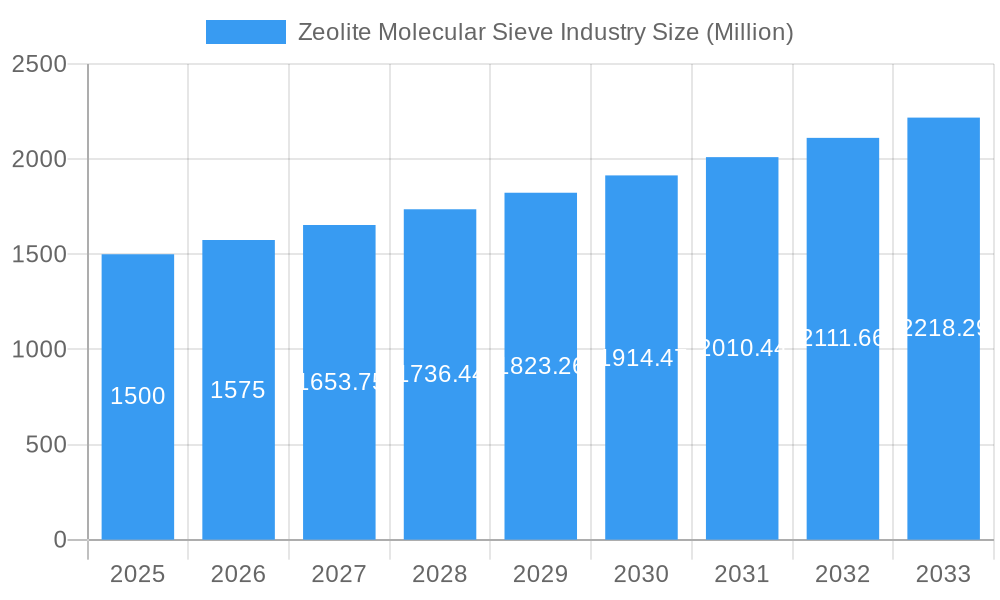
Zeolite Molecular Sieve Industry Market Size (In Billion)
Market segmentation reveals distinct dynamics. While natural zeolites currently lead in the raw material segment, artificial zeolites are experiencing accelerated growth due to superior performance and tailored application capabilities. Air purification and petrochemical applications dominate end-use segments, with significant growth also observed in agricultural products and waste/water treatment, fueled by global environmental consciousness and regulations. North America and Europe currently hold substantial market shares; however, rapid industrialization in Asia-Pacific is set to redefine the regional landscape, making it a pivotal focus for stakeholders. The long-term market outlook remains exceptionally positive, supported by continuous technological innovation and the growing imperative for efficient, sustainable industrial solutions.
Zeolite Molecular Sieve Industry Company Market Share
Zeolite Molecular Sieve Industry Market Report: 2019-2033
This comprehensive report provides a detailed analysis of the Zeolite Molecular Sieve industry, covering market dynamics, growth trends, regional segmentation, product landscape, key players, and future outlook. The study period spans from 2019 to 2033, with 2025 serving as the base and estimated year. The report offers invaluable insights for industry professionals, investors, and stakeholders seeking to understand and navigate this dynamic market. Market values are presented in Million units.
Zeolite Molecular Sieve Industry Market Dynamics & Structure
The Zeolite Molecular Sieve market, a dynamic sector valued at [Insert Updated Market Value in Millions] in 2024, exhibits a moderately consolidated structure. Key players such as BASF SE, Clariant AG, and Zeolyst International, Inc. command significant market share, though the competitive landscape is evolving with both established players and emerging companies actively vying for market position. Technological innovation is a pivotal growth driver, fueled by advancements in synthesis techniques resulting in tailored pore structures optimized for specific applications. This continuous improvement in zeolite properties directly impacts performance metrics like adsorption capacity, selectivity, and hydrothermal stability. Stringent environmental regulations globally, particularly concerning emissions and waste treatment, are significantly shaping market dynamics, boosting the adoption of zeolites across various sectors. While competition exists from alternative adsorbents like activated carbon and silica gel, the inherent advantages of zeolites—high selectivity, thermal stability, and reusability—provide a strong competitive edge. The market has witnessed considerable M&A activity (e.g., [Insert Number] deals in the last 5 years, valued at approximately [Insert Updated Value in Millions]), underscoring the industry's consolidation trend and the pursuit of economies of scale and broader market reach.
- Market Concentration: Moderately consolidated, with the top 5 players holding approximately [Insert Updated Percentage]% market share in 2024. This percentage is expected to [Increase/Decrease/Remain Stable] in the coming years due to [Explain Reasoning].
- Technological Innovation: Ongoing focus on developing zeolites with improved adsorption capacity, selectivity, and hydrothermal stability, including advancements in hierarchical and mesoporous zeolite structures.
- Regulatory Framework: Stringent environmental regulations, particularly those related to emissions and water purification, are driving significant demand growth and shaping market development. [Mention specific regulations if applicable].
- Competitive Substitutes: Activated carbon, silica gel, and other adsorbents present competitive challenges; however, [Explain how Zeolites maintain a competitive advantage in specific niche applications].
- End-User Demographics: Diverse end-use sectors including petrochemicals, refining, industrial gas production, detergents, and air purification, each exhibiting varying growth rates and specific demands based on unique applications. [Elaborate on specific industry growth trends].
- M&A Trends: Continued consolidation through mergers and acquisitions is expected to drive economies of scale, enhance product portfolios, and facilitate access to new technologies and markets.
Zeolite Molecular Sieve Industry Growth Trends & Insights
The Zeolite Molecular Sieve market demonstrated a CAGR of [Insert Updated CAGR]% during the historical period (2019-2024), achieving a market value of [Insert Updated Market Value in Millions] in 2024. This growth is primarily attributed to the robust expansion of the petrochemical and industrial gas production sectors globally, coupled with increasing demand for environmentally friendly solutions in various applications. Technological advancements, including the development of novel zeolite structures with enhanced performance characteristics, further accelerated market growth. Consumer preference shifts towards sustainable and eco-conscious products are particularly boosting adoption rates in waste and water treatment applications. The forecast period (2025-2033) projects continued growth, with a projected CAGR of [Insert Updated CAGR]%, reaching an estimated value of [Insert Updated Projected Value in Millions] by 2033. Significant market penetration in emerging economies, particularly [Mention Specific Regions], is expected to be a key contributor to this upward trajectory. This analysis incorporates data from various reliable sources, including publicly available information and specialized market research reports.
Dominant Regions, Countries, or Segments in Zeolite Molecular Sieve Industry
North America and Asia Pacific are the dominant regions in the Zeolite Molecular Sieve market, driven by robust industrial activities and stringent environmental regulations. Within these regions, China and the United States are leading national markets. The Petrochemical and Industrial Gas Production segments showcase the strongest growth, fueled by rising energy demands and expanding downstream industries. Within raw materials, the Artificial Zeolite segment exhibits a higher growth rate due to its customizable properties and enhanced performance compared to natural zeolites.
- Key Drivers:
- Strong industrial growth in developing economies.
- Stringent environmental regulations promoting cleaner technologies.
- Rising demand from the petrochemical and industrial gas production sectors.
- Dominance Factors:
- Established industrial infrastructure in North America and Asia Pacific.
- Favorable government policies supporting industrial growth and environmental sustainability.
- High market penetration in key end-use segments.
Zeolite Molecular Sieve Industry Product Landscape
The Zeolite Molecular Sieve market encompasses a diverse range of products, each characterized by unique pore sizes, structures, and surface functionalities tailored to meet the specific requirements of various applications. Recent innovations highlight the development of advanced zeolite materials including hierarchical zeolites with enhanced diffusion properties and mesoporous zeolites offering superior adsorption capacity. These advancements result in substantial improvements in key performance metrics such as adsorption selectivity, capacity, and recyclability, ultimately enhancing the overall value proposition for end-users. [Add details about specific product types and their applications].
Key Drivers, Barriers & Challenges in Zeolite Molecular Sieve Industry
Key Drivers: Growing demand from the petrochemical, environmental, and detergent industries; stringent environmental regulations; advancements in synthesis and modification techniques; and the development of new applications in areas such as carbon capture.
Key Challenges: Fluctuations in raw material prices, intense competition from alternative adsorbents, and the need for continuous research and development to improve efficiency and cost-effectiveness. Supply chain disruptions can also impact production and delivery, particularly for specialized zeolite types. Regulatory compliance costs can vary significantly across regions, posing a further challenge.
Emerging Opportunities in Zeolite Molecular Sieve Industry
Significant untapped opportunities exist in developing novel zeolite materials for carbon capture and storage (CCS) technologies, enhanced oil recovery (EOR) processes, and emerging applications within the pharmaceutical and biomedical fields. Further research and development efforts focused on utilizing zeolites in advanced water purification technologies, particularly in addressing specific pollutants like microplastics and emerging contaminants, offer immense potential. The growing global demand for sustainable and eco-friendly materials is actively driving the exploration and implementation of sustainable synthesis routes for zeolite production, minimizing environmental impact and enhancing the overall sustainability profile of this important industry.
Growth Accelerators in the Zeolite Molecular Sieve Industry
Technological breakthroughs in zeolite synthesis, particularly the development of high-performance, tailored materials for specific applications, are key growth catalysts. Strategic partnerships between zeolite manufacturers and end-users to develop customized solutions are accelerating market growth. Market expansion strategies focusing on emerging economies with significant growth potential are also contributing to the overall industry expansion.
Key Players Shaping the Zeolite Molecular Sieve Industry Market
Notable Milestones in Zeolite Molecular Sieve Industry Sector
- 2021: Zeolyst International launched a new line of high-performance zeolite catalysts for the petrochemical industry.
- 2022: BASF SE invested xx Million in expanding its zeolite production capacity in China.
- 2023: A significant merger between two smaller zeolite manufacturers resulted in a larger player in the market. (Further details on mergers require additional research for specific dates and company names).
In-Depth Zeolite Molecular Sieve Industry Market Outlook
The Zeolite Molecular Sieve market is poised for sustained growth over the forecast period, driven by technological advancements, increasing demand from key end-use sectors, and a growing emphasis on environmental sustainability. Strategic partnerships and expansions into emerging markets will further contribute to this positive outlook. The market's future potential lies in developing innovative applications and exploring new functionalities of zeolite materials.
Zeolite Molecular Sieve Industry Segmentation
-
1. Raw Material
- 1.1. Natural Zeolite
- 1.2. Artificial Zeolite
-
2. End-use
- 2.1. Air Purification
- 2.2. Detergent
- 2.3. Heating and Refrigeration
- 2.4. Industrial Gas Production
- 2.5. Petrochemical
- 2.6. Agricultural Products
- 2.7. Waste and Water Treatment
- 2.8. Other End-uses
Zeolite Molecular Sieve Industry Segmentation By Geography
-
1. Asia Pacific
- 1.1. China
- 1.2. India
- 1.3. Japan
- 1.4. South Korea
- 1.5. Rest of Asia Pacific
-
2. North America
- 2.1. United States
- 2.2. Canada
- 2.3. Mexico
-
3. Europe
- 3.1. Germany
- 3.2. United Kingdom
- 3.3. France
- 3.4. Italy
- 3.5. Rest of Europe
-
4. South America
- 4.1. Brazil
- 4.2. Argentina
- 4.3. Rest of South America
- 5. Middle East
-
6. Saudi Arabia
- 6.1. South Africa
- 6.2. Rest of Middle East
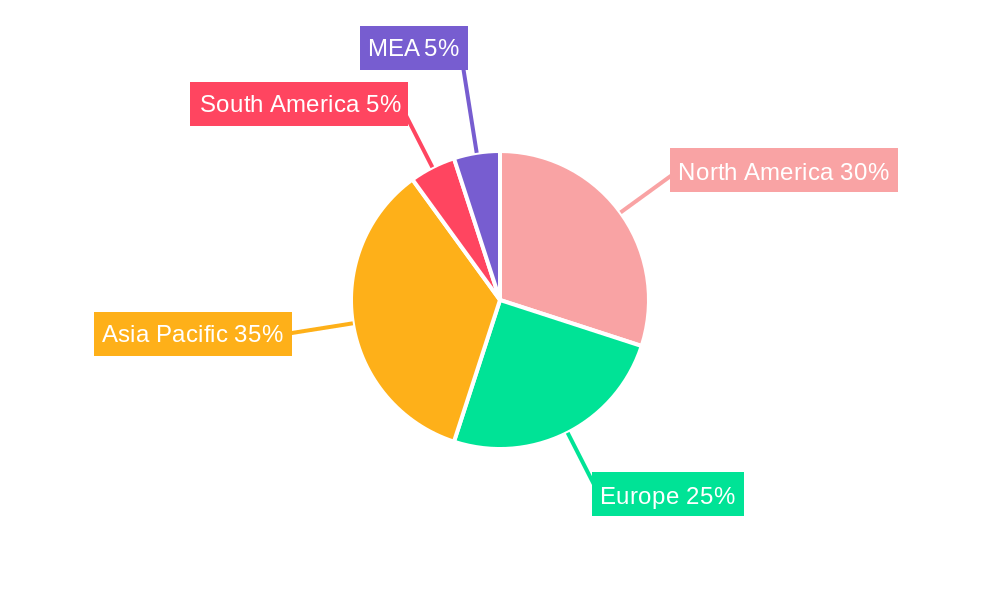
Zeolite Molecular Sieve Industry Regional Market Share
Geographic Coverage of Zeolite Molecular Sieve Industry
Zeolite Molecular Sieve Industry REPORT HIGHLIGHTS
| Aspects | Details |
|---|---|
| Study Period | 2020-2034 |
| Base Year | 2025 |
| Estimated Year | 2026 |
| Forecast Period | 2026-2034 |
| Historical Period | 2020-2025 |
| Growth Rate | CAGR of 3.9% from 2020-2034 |
| Segmentation |
|
Table of Contents
- 1. Introduction
- 1.1. Research Scope
- 1.2. Market Segmentation
- 1.3. Research Objective
- 1.4. Definitions and Assumptions
- 2. Executive Summary
- 2.1. Market Snapshot
- 3. Market Dynamics
- 3.1. Market Drivers
- 3.2. Market Restrains
- 3.3. Market Trends
- 3.4. Market Opportunities
- 4. Market Factor Analysis
- 4.1. Porters Five Forces
- 4.1.1. Bargaining Power of Suppliers
- 4.1.2. Bargaining Power of Buyers
- 4.1.3. Threat of New Entrants
- 4.1.4. Threat of Substitutes
- 4.1.5. Competitive Rivalry
- 4.2. PESTEL analysis
- 4.3. BCG Analysis
- 4.3.1. Stars (High Growth, High Market Share)
- 4.3.2. Cash Cows (Low Growth, High Market Share)
- 4.3.3. Question Mark (High Growth, Low Market Share)
- 4.3.4. Dogs (Low Growth, Low Market Share)
- 4.4. Ansoff Matrix Analysis
- 4.5. Supply Chain Analysis
- 4.6. Regulatory Landscape
- 4.7. Current Market Potential and Opportunity Assessment (TAM–SAM–SOM Framework)
- 4.8. IMR Analyst Note
- 4.1. Porters Five Forces
- 5. Market Analysis, Insights and Forecast 2021-2033
- 5.1. Market Analysis, Insights and Forecast - by Raw Material
- 5.1.1. Natural Zeolite
- 5.1.2. Artificial Zeolite
- 5.2. Market Analysis, Insights and Forecast - by End-use
- 5.2.1. Air Purification
- 5.2.2. Detergent
- 5.2.3. Heating and Refrigeration
- 5.2.4. Industrial Gas Production
- 5.2.5. Petrochemical
- 5.2.6. Agricultural Products
- 5.2.7. Waste and Water Treatment
- 5.2.8. Other End-uses
- 5.3. Market Analysis, Insights and Forecast - by Region
- 5.3.1. Asia Pacific
- 5.3.2. North America
- 5.3.3. Europe
- 5.3.4. South America
- 5.3.5. Middle East
- 5.3.6. Saudi Arabia
- 5.1. Market Analysis, Insights and Forecast - by Raw Material
- 6. Global Zeolite Molecular Sieve Industry Analysis, Insights and Forecast, 2021-2033
- 6.1. Market Analysis, Insights and Forecast - by Raw Material
- 6.1.1. Natural Zeolite
- 6.1.2. Artificial Zeolite
- 6.2. Market Analysis, Insights and Forecast - by End-use
- 6.2.1. Air Purification
- 6.2.2. Detergent
- 6.2.3. Heating and Refrigeration
- 6.2.4. Industrial Gas Production
- 6.2.5. Petrochemical
- 6.2.6. Agricultural Products
- 6.2.7. Waste and Water Treatment
- 6.2.8. Other End-uses
- 6.1. Market Analysis, Insights and Forecast - by Raw Material
- 7. Asia Pacific Zeolite Molecular Sieve Industry Analysis, Insights and Forecast, 2020-2032
- 7.1. Market Analysis, Insights and Forecast - by Raw Material
- 7.1.1. Natural Zeolite
- 7.1.2. Artificial Zeolite
- 7.2. Market Analysis, Insights and Forecast - by End-use
- 7.2.1. Air Purification
- 7.2.2. Detergent
- 7.2.3. Heating and Refrigeration
- 7.2.4. Industrial Gas Production
- 7.2.5. Petrochemical
- 7.2.6. Agricultural Products
- 7.2.7. Waste and Water Treatment
- 7.2.8. Other End-uses
- 7.1. Market Analysis, Insights and Forecast - by Raw Material
- 8. North America Zeolite Molecular Sieve Industry Analysis, Insights and Forecast, 2020-2032
- 8.1. Market Analysis, Insights and Forecast - by Raw Material
- 8.1.1. Natural Zeolite
- 8.1.2. Artificial Zeolite
- 8.2. Market Analysis, Insights and Forecast - by End-use
- 8.2.1. Air Purification
- 8.2.2. Detergent
- 8.2.3. Heating and Refrigeration
- 8.2.4. Industrial Gas Production
- 8.2.5. Petrochemical
- 8.2.6. Agricultural Products
- 8.2.7. Waste and Water Treatment
- 8.2.8. Other End-uses
- 8.1. Market Analysis, Insights and Forecast - by Raw Material
- 9. Europe Zeolite Molecular Sieve Industry Analysis, Insights and Forecast, 2020-2032
- 9.1. Market Analysis, Insights and Forecast - by Raw Material
- 9.1.1. Natural Zeolite
- 9.1.2. Artificial Zeolite
- 9.2. Market Analysis, Insights and Forecast - by End-use
- 9.2.1. Air Purification
- 9.2.2. Detergent
- 9.2.3. Heating and Refrigeration
- 9.2.4. Industrial Gas Production
- 9.2.5. Petrochemical
- 9.2.6. Agricultural Products
- 9.2.7. Waste and Water Treatment
- 9.2.8. Other End-uses
- 9.1. Market Analysis, Insights and Forecast - by Raw Material
- 10. South America Zeolite Molecular Sieve Industry Analysis, Insights and Forecast, 2020-2032
- 10.1. Market Analysis, Insights and Forecast - by Raw Material
- 10.1.1. Natural Zeolite
- 10.1.2. Artificial Zeolite
- 10.2. Market Analysis, Insights and Forecast - by End-use
- 10.2.1. Air Purification
- 10.2.2. Detergent
- 10.2.3. Heating and Refrigeration
- 10.2.4. Industrial Gas Production
- 10.2.5. Petrochemical
- 10.2.6. Agricultural Products
- 10.2.7. Waste and Water Treatment
- 10.2.8. Other End-uses
- 10.1. Market Analysis, Insights and Forecast - by Raw Material
- 11. Middle East Zeolite Molecular Sieve Industry Analysis, Insights and Forecast, 2020-2032
- 11.1. Market Analysis, Insights and Forecast - by Raw Material
- 11.1.1. Natural Zeolite
- 11.1.2. Artificial Zeolite
- 11.2. Market Analysis, Insights and Forecast - by End-use
- 11.2.1. Air Purification
- 11.2.2. Detergent
- 11.2.3. Heating and Refrigeration
- 11.2.4. Industrial Gas Production
- 11.2.5. Petrochemical
- 11.2.6. Agricultural Products
- 11.2.7. Waste and Water Treatment
- 11.2.8. Other End-uses
- 11.1. Market Analysis, Insights and Forecast - by Raw Material
- 12. Saudi Arabia Zeolite Molecular Sieve Industry Analysis, Insights and Forecast, 2020-2032
- 12.1. Market Analysis, Insights and Forecast - by Raw Material
- 12.1.1. Natural Zeolite
- 12.1.2. Artificial Zeolite
- 12.2. Market Analysis, Insights and Forecast - by End-use
- 12.2.1. Air Purification
- 12.2.2. Detergent
- 12.2.3. Heating and Refrigeration
- 12.2.4. Industrial Gas Production
- 12.2.5. Petrochemical
- 12.2.6. Agricultural Products
- 12.2.7. Waste and Water Treatment
- 12.2.8. Other End-uses
- 12.1. Market Analysis, Insights and Forecast - by Raw Material
- 13. Competitive Analysis
- 13.1. Company Profiles
- 13.1.1 Jiuzhou Chemicals
- 13.1.1.1. Company Overview
- 13.1.1.2. Products
- 13.1.1.3. Company Financials
- 13.1.1.4. SWOT Analysis
- 13.1.2 Axens
- 13.1.2.1. Company Overview
- 13.1.2.2. Products
- 13.1.2.3. Company Financials
- 13.1.2.4. SWOT Analysis
- 13.1.3 Kuraray Co Ltd
- 13.1.3.1. Company Overview
- 13.1.3.2. Products
- 13.1.3.3. Company Financials
- 13.1.3.4. SWOT Analysis
- 13.1.4 CWK Chemiewerk Bad Kostritz GmbH
- 13.1.4.1. Company Overview
- 13.1.4.2. Products
- 13.1.4.3. Company Financials
- 13.1.4.4. SWOT Analysis
- 13.1.5 Zeochem AG
- 13.1.5.1. Company Overview
- 13.1.5.2. Products
- 13.1.5.3. Company Financials
- 13.1.5.4. SWOT Analysis
- 13.1.6 Sorbead India
- 13.1.6.1. Company Overview
- 13.1.6.2. Products
- 13.1.6.3. Company Financials
- 13.1.6.4. SWOT Analysis
- 13.1.7 Tosoh Corp
- 13.1.7.1. Company Overview
- 13.1.7.2. Products
- 13.1.7.3. Company Financials
- 13.1.7.4. SWOT Analysis
- 13.1.8 KNT Group
- 13.1.8.1. Company Overview
- 13.1.8.2. Products
- 13.1.8.3. Company Financials
- 13.1.8.4. SWOT Analysis
- 13.1.9 BASF SE
- 13.1.9.1. Company Overview
- 13.1.9.2. Products
- 13.1.9.3. Company Financials
- 13.1.9.4. SWOT Analysis
- 13.1.10 Arkema Group
- 13.1.10.1. Company Overview
- 13.1.10.2. Products
- 13.1.10.3. Company Financials
- 13.1.10.4. SWOT Analysis
- 13.1.11 Zeolyst
- 13.1.11.1. Company Overview
- 13.1.11.2. Products
- 13.1.11.3. Company Financials
- 13.1.11.4. SWOT Analysis
- 13.1.12 Hengye Group
- 13.1.12.1. Company Overview
- 13.1.12.2. Products
- 13.1.12.3. Company Financials
- 13.1.12.4. SWOT Analysis
- 13.1.13 W R Grace
- 13.1.13.1. Company Overview
- 13.1.13.2. Products
- 13.1.13.3. Company Financials
- 13.1.13.4. SWOT Analysis
- 13.1.14 Clariant AG
- 13.1.14.1. Company Overview
- 13.1.14.2. Products
- 13.1.14.3. Company Financials
- 13.1.14.4. SWOT Analysis
- 13.1.1 Jiuzhou Chemicals
- 13.2. Market Entropy
- 13.2.1 Company's Key Areas Served
- 13.2.2 Recent Developments
- 13.3. Company Market Share Analysis 2025
- 13.3.1 Top 5 Companies Market Share Analysis
- 13.3.2 Top 3 Companies Market Share Analysis
- 13.4. List of Potential Customers
- 14. Research Methodology
List of Figures
- Figure 1: Global Zeolite Molecular Sieve Industry Revenue Breakdown (million, %) by Region 2025 & 2033
- Figure 2: Global Zeolite Molecular Sieve Industry Volume Breakdown (K Tons, %) by Region 2025 & 2033
- Figure 3: Asia Pacific Zeolite Molecular Sieve Industry Revenue (million), by Raw Material 2025 & 2033
- Figure 4: Asia Pacific Zeolite Molecular Sieve Industry Volume (K Tons), by Raw Material 2025 & 2033
- Figure 5: Asia Pacific Zeolite Molecular Sieve Industry Revenue Share (%), by Raw Material 2025 & 2033
- Figure 6: Asia Pacific Zeolite Molecular Sieve Industry Volume Share (%), by Raw Material 2025 & 2033
- Figure 7: Asia Pacific Zeolite Molecular Sieve Industry Revenue (million), by End-use 2025 & 2033
- Figure 8: Asia Pacific Zeolite Molecular Sieve Industry Volume (K Tons), by End-use 2025 & 2033
- Figure 9: Asia Pacific Zeolite Molecular Sieve Industry Revenue Share (%), by End-use 2025 & 2033
- Figure 10: Asia Pacific Zeolite Molecular Sieve Industry Volume Share (%), by End-use 2025 & 2033
- Figure 11: Asia Pacific Zeolite Molecular Sieve Industry Revenue (million), by Country 2025 & 2033
- Figure 12: Asia Pacific Zeolite Molecular Sieve Industry Volume (K Tons), by Country 2025 & 2033
- Figure 13: Asia Pacific Zeolite Molecular Sieve Industry Revenue Share (%), by Country 2025 & 2033
- Figure 14: Asia Pacific Zeolite Molecular Sieve Industry Volume Share (%), by Country 2025 & 2033
- Figure 15: North America Zeolite Molecular Sieve Industry Revenue (million), by Raw Material 2025 & 2033
- Figure 16: North America Zeolite Molecular Sieve Industry Volume (K Tons), by Raw Material 2025 & 2033
- Figure 17: North America Zeolite Molecular Sieve Industry Revenue Share (%), by Raw Material 2025 & 2033
- Figure 18: North America Zeolite Molecular Sieve Industry Volume Share (%), by Raw Material 2025 & 2033
- Figure 19: North America Zeolite Molecular Sieve Industry Revenue (million), by End-use 2025 & 2033
- Figure 20: North America Zeolite Molecular Sieve Industry Volume (K Tons), by End-use 2025 & 2033
- Figure 21: North America Zeolite Molecular Sieve Industry Revenue Share (%), by End-use 2025 & 2033
- Figure 22: North America Zeolite Molecular Sieve Industry Volume Share (%), by End-use 2025 & 2033
- Figure 23: North America Zeolite Molecular Sieve Industry Revenue (million), by Country 2025 & 2033
- Figure 24: North America Zeolite Molecular Sieve Industry Volume (K Tons), by Country 2025 & 2033
- Figure 25: North America Zeolite Molecular Sieve Industry Revenue Share (%), by Country 2025 & 2033
- Figure 26: North America Zeolite Molecular Sieve Industry Volume Share (%), by Country 2025 & 2033
- Figure 27: Europe Zeolite Molecular Sieve Industry Revenue (million), by Raw Material 2025 & 2033
- Figure 28: Europe Zeolite Molecular Sieve Industry Volume (K Tons), by Raw Material 2025 & 2033
- Figure 29: Europe Zeolite Molecular Sieve Industry Revenue Share (%), by Raw Material 2025 & 2033
- Figure 30: Europe Zeolite Molecular Sieve Industry Volume Share (%), by Raw Material 2025 & 2033
- Figure 31: Europe Zeolite Molecular Sieve Industry Revenue (million), by End-use 2025 & 2033
- Figure 32: Europe Zeolite Molecular Sieve Industry Volume (K Tons), by End-use 2025 & 2033
- Figure 33: Europe Zeolite Molecular Sieve Industry Revenue Share (%), by End-use 2025 & 2033
- Figure 34: Europe Zeolite Molecular Sieve Industry Volume Share (%), by End-use 2025 & 2033
- Figure 35: Europe Zeolite Molecular Sieve Industry Revenue (million), by Country 2025 & 2033
- Figure 36: Europe Zeolite Molecular Sieve Industry Volume (K Tons), by Country 2025 & 2033
- Figure 37: Europe Zeolite Molecular Sieve Industry Revenue Share (%), by Country 2025 & 2033
- Figure 38: Europe Zeolite Molecular Sieve Industry Volume Share (%), by Country 2025 & 2033
- Figure 39: South America Zeolite Molecular Sieve Industry Revenue (million), by Raw Material 2025 & 2033
- Figure 40: South America Zeolite Molecular Sieve Industry Volume (K Tons), by Raw Material 2025 & 2033
- Figure 41: South America Zeolite Molecular Sieve Industry Revenue Share (%), by Raw Material 2025 & 2033
- Figure 42: South America Zeolite Molecular Sieve Industry Volume Share (%), by Raw Material 2025 & 2033
- Figure 43: South America Zeolite Molecular Sieve Industry Revenue (million), by End-use 2025 & 2033
- Figure 44: South America Zeolite Molecular Sieve Industry Volume (K Tons), by End-use 2025 & 2033
- Figure 45: South America Zeolite Molecular Sieve Industry Revenue Share (%), by End-use 2025 & 2033
- Figure 46: South America Zeolite Molecular Sieve Industry Volume Share (%), by End-use 2025 & 2033
- Figure 47: South America Zeolite Molecular Sieve Industry Revenue (million), by Country 2025 & 2033
- Figure 48: South America Zeolite Molecular Sieve Industry Volume (K Tons), by Country 2025 & 2033
- Figure 49: South America Zeolite Molecular Sieve Industry Revenue Share (%), by Country 2025 & 2033
- Figure 50: South America Zeolite Molecular Sieve Industry Volume Share (%), by Country 2025 & 2033
- Figure 51: Middle East Zeolite Molecular Sieve Industry Revenue (million), by Raw Material 2025 & 2033
- Figure 52: Middle East Zeolite Molecular Sieve Industry Volume (K Tons), by Raw Material 2025 & 2033
- Figure 53: Middle East Zeolite Molecular Sieve Industry Revenue Share (%), by Raw Material 2025 & 2033
- Figure 54: Middle East Zeolite Molecular Sieve Industry Volume Share (%), by Raw Material 2025 & 2033
- Figure 55: Middle East Zeolite Molecular Sieve Industry Revenue (million), by End-use 2025 & 2033
- Figure 56: Middle East Zeolite Molecular Sieve Industry Volume (K Tons), by End-use 2025 & 2033
- Figure 57: Middle East Zeolite Molecular Sieve Industry Revenue Share (%), by End-use 2025 & 2033
- Figure 58: Middle East Zeolite Molecular Sieve Industry Volume Share (%), by End-use 2025 & 2033
- Figure 59: Middle East Zeolite Molecular Sieve Industry Revenue (million), by Country 2025 & 2033
- Figure 60: Middle East Zeolite Molecular Sieve Industry Volume (K Tons), by Country 2025 & 2033
- Figure 61: Middle East Zeolite Molecular Sieve Industry Revenue Share (%), by Country 2025 & 2033
- Figure 62: Middle East Zeolite Molecular Sieve Industry Volume Share (%), by Country 2025 & 2033
- Figure 63: Saudi Arabia Zeolite Molecular Sieve Industry Revenue (million), by Raw Material 2025 & 2033
- Figure 64: Saudi Arabia Zeolite Molecular Sieve Industry Volume (K Tons), by Raw Material 2025 & 2033
- Figure 65: Saudi Arabia Zeolite Molecular Sieve Industry Revenue Share (%), by Raw Material 2025 & 2033
- Figure 66: Saudi Arabia Zeolite Molecular Sieve Industry Volume Share (%), by Raw Material 2025 & 2033
- Figure 67: Saudi Arabia Zeolite Molecular Sieve Industry Revenue (million), by End-use 2025 & 2033
- Figure 68: Saudi Arabia Zeolite Molecular Sieve Industry Volume (K Tons), by End-use 2025 & 2033
- Figure 69: Saudi Arabia Zeolite Molecular Sieve Industry Revenue Share (%), by End-use 2025 & 2033
- Figure 70: Saudi Arabia Zeolite Molecular Sieve Industry Volume Share (%), by End-use 2025 & 2033
- Figure 71: Saudi Arabia Zeolite Molecular Sieve Industry Revenue (million), by Country 2025 & 2033
- Figure 72: Saudi Arabia Zeolite Molecular Sieve Industry Volume (K Tons), by Country 2025 & 2033
- Figure 73: Saudi Arabia Zeolite Molecular Sieve Industry Revenue Share (%), by Country 2025 & 2033
- Figure 74: Saudi Arabia Zeolite Molecular Sieve Industry Volume Share (%), by Country 2025 & 2033
List of Tables
- Table 1: Global Zeolite Molecular Sieve Industry Revenue million Forecast, by Raw Material 2020 & 2033
- Table 2: Global Zeolite Molecular Sieve Industry Volume K Tons Forecast, by Raw Material 2020 & 2033
- Table 3: Global Zeolite Molecular Sieve Industry Revenue million Forecast, by End-use 2020 & 2033
- Table 4: Global Zeolite Molecular Sieve Industry Volume K Tons Forecast, by End-use 2020 & 2033
- Table 5: Global Zeolite Molecular Sieve Industry Revenue million Forecast, by Region 2020 & 2033
- Table 6: Global Zeolite Molecular Sieve Industry Volume K Tons Forecast, by Region 2020 & 2033
- Table 7: Global Zeolite Molecular Sieve Industry Revenue million Forecast, by Raw Material 2020 & 2033
- Table 8: Global Zeolite Molecular Sieve Industry Volume K Tons Forecast, by Raw Material 2020 & 2033
- Table 9: Global Zeolite Molecular Sieve Industry Revenue million Forecast, by End-use 2020 & 2033
- Table 10: Global Zeolite Molecular Sieve Industry Volume K Tons Forecast, by End-use 2020 & 2033
- Table 11: Global Zeolite Molecular Sieve Industry Revenue million Forecast, by Country 2020 & 2033
- Table 12: Global Zeolite Molecular Sieve Industry Volume K Tons Forecast, by Country 2020 & 2033
- Table 13: China Zeolite Molecular Sieve Industry Revenue (million) Forecast, by Application 2020 & 2033
- Table 14: China Zeolite Molecular Sieve Industry Volume (K Tons) Forecast, by Application 2020 & 2033
- Table 15: India Zeolite Molecular Sieve Industry Revenue (million) Forecast, by Application 2020 & 2033
- Table 16: India Zeolite Molecular Sieve Industry Volume (K Tons) Forecast, by Application 2020 & 2033
- Table 17: Japan Zeolite Molecular Sieve Industry Revenue (million) Forecast, by Application 2020 & 2033
- Table 18: Japan Zeolite Molecular Sieve Industry Volume (K Tons) Forecast, by Application 2020 & 2033
- Table 19: South Korea Zeolite Molecular Sieve Industry Revenue (million) Forecast, by Application 2020 & 2033
- Table 20: South Korea Zeolite Molecular Sieve Industry Volume (K Tons) Forecast, by Application 2020 & 2033
- Table 21: Rest of Asia Pacific Zeolite Molecular Sieve Industry Revenue (million) Forecast, by Application 2020 & 2033
- Table 22: Rest of Asia Pacific Zeolite Molecular Sieve Industry Volume (K Tons) Forecast, by Application 2020 & 2033
- Table 23: Global Zeolite Molecular Sieve Industry Revenue million Forecast, by Raw Material 2020 & 2033
- Table 24: Global Zeolite Molecular Sieve Industry Volume K Tons Forecast, by Raw Material 2020 & 2033
- Table 25: Global Zeolite Molecular Sieve Industry Revenue million Forecast, by End-use 2020 & 2033
- Table 26: Global Zeolite Molecular Sieve Industry Volume K Tons Forecast, by End-use 2020 & 2033
- Table 27: Global Zeolite Molecular Sieve Industry Revenue million Forecast, by Country 2020 & 2033
- Table 28: Global Zeolite Molecular Sieve Industry Volume K Tons Forecast, by Country 2020 & 2033
- Table 29: United States Zeolite Molecular Sieve Industry Revenue (million) Forecast, by Application 2020 & 2033
- Table 30: United States Zeolite Molecular Sieve Industry Volume (K Tons) Forecast, by Application 2020 & 2033
- Table 31: Canada Zeolite Molecular Sieve Industry Revenue (million) Forecast, by Application 2020 & 2033
- Table 32: Canada Zeolite Molecular Sieve Industry Volume (K Tons) Forecast, by Application 2020 & 2033
- Table 33: Mexico Zeolite Molecular Sieve Industry Revenue (million) Forecast, by Application 2020 & 2033
- Table 34: Mexico Zeolite Molecular Sieve Industry Volume (K Tons) Forecast, by Application 2020 & 2033
- Table 35: Global Zeolite Molecular Sieve Industry Revenue million Forecast, by Raw Material 2020 & 2033
- Table 36: Global Zeolite Molecular Sieve Industry Volume K Tons Forecast, by Raw Material 2020 & 2033
- Table 37: Global Zeolite Molecular Sieve Industry Revenue million Forecast, by End-use 2020 & 2033
- Table 38: Global Zeolite Molecular Sieve Industry Volume K Tons Forecast, by End-use 2020 & 2033
- Table 39: Global Zeolite Molecular Sieve Industry Revenue million Forecast, by Country 2020 & 2033
- Table 40: Global Zeolite Molecular Sieve Industry Volume K Tons Forecast, by Country 2020 & 2033
- Table 41: Germany Zeolite Molecular Sieve Industry Revenue (million) Forecast, by Application 2020 & 2033
- Table 42: Germany Zeolite Molecular Sieve Industry Volume (K Tons) Forecast, by Application 2020 & 2033
- Table 43: United Kingdom Zeolite Molecular Sieve Industry Revenue (million) Forecast, by Application 2020 & 2033
- Table 44: United Kingdom Zeolite Molecular Sieve Industry Volume (K Tons) Forecast, by Application 2020 & 2033
- Table 45: France Zeolite Molecular Sieve Industry Revenue (million) Forecast, by Application 2020 & 2033
- Table 46: France Zeolite Molecular Sieve Industry Volume (K Tons) Forecast, by Application 2020 & 2033
- Table 47: Italy Zeolite Molecular Sieve Industry Revenue (million) Forecast, by Application 2020 & 2033
- Table 48: Italy Zeolite Molecular Sieve Industry Volume (K Tons) Forecast, by Application 2020 & 2033
- Table 49: Rest of Europe Zeolite Molecular Sieve Industry Revenue (million) Forecast, by Application 2020 & 2033
- Table 50: Rest of Europe Zeolite Molecular Sieve Industry Volume (K Tons) Forecast, by Application 2020 & 2033
- Table 51: Global Zeolite Molecular Sieve Industry Revenue million Forecast, by Raw Material 2020 & 2033
- Table 52: Global Zeolite Molecular Sieve Industry Volume K Tons Forecast, by Raw Material 2020 & 2033
- Table 53: Global Zeolite Molecular Sieve Industry Revenue million Forecast, by End-use 2020 & 2033
- Table 54: Global Zeolite Molecular Sieve Industry Volume K Tons Forecast, by End-use 2020 & 2033
- Table 55: Global Zeolite Molecular Sieve Industry Revenue million Forecast, by Country 2020 & 2033
- Table 56: Global Zeolite Molecular Sieve Industry Volume K Tons Forecast, by Country 2020 & 2033
- Table 57: Brazil Zeolite Molecular Sieve Industry Revenue (million) Forecast, by Application 2020 & 2033
- Table 58: Brazil Zeolite Molecular Sieve Industry Volume (K Tons) Forecast, by Application 2020 & 2033
- Table 59: Argentina Zeolite Molecular Sieve Industry Revenue (million) Forecast, by Application 2020 & 2033
- Table 60: Argentina Zeolite Molecular Sieve Industry Volume (K Tons) Forecast, by Application 2020 & 2033
- Table 61: Rest of South America Zeolite Molecular Sieve Industry Revenue (million) Forecast, by Application 2020 & 2033
- Table 62: Rest of South America Zeolite Molecular Sieve Industry Volume (K Tons) Forecast, by Application 2020 & 2033
- Table 63: Global Zeolite Molecular Sieve Industry Revenue million Forecast, by Raw Material 2020 & 2033
- Table 64: Global Zeolite Molecular Sieve Industry Volume K Tons Forecast, by Raw Material 2020 & 2033
- Table 65: Global Zeolite Molecular Sieve Industry Revenue million Forecast, by End-use 2020 & 2033
- Table 66: Global Zeolite Molecular Sieve Industry Volume K Tons Forecast, by End-use 2020 & 2033
- Table 67: Global Zeolite Molecular Sieve Industry Revenue million Forecast, by Country 2020 & 2033
- Table 68: Global Zeolite Molecular Sieve Industry Volume K Tons Forecast, by Country 2020 & 2033
- Table 69: Global Zeolite Molecular Sieve Industry Revenue million Forecast, by Raw Material 2020 & 2033
- Table 70: Global Zeolite Molecular Sieve Industry Volume K Tons Forecast, by Raw Material 2020 & 2033
- Table 71: Global Zeolite Molecular Sieve Industry Revenue million Forecast, by End-use 2020 & 2033
- Table 72: Global Zeolite Molecular Sieve Industry Volume K Tons Forecast, by End-use 2020 & 2033
- Table 73: Global Zeolite Molecular Sieve Industry Revenue million Forecast, by Country 2020 & 2033
- Table 74: Global Zeolite Molecular Sieve Industry Volume K Tons Forecast, by Country 2020 & 2033
- Table 75: South Africa Zeolite Molecular Sieve Industry Revenue (million) Forecast, by Application 2020 & 2033
- Table 76: South Africa Zeolite Molecular Sieve Industry Volume (K Tons) Forecast, by Application 2020 & 2033
- Table 77: Rest of Middle East Zeolite Molecular Sieve Industry Revenue (million) Forecast, by Application 2020 & 2033
- Table 78: Rest of Middle East Zeolite Molecular Sieve Industry Volume (K Tons) Forecast, by Application 2020 & 2033
Frequently Asked Questions
1. What is the projected Compound Annual Growth Rate (CAGR) of the Zeolite Molecular Sieve Industry?
The projected CAGR is approximately 3.9%.
2. Which companies are prominent players in the Zeolite Molecular Sieve Industry?
Key companies in the market include Jiuzhou Chemicals, Axens, Kuraray Co Ltd, CWK Chemiewerk Bad Kostritz GmbH, Zeochem AG, Sorbead India, Tosoh Corp, KNT Group, BASF SE, Arkema Group, Zeolyst, Hengye Group, W R Grace, Clariant AG.
3. What are the main segments of the Zeolite Molecular Sieve Industry?
The market segments include Raw Material, End-use.
4. Can you provide details about the market size?
The market size is estimated to be USD 1729 million as of 2022.
5. What are some drivers contributing to market growth?
; Rising Awareness for Treatment of Hazardous Organic Materials in Wastewater; High Demand from the Detergent Market.
6. What are the notable trends driving market growth?
Detergent Segment to Dominate the Market Demand.
7. Are there any restraints impacting market growth?
; Threat from Chemical Composites. Enzymes. and Other Substitutes.
8. Can you provide examples of recent developments in the market?
N/A
9. What pricing options are available for accessing the report?
Pricing options include single-user, multi-user, and enterprise licenses priced at USD 4750, USD 5250, and USD 8750 respectively.
10. Is the market size provided in terms of value or volume?
The market size is provided in terms of value, measured in million and volume, measured in K Tons.
11. Are there any specific market keywords associated with the report?
Yes, the market keyword associated with the report is "Zeolite Molecular Sieve Industry," which aids in identifying and referencing the specific market segment covered.
12. How do I determine which pricing option suits my needs best?
The pricing options vary based on user requirements and access needs. Individual users may opt for single-user licenses, while businesses requiring broader access may choose multi-user or enterprise licenses for cost-effective access to the report.
13. Are there any additional resources or data provided in the Zeolite Molecular Sieve Industry report?
While the report offers comprehensive insights, it's advisable to review the specific contents or supplementary materials provided to ascertain if additional resources or data are available.
14. How can I stay updated on further developments or reports in the Zeolite Molecular Sieve Industry?
To stay informed about further developments, trends, and reports in the Zeolite Molecular Sieve Industry, consider subscribing to industry newsletters, following relevant companies and organizations, or regularly checking reputable industry news sources and publications.
Methodology
Step 1 - Identification of Relevant Samples Size from Population Database


Step 2 - Approaches for Defining Global Market Size (Value, Volume* & Price*)

Note*: In applicable scenarios
Step 3 - Data Sources
Primary Research
- Web Analytics
- Survey Reports
- Research Institute
- Latest Research Reports
- Opinion Leaders
Secondary Research
- Annual Reports
- White Paper
- Latest Press Release
- Industry Association
- Paid Database
- Investor Presentations

Step 4 - Data Triangulation
Involves using different sources of information in order to increase the validity of a study
These sources are likely to be stakeholders in a program - participants, other researchers, program staff, other community members, and so on.
Then we put all data in single framework & apply various statistical tools to find out the dynamic on the market.
During the analysis stage, feedback from the stakeholder groups would be compared to determine areas of agreement as well as areas of divergence