

Key Insights
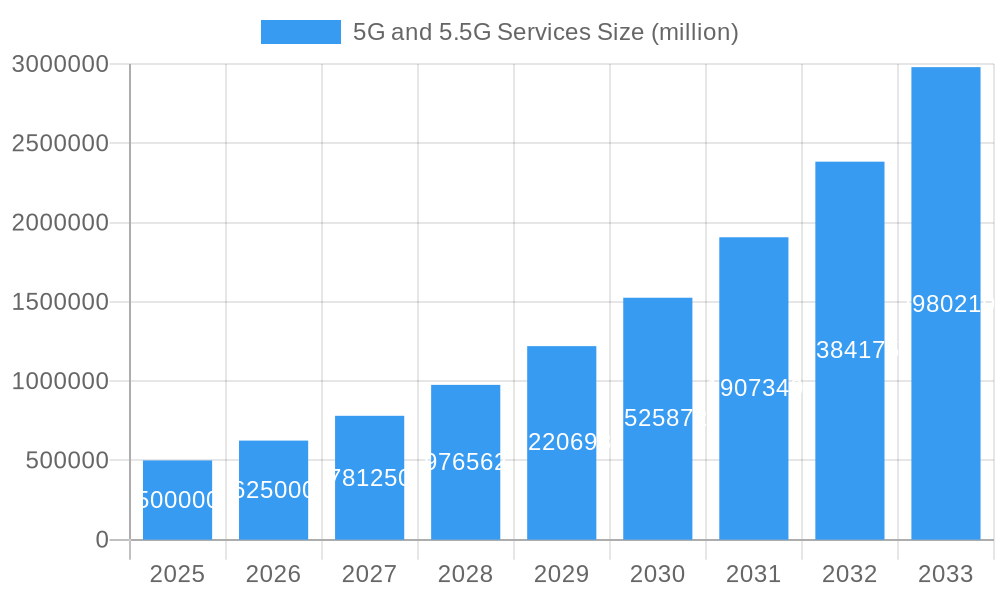
The global 5G and 5.5G services market is experiencing explosive growth, driven by increasing demand for high-speed data, low latency applications, and the proliferation of connected devices. The market, estimated at $500 billion in 2025, is projected to achieve a Compound Annual Growth Rate (CAGR) of 25% from 2025 to 2033, reaching approximately $2.5 trillion by 2033. Key drivers include the ongoing rollout of 5G infrastructure globally, the increasing adoption of 5G-enabled smartphones and IoT devices, and the emergence of new applications like augmented reality (AR), virtual reality (VR), and autonomous vehicles. Significant investments from both telecommunication companies and governments are fueling this expansion. Furthermore, the evolution to 5.5G, focusing on enhanced capabilities such as network slicing and improved spectral efficiency, is expected to further accelerate market growth in the latter half of the forecast period. Challenges remain, including the high cost of infrastructure deployment, spectrum scarcity in certain regions, and the need for standardized interoperability across different vendors and technologies.
5G and 5.5G Services Market Size (In Billion)
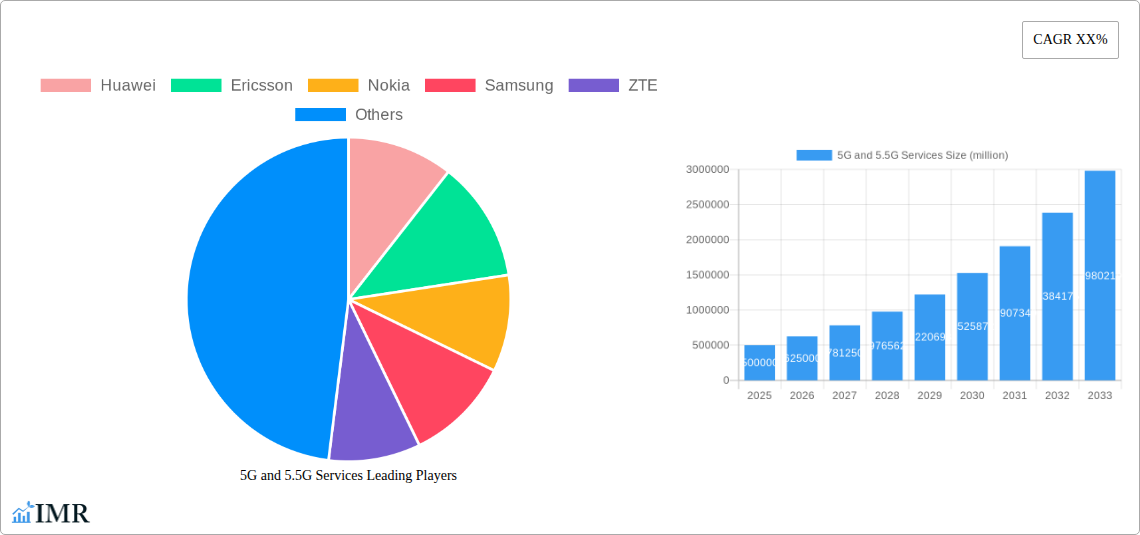
Market segmentation reveals a strong influence from key players such as Huawei, Ericsson, Nokia, Samsung, and ZTE in the network infrastructure segment. Meanwhile, leading telecommunication providers like Verizon, AT&T, Vodafone, and others are pivotal in driving adoption through service offerings. Regional variations exist, with North America and Asia-Pacific leading in market share due to early and extensive 5G deployments. However, Europe and other regions are rapidly catching up, fueled by increased government support and private investment. The competitive landscape is intense, with ongoing innovation in network technologies and service offerings shaping the market dynamics. The continuous development of 5.5G technology, aiming to increase speed and capacity, promises further expansion and opportunities for market participants.
5G and 5.5G Services Company Market Share
5G and 5.5G Services Market Report: 2019-2033
This comprehensive report provides an in-depth analysis of the global 5G and 5.5G services market, encompassing market dynamics, growth trends, regional dominance, product landscape, challenges, opportunities, and key players. The study period covers 2019-2033, with 2025 as the base and estimated year. The forecast period is 2025-2033, and the historical period is 2019-2024. This report is essential for telecom operators, equipment vendors, investors, and industry professionals seeking to navigate the rapidly evolving landscape of next-generation wireless technologies.
5G and 5.5G Services Market Dynamics & Structure
This section analyzes the market structure, identifying key players and their market share, alongside technological innovation drivers and regulatory influences. We delve into competitive dynamics, including the impact of substitute technologies and mergers & acquisitions (M&A) activity. The analysis considers end-user demographics and their impact on market segmentation.
- Market Concentration: The global 5G and 5.5G services market exhibits moderate concentration, with a few dominant players holding significant market share. In 2025, the top five players (Huawei, Ericsson, Nokia, Samsung, and ZTE) are estimated to collectively control approximately xx% of the market.
- Technological Innovation: Key drivers include advancements in antenna technology (Massive MIMO), network slicing, edge computing, and AI-driven network optimization.
- Regulatory Frameworks: Government policies and spectrum allocation significantly impact market growth. Differing regulations across regions create both opportunities and challenges.
- Competitive Substitutes: Fixed-line broadband and other wireless technologies remain competitive substitutes, particularly in areas with limited 5G/5.5G infrastructure.
- M&A Activity: The number of M&A deals in the 5G/5.5G sector increased significantly from xx million in 2019 to xx million in 2024. Consolidation is expected to continue.
- End-User Demographics: Growth is fueled by increasing smartphone penetration, rising data consumption, and the adoption of 5G/5.5G-enabled devices across various demographics.
5G and 5.5G Services Growth Trends & Insights
This section provides a detailed analysis of market size evolution, adoption rates, and technological disruptions. It examines the impact of consumer behavior shifts and provides projections for future market growth. We leverage extensive data analysis to offer insights into CAGR and market penetration.
The global 5G and 5.5G services market is experiencing exponential growth. Market size increased from xx million units in 2019 to xx million units in 2024, and is projected to reach xx million units by 2033. This translates to a CAGR of xx% during the forecast period. Market penetration is expected to increase from xx% in 2025 to xx% by 2033, driven by increased affordability, wider network coverage, and the proliferation of 5G/5.5G-enabled devices. Technological disruptions, such as the introduction of 5.5G and the expansion of private 5G networks, will further fuel this growth. Consumer behavior is shifting towards higher data consumption and reliance on data-intensive applications, strengthening the demand for high-speed 5G/5.5G services. The transition to 5.5G will accelerate data speeds, reduce latency, and unlock new applications in areas like IoT and AR/VR, further propelling market expansion.
Dominant Regions, Countries, or Segments in 5G and 5.5G Services
This section identifies the leading regions and countries driving market growth, analyzing dominance factors and growth potential.
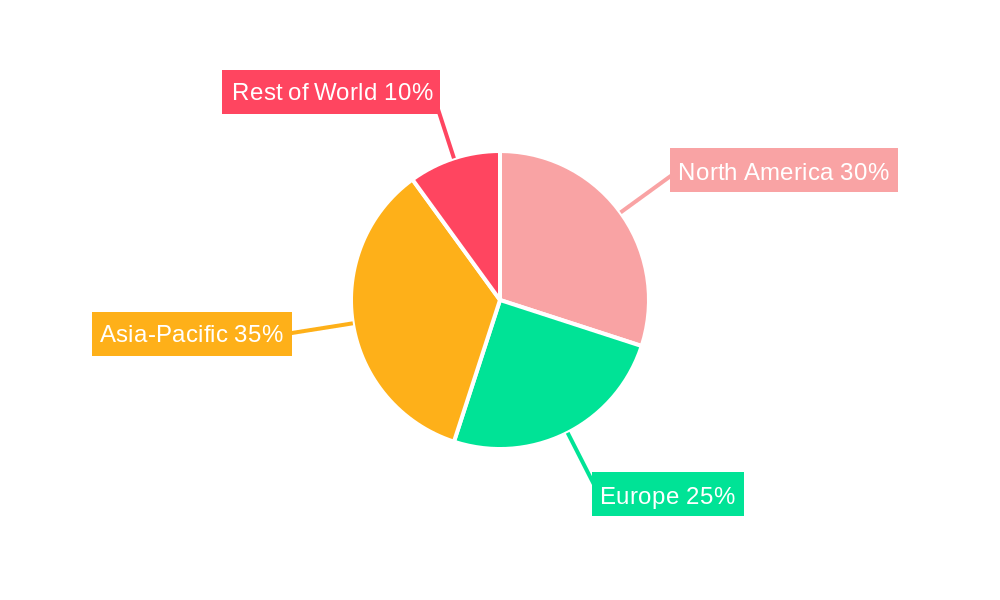
North America (specifically the US) and Asia-Pacific (particularly China, South Korea, and Japan) are currently the leading regions in 5G and 5.5G deployments and service adoption.
- North America: High levels of investment in infrastructure, a robust technological ecosystem, and strong consumer demand are key drivers. The large number of subscribers and high ARPU (Average Revenue Per User) contribute significantly to the market's growth.
- Asia-Pacific: Massive population bases, rapid technological advancement, and government initiatives supporting 5G/5.5G deployment contribute to high adoption rates in several countries. The region's diverse market presents opportunities for various services and applications.
- Europe: While slightly behind North America and Asia-Pacific, Europe is witnessing a steady increase in 5G/5.5G deployments and adoption, driven by investments in infrastructure, regulatory support, and increasing demand for high-speed connectivity.
The specific country-level analysis includes market share and future growth potential projections.
5G and 5.5G Services Product Landscape
This section details product innovations, applications, and performance metrics of 5G and 5.5G services. It highlights unique selling propositions and technological advancements, focusing on the differentiation between 5G and 5.5G offerings. The key differentiator is the significant boost in speed and capacity provided by 5.5G, enabling new applications and use cases not feasible with traditional 5G. This includes enhancements in network slicing for improved service quality and enhanced support for diverse IoT applications. The improved performance metrics translate to lower latency, higher bandwidth, and enhanced network reliability.
Key Drivers, Barriers & Challenges in 5G and 5.5G Services
This section examines the key forces driving market growth and the major challenges hindering its expansion.
Key Drivers:
- Increased demand for higher data speeds and lower latency: Driven by the proliferation of data-intensive applications like streaming video and online gaming.
- Technological advancements: Innovations in antenna technology, network slicing, and edge computing improve network capacity and efficiency.
- Government support and investments: Many governments globally are providing funding and incentives to promote 5G/5.5G deployment.
Key Barriers and Challenges:
- High infrastructure costs: Deploying 5G/5.5G networks requires significant capital investment in new infrastructure.
- Spectrum allocation and regulatory hurdles: The availability of suitable radio frequencies and the regulatory frameworks surrounding their use pose challenges.
- Security concerns: The increased connectivity and data usage associated with 5G/5.5G raise concerns about network security and data privacy. The estimated cost of addressing these challenges is projected at xx million USD annually.
Emerging Opportunities in 5G and 5.5G Services
This section highlights untapped markets, innovative applications, and evolving consumer preferences.
- Private 5G networks: Businesses are increasingly adopting private 5G networks for enhanced security and control over their connectivity.
- Industrial IoT (IIoT): 5G/5.5G's low latency and high reliability are transforming industrial automation and manufacturing processes.
- Smart cities and connected vehicles: 5G/5.5G plays a critical role in the development of smart city infrastructure and connected vehicle technology.
Growth Accelerators in the 5G and 5.5G Services Industry
This section discusses long-term growth catalysts, emphasizing technological breakthroughs, strategic partnerships, and market expansion strategies. Continued technological advancements, particularly in areas such as AI-driven network management and the expansion of 5.5G capabilities, will be key growth drivers. Strategic partnerships between telecom operators and technology providers will streamline deployment and accelerate adoption. Expansion into untapped markets, particularly in developing countries, presents significant opportunities for market growth.
Notable Milestones in 5G and 5.5G Services Sector
- 2019: First commercial 5G networks launched in several countries.
- 2020: Increased investment in 5G infrastructure globally despite the pandemic.
- 2021: Significant advancements in 5G technology, including increased speeds and capacity.
- 2022: First deployments of 5.5G technology announced.
- 2023: Growing adoption of private 5G networks in various industries.
- 2024: Continued expansion of 5G/5.5G coverage and service offerings.
- 2025 (Ongoing): Ongoing developments in 5.5G technology and standards, driving continuous market expansion.
In-Depth 5G and 5.5G Services Market Outlook
The 5G and 5.5G services market is poised for continued robust growth throughout the forecast period, driven by technological advancements, increasing demand for high-speed connectivity, and expansion into new applications and markets. Strategic partnerships, investments in infrastructure, and supportive regulatory environments will further accelerate market expansion. The transition to 5.5G will unlock significant new opportunities, enabling a wider range of innovative applications and services that will reshape various industries. The long-term outlook remains exceptionally positive, with significant potential for continued growth and market expansion.
5G and 5.5G Services Segmentation
-
1. Type
- 1.1. 5G Services
- 1.2. 5.5G Services
-
2. Application
- 2.1. Telecom
- 2.2. Media & Entertainment
- 2.3. Manufacturing
- 2.4. Transportation
- 2.5. Public Services
- 2.6. Other
5G and 5.5G Services Segmentation By Geography
-
1. North America
- 1.1. United States
- 1.2. Canada
- 1.3. Mexico
-
2. South America
- 2.1. Brazil
- 2.2. Argentina
- 2.3. Rest of South America
-
3. Europe
- 3.1. United Kingdom
- 3.2. Germany
- 3.3. France
- 3.4. Italy
- 3.5. Spain
- 3.6. Russia
- 3.7. Benelux
- 3.8. Nordics
- 3.9. Rest of Europe
-
4. Middle East & Africa
- 4.1. Turkey
- 4.2. Israel
- 4.3. GCC
- 4.4. North Africa
- 4.5. South Africa
- 4.6. Rest of Middle East & Africa
-
5. Asia Pacific
- 5.1. China
- 5.2. India
- 5.3. Japan
- 5.4. South Korea
- 5.5. ASEAN
- 5.6. Oceania
- 5.7. Rest of Asia Pacific
5G and 5.5G Services Regional Market Share
Geographic Coverage of 5G and 5.5G Services
5G and 5.5G Services REPORT HIGHLIGHTS
| Aspects | Details |
|---|---|
| Study Period | 2020-2034 |
| Base Year | 2025 |
| Estimated Year | 2026 |
| Forecast Period | 2026-2034 |
| Historical Period | 2020-2025 |
| Growth Rate | CAGR of 42.59% from 2020-2034 |
| Segmentation |
|
Table of Contents
- 1. Introduction
- 1.1. Research Scope
- 1.2. Market Segmentation
- 1.3. Research Objective
- 1.4. Definitions and Assumptions
- 2. Executive Summary
- 2.1. Market Snapshot
- 3. Market Dynamics
- 3.1. Market Drivers
- 3.2. Market Restrains
- 3.3. Market Trends
- 3.4. Market Opportunities
- 4. Market Factor Analysis
- 4.1. Porters Five Forces
- 4.1.1. Bargaining Power of Suppliers
- 4.1.2. Bargaining Power of Buyers
- 4.1.3. Threat of New Entrants
- 4.1.4. Threat of Substitutes
- 4.1.5. Competitive Rivalry
- 4.2. PESTEL analysis
- 4.3. BCG Analysis
- 4.3.1. Stars (High Growth, High Market Share)
- 4.3.2. Cash Cows (Low Growth, High Market Share)
- 4.3.3. Question Mark (High Growth, Low Market Share)
- 4.3.4. Dogs (Low Growth, Low Market Share)
- 4.4. Ansoff Matrix Analysis
- 4.5. Supply Chain Analysis
- 4.6. Regulatory Landscape
- 4.7. Current Market Potential and Opportunity Assessment (TAM–SAM–SOM Framework)
- 4.8. IMR Analyst Note
- 4.1. Porters Five Forces
- 5. Market Analysis, Insights and Forecast 2021-2033
- 5.1. Market Analysis, Insights and Forecast - by Type
- 5.1.1. 5G Services
- 5.1.2. 5.5G Services
- 5.2. Market Analysis, Insights and Forecast - by Application
- 5.2.1. Telecom
- 5.2.2. Media & Entertainment
- 5.2.3. Manufacturing
- 5.2.4. Transportation
- 5.2.5. Public Services
- 5.2.6. Other
- 5.3. Market Analysis, Insights and Forecast - by Region
- 5.3.1. North America
- 5.3.2. South America
- 5.3.3. Europe
- 5.3.4. Middle East & Africa
- 5.3.5. Asia Pacific
- 5.1. Market Analysis, Insights and Forecast - by Type
- 6. Global 5G and 5.5G Services Analysis, Insights and Forecast, 2021-2033
- 6.1. Market Analysis, Insights and Forecast - by Type
- 6.1.1. 5G Services
- 6.1.2. 5.5G Services
- 6.2. Market Analysis, Insights and Forecast - by Application
- 6.2.1. Telecom
- 6.2.2. Media & Entertainment
- 6.2.3. Manufacturing
- 6.2.4. Transportation
- 6.2.5. Public Services
- 6.2.6. Other
- 6.1. Market Analysis, Insights and Forecast - by Type
- 7. North America 5G and 5.5G Services Analysis, Insights and Forecast, 2020-2032
- 7.1. Market Analysis, Insights and Forecast - by Type
- 7.1.1. 5G Services
- 7.1.2. 5.5G Services
- 7.2. Market Analysis, Insights and Forecast - by Application
- 7.2.1. Telecom
- 7.2.2. Media & Entertainment
- 7.2.3. Manufacturing
- 7.2.4. Transportation
- 7.2.5. Public Services
- 7.2.6. Other
- 7.1. Market Analysis, Insights and Forecast - by Type
- 8. South America 5G and 5.5G Services Analysis, Insights and Forecast, 2020-2032
- 8.1. Market Analysis, Insights and Forecast - by Type
- 8.1.1. 5G Services
- 8.1.2. 5.5G Services
- 8.2. Market Analysis, Insights and Forecast - by Application
- 8.2.1. Telecom
- 8.2.2. Media & Entertainment
- 8.2.3. Manufacturing
- 8.2.4. Transportation
- 8.2.5. Public Services
- 8.2.6. Other
- 8.1. Market Analysis, Insights and Forecast - by Type
- 9. Europe 5G and 5.5G Services Analysis, Insights and Forecast, 2020-2032
- 9.1. Market Analysis, Insights and Forecast - by Type
- 9.1.1. 5G Services
- 9.1.2. 5.5G Services
- 9.2. Market Analysis, Insights and Forecast - by Application
- 9.2.1. Telecom
- 9.2.2. Media & Entertainment
- 9.2.3. Manufacturing
- 9.2.4. Transportation
- 9.2.5. Public Services
- 9.2.6. Other
- 9.1. Market Analysis, Insights and Forecast - by Type
- 10. Middle East & Africa 5G and 5.5G Services Analysis, Insights and Forecast, 2020-2032
- 10.1. Market Analysis, Insights and Forecast - by Type
- 10.1.1. 5G Services
- 10.1.2. 5.5G Services
- 10.2. Market Analysis, Insights and Forecast - by Application
- 10.2.1. Telecom
- 10.2.2. Media & Entertainment
- 10.2.3. Manufacturing
- 10.2.4. Transportation
- 10.2.5. Public Services
- 10.2.6. Other
- 10.1. Market Analysis, Insights and Forecast - by Type
- 11. Asia Pacific 5G and 5.5G Services Analysis, Insights and Forecast, 2020-2032
- 11.1. Market Analysis, Insights and Forecast - by Type
- 11.1.1. 5G Services
- 11.1.2. 5.5G Services
- 11.2. Market Analysis, Insights and Forecast - by Application
- 11.2.1. Telecom
- 11.2.2. Media & Entertainment
- 11.2.3. Manufacturing
- 11.2.4. Transportation
- 11.2.5. Public Services
- 11.2.6. Other
- 11.1. Market Analysis, Insights and Forecast - by Type
- 12. Competitive Analysis
- 12.1. Company Profiles
- 12.1.1 Huawei
- 12.1.1.1. Company Overview
- 12.1.1.2. Products
- 12.1.1.3. Company Financials
- 12.1.1.4. SWOT Analysis
- 12.1.2 Ericsson
- 12.1.2.1. Company Overview
- 12.1.2.2. Products
- 12.1.2.3. Company Financials
- 12.1.2.4. SWOT Analysis
- 12.1.3 Nokia
- 12.1.3.1. Company Overview
- 12.1.3.2. Products
- 12.1.3.3. Company Financials
- 12.1.3.4. SWOT Analysis
- 12.1.4 Samsung
- 12.1.4.1. Company Overview
- 12.1.4.2. Products
- 12.1.4.3. Company Financials
- 12.1.4.4. SWOT Analysis
- 12.1.5 ZTE
- 12.1.5.1. Company Overview
- 12.1.5.2. Products
- 12.1.5.3. Company Financials
- 12.1.5.4. SWOT Analysis
- 12.1.6 China Mobile
- 12.1.6.1. Company Overview
- 12.1.6.2. Products
- 12.1.6.3. Company Financials
- 12.1.6.4. SWOT Analysis
- 12.1.7 China Telecom
- 12.1.7.1. Company Overview
- 12.1.7.2. Products
- 12.1.7.3. Company Financials
- 12.1.7.4. SWOT Analysis
- 12.1.8 China Unicom
- 12.1.8.1. Company Overview
- 12.1.8.2. Products
- 12.1.8.3. Company Financials
- 12.1.8.4. SWOT Analysis
- 12.1.9 Verizon
- 12.1.9.1. Company Overview
- 12.1.9.2. Products
- 12.1.9.3. Company Financials
- 12.1.9.4. SWOT Analysis
- 12.1.10 AT&T
- 12.1.10.1. Company Overview
- 12.1.10.2. Products
- 12.1.10.3. Company Financials
- 12.1.10.4. SWOT Analysis
- 12.1.11 Deutsche Telekom AG
- 12.1.11.1. Company Overview
- 12.1.11.2. Products
- 12.1.11.3. Company Financials
- 12.1.11.4. SWOT Analysis
- 12.1.12 Vodafone Group
- 12.1.12.1. Company Overview
- 12.1.12.2. Products
- 12.1.12.3. Company Financials
- 12.1.12.4. SWOT Analysis
- 12.1.13 SK Telecom
- 12.1.13.1. Company Overview
- 12.1.13.2. Products
- 12.1.13.3. Company Financials
- 12.1.13.4. SWOT Analysis
- 12.1.14 NTT
- 12.1.14.1. Company Overview
- 12.1.14.2. Products
- 12.1.14.3. Company Financials
- 12.1.14.4. SWOT Analysis
- 12.1.15 KT Corporation
- 12.1.15.1. Company Overview
- 12.1.15.2. Products
- 12.1.15.3. Company Financials
- 12.1.15.4. SWOT Analysis
- 12.1.16 NEC
- 12.1.16.1. Company Overview
- 12.1.16.2. Products
- 12.1.16.3. Company Financials
- 12.1.16.4. SWOT Analysis
- 12.1.17 Fujitsu
- 12.1.17.1. Company Overview
- 12.1.17.2. Products
- 12.1.17.3. Company Financials
- 12.1.17.4. SWOT Analysis
- 12.1.18 T-Mobile
- 12.1.18.1. Company Overview
- 12.1.18.2. Products
- 12.1.18.3. Company Financials
- 12.1.18.4. SWOT Analysis
- 12.1.1 Huawei
- 12.2. Market Entropy
- 12.2.1 Company's Key Areas Served
- 12.2.2 Recent Developments
- 12.3. Company Market Share Analysis 2025
- 12.3.1 Top 5 Companies Market Share Analysis
- 12.3.2 Top 3 Companies Market Share Analysis
- 12.4. List of Potential Customers
- 13. Research Methodology
List of Figures
- Figure 1: Global 5G and 5.5G Services Revenue Breakdown (undefined, %) by Region 2025 & 2033
- Figure 2: North America 5G and 5.5G Services Revenue (undefined), by Type 2025 & 2033
- Figure 3: North America 5G and 5.5G Services Revenue Share (%), by Type 2025 & 2033
- Figure 4: North America 5G and 5.5G Services Revenue (undefined), by Application 2025 & 2033
- Figure 5: North America 5G and 5.5G Services Revenue Share (%), by Application 2025 & 2033
- Figure 6: North America 5G and 5.5G Services Revenue (undefined), by Country 2025 & 2033
- Figure 7: North America 5G and 5.5G Services Revenue Share (%), by Country 2025 & 2033
- Figure 8: South America 5G and 5.5G Services Revenue (undefined), by Type 2025 & 2033
- Figure 9: South America 5G and 5.5G Services Revenue Share (%), by Type 2025 & 2033
- Figure 10: South America 5G and 5.5G Services Revenue (undefined), by Application 2025 & 2033
- Figure 11: South America 5G and 5.5G Services Revenue Share (%), by Application 2025 & 2033
- Figure 12: South America 5G and 5.5G Services Revenue (undefined), by Country 2025 & 2033
- Figure 13: South America 5G and 5.5G Services Revenue Share (%), by Country 2025 & 2033
- Figure 14: Europe 5G and 5.5G Services Revenue (undefined), by Type 2025 & 2033
- Figure 15: Europe 5G and 5.5G Services Revenue Share (%), by Type 2025 & 2033
- Figure 16: Europe 5G and 5.5G Services Revenue (undefined), by Application 2025 & 2033
- Figure 17: Europe 5G and 5.5G Services Revenue Share (%), by Application 2025 & 2033
- Figure 18: Europe 5G and 5.5G Services Revenue (undefined), by Country 2025 & 2033
- Figure 19: Europe 5G and 5.5G Services Revenue Share (%), by Country 2025 & 2033
- Figure 20: Middle East & Africa 5G and 5.5G Services Revenue (undefined), by Type 2025 & 2033
- Figure 21: Middle East & Africa 5G and 5.5G Services Revenue Share (%), by Type 2025 & 2033
- Figure 22: Middle East & Africa 5G and 5.5G Services Revenue (undefined), by Application 2025 & 2033
- Figure 23: Middle East & Africa 5G and 5.5G Services Revenue Share (%), by Application 2025 & 2033
- Figure 24: Middle East & Africa 5G and 5.5G Services Revenue (undefined), by Country 2025 & 2033
- Figure 25: Middle East & Africa 5G and 5.5G Services Revenue Share (%), by Country 2025 & 2033
- Figure 26: Asia Pacific 5G and 5.5G Services Revenue (undefined), by Type 2025 & 2033
- Figure 27: Asia Pacific 5G and 5.5G Services Revenue Share (%), by Type 2025 & 2033
- Figure 28: Asia Pacific 5G and 5.5G Services Revenue (undefined), by Application 2025 & 2033
- Figure 29: Asia Pacific 5G and 5.5G Services Revenue Share (%), by Application 2025 & 2033
- Figure 30: Asia Pacific 5G and 5.5G Services Revenue (undefined), by Country 2025 & 2033
- Figure 31: Asia Pacific 5G and 5.5G Services Revenue Share (%), by Country 2025 & 2033
List of Tables
- Table 1: Global 5G and 5.5G Services Revenue undefined Forecast, by Type 2020 & 2033
- Table 2: Global 5G and 5.5G Services Revenue undefined Forecast, by Application 2020 & 2033
- Table 3: Global 5G and 5.5G Services Revenue undefined Forecast, by Region 2020 & 2033
- Table 4: Global 5G and 5.5G Services Revenue undefined Forecast, by Type 2020 & 2033
- Table 5: Global 5G and 5.5G Services Revenue undefined Forecast, by Application 2020 & 2033
- Table 6: Global 5G and 5.5G Services Revenue undefined Forecast, by Country 2020 & 2033
- Table 7: United States 5G and 5.5G Services Revenue (undefined) Forecast, by Application 2020 & 2033
- Table 8: Canada 5G and 5.5G Services Revenue (undefined) Forecast, by Application 2020 & 2033
- Table 9: Mexico 5G and 5.5G Services Revenue (undefined) Forecast, by Application 2020 & 2033
- Table 10: Global 5G and 5.5G Services Revenue undefined Forecast, by Type 2020 & 2033
- Table 11: Global 5G and 5.5G Services Revenue undefined Forecast, by Application 2020 & 2033
- Table 12: Global 5G and 5.5G Services Revenue undefined Forecast, by Country 2020 & 2033
- Table 13: Brazil 5G and 5.5G Services Revenue (undefined) Forecast, by Application 2020 & 2033
- Table 14: Argentina 5G and 5.5G Services Revenue (undefined) Forecast, by Application 2020 & 2033
- Table 15: Rest of South America 5G and 5.5G Services Revenue (undefined) Forecast, by Application 2020 & 2033
- Table 16: Global 5G and 5.5G Services Revenue undefined Forecast, by Type 2020 & 2033
- Table 17: Global 5G and 5.5G Services Revenue undefined Forecast, by Application 2020 & 2033
- Table 18: Global 5G and 5.5G Services Revenue undefined Forecast, by Country 2020 & 2033
- Table 19: United Kingdom 5G and 5.5G Services Revenue (undefined) Forecast, by Application 2020 & 2033
- Table 20: Germany 5G and 5.5G Services Revenue (undefined) Forecast, by Application 2020 & 2033
- Table 21: France 5G and 5.5G Services Revenue (undefined) Forecast, by Application 2020 & 2033
- Table 22: Italy 5G and 5.5G Services Revenue (undefined) Forecast, by Application 2020 & 2033
- Table 23: Spain 5G and 5.5G Services Revenue (undefined) Forecast, by Application 2020 & 2033
- Table 24: Russia 5G and 5.5G Services Revenue (undefined) Forecast, by Application 2020 & 2033
- Table 25: Benelux 5G and 5.5G Services Revenue (undefined) Forecast, by Application 2020 & 2033
- Table 26: Nordics 5G and 5.5G Services Revenue (undefined) Forecast, by Application 2020 & 2033
- Table 27: Rest of Europe 5G and 5.5G Services Revenue (undefined) Forecast, by Application 2020 & 2033
- Table 28: Global 5G and 5.5G Services Revenue undefined Forecast, by Type 2020 & 2033
- Table 29: Global 5G and 5.5G Services Revenue undefined Forecast, by Application 2020 & 2033
- Table 30: Global 5G and 5.5G Services Revenue undefined Forecast, by Country 2020 & 2033
- Table 31: Turkey 5G and 5.5G Services Revenue (undefined) Forecast, by Application 2020 & 2033
- Table 32: Israel 5G and 5.5G Services Revenue (undefined) Forecast, by Application 2020 & 2033
- Table 33: GCC 5G and 5.5G Services Revenue (undefined) Forecast, by Application 2020 & 2033
- Table 34: North Africa 5G and 5.5G Services Revenue (undefined) Forecast, by Application 2020 & 2033
- Table 35: South Africa 5G and 5.5G Services Revenue (undefined) Forecast, by Application 2020 & 2033
- Table 36: Rest of Middle East & Africa 5G and 5.5G Services Revenue (undefined) Forecast, by Application 2020 & 2033
- Table 37: Global 5G and 5.5G Services Revenue undefined Forecast, by Type 2020 & 2033
- Table 38: Global 5G and 5.5G Services Revenue undefined Forecast, by Application 2020 & 2033
- Table 39: Global 5G and 5.5G Services Revenue undefined Forecast, by Country 2020 & 2033
- Table 40: China 5G and 5.5G Services Revenue (undefined) Forecast, by Application 2020 & 2033
- Table 41: India 5G and 5.5G Services Revenue (undefined) Forecast, by Application 2020 & 2033
- Table 42: Japan 5G and 5.5G Services Revenue (undefined) Forecast, by Application 2020 & 2033
- Table 43: South Korea 5G and 5.5G Services Revenue (undefined) Forecast, by Application 2020 & 2033
- Table 44: ASEAN 5G and 5.5G Services Revenue (undefined) Forecast, by Application 2020 & 2033
- Table 45: Oceania 5G and 5.5G Services Revenue (undefined) Forecast, by Application 2020 & 2033
- Table 46: Rest of Asia Pacific 5G and 5.5G Services Revenue (undefined) Forecast, by Application 2020 & 2033
Frequently Asked Questions
1. What is the projected Compound Annual Growth Rate (CAGR) of the 5G and 5.5G Services?
The projected CAGR is approximately 42.59%.
2. Which companies are prominent players in the 5G and 5.5G Services?
Key companies in the market include Huawei, Ericsson, Nokia, Samsung, ZTE, China Mobile, China Telecom, China Unicom, Verizon, AT&T, Deutsche Telekom AG, Vodafone Group, SK Telecom, NTT, KT Corporation, NEC, Fujitsu, T-Mobile.
3. What are the main segments of the 5G and 5.5G Services?
The market segments include Type, Application.
4. Can you provide details about the market size?
The market size is estimated to be USD XXX N/A as of 2022.
5. What are some drivers contributing to market growth?
N/A
6. What are the notable trends driving market growth?
N/A
7. Are there any restraints impacting market growth?
N/A
8. Can you provide examples of recent developments in the market?
N/A
9. What pricing options are available for accessing the report?
Pricing options include single-user, multi-user, and enterprise licenses priced at USD 4350.00, USD 6525.00, and USD 8700.00 respectively.
10. Is the market size provided in terms of value or volume?
The market size is provided in terms of value, measured in N/A.
11. Are there any specific market keywords associated with the report?
Yes, the market keyword associated with the report is "5G and 5.5G Services," which aids in identifying and referencing the specific market segment covered.
12. How do I determine which pricing option suits my needs best?
The pricing options vary based on user requirements and access needs. Individual users may opt for single-user licenses, while businesses requiring broader access may choose multi-user or enterprise licenses for cost-effective access to the report.
13. Are there any additional resources or data provided in the 5G and 5.5G Services report?
While the report offers comprehensive insights, it's advisable to review the specific contents or supplementary materials provided to ascertain if additional resources or data are available.
14. How can I stay updated on further developments or reports in the 5G and 5.5G Services?
To stay informed about further developments, trends, and reports in the 5G and 5.5G Services, consider subscribing to industry newsletters, following relevant companies and organizations, or regularly checking reputable industry news sources and publications.
Methodology
Step 1 - Identification of Relevant Samples Size from Population Database


Step 2 - Approaches for Defining Global Market Size (Value, Volume* & Price*)

Note*: In applicable scenarios
Step 3 - Data Sources
Primary Research
- Web Analytics
- Survey Reports
- Research Institute
- Latest Research Reports
- Opinion Leaders
Secondary Research
- Annual Reports
- White Paper
- Latest Press Release
- Industry Association
- Paid Database
- Investor Presentations

Step 4 - Data Triangulation
Involves using different sources of information in order to increase the validity of a study
These sources are likely to be stakeholders in a program - participants, other researchers, program staff, other community members, and so on.
Then we put all data in single framework & apply various statistical tools to find out the dynamic on the market.
During the analysis stage, feedback from the stakeholder groups would be compared to determine areas of agreement as well as areas of divergence