

Key Insights
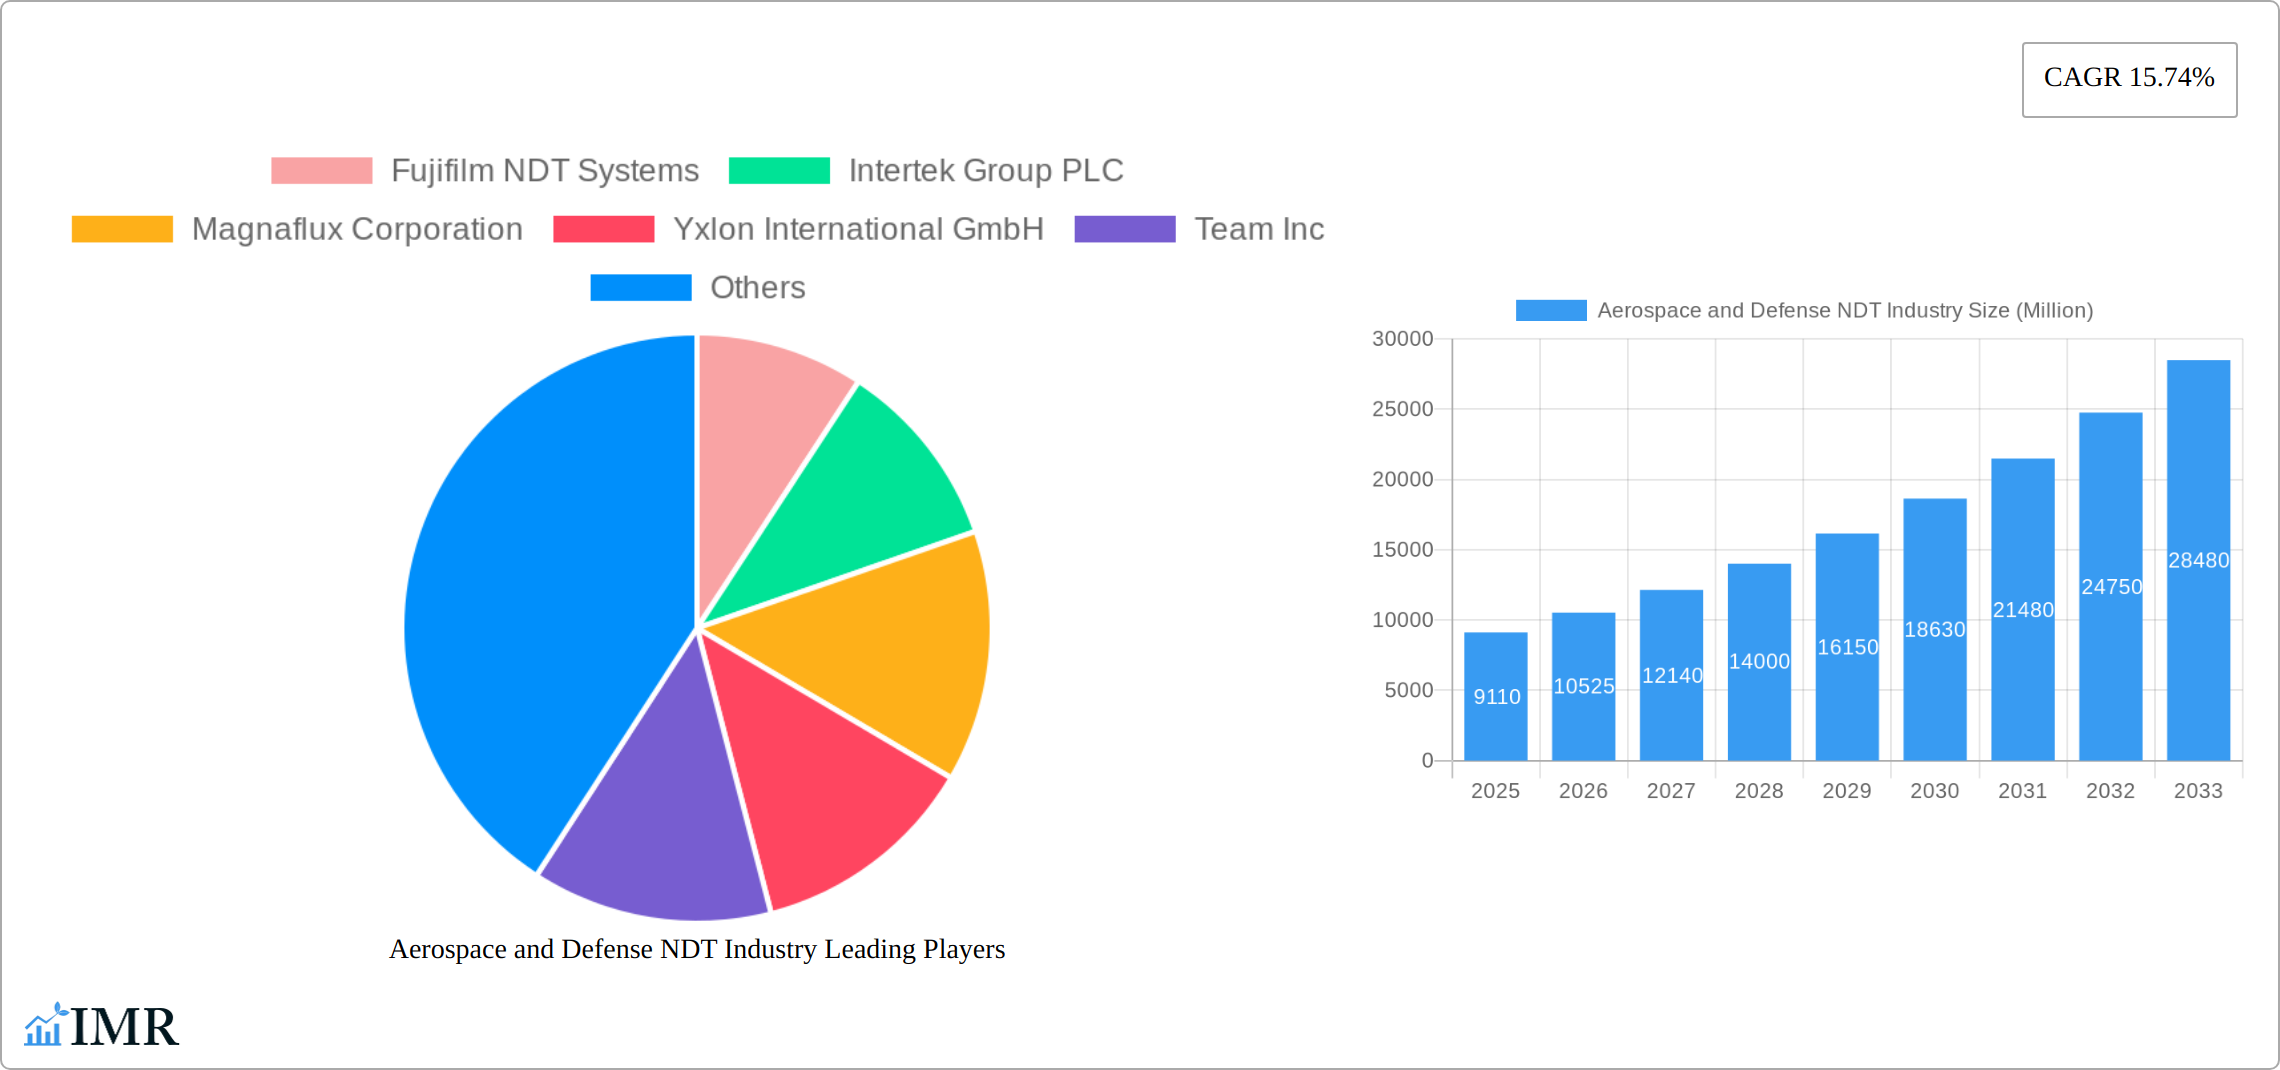
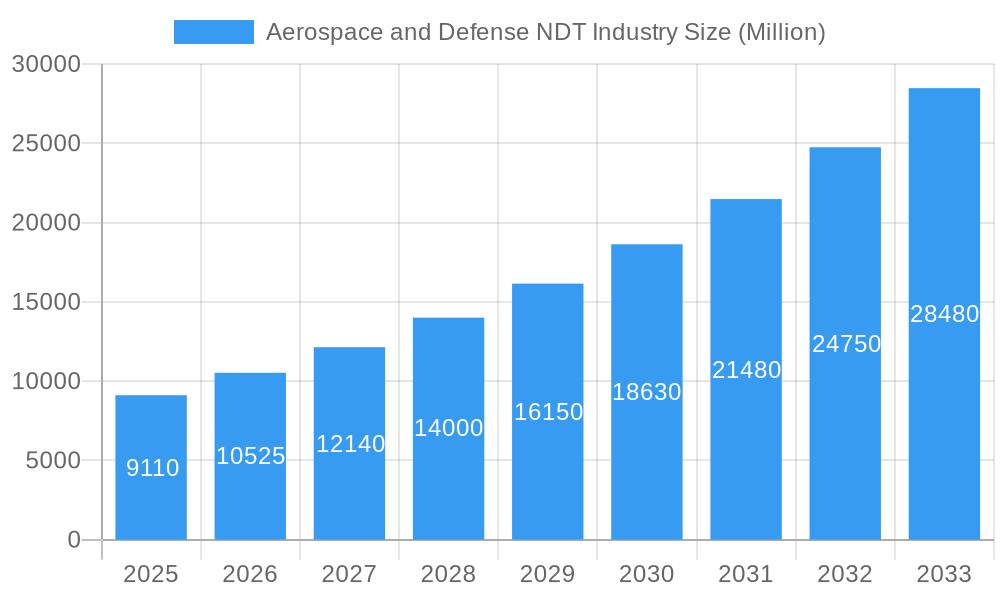
The Aerospace and Defense Non-Destructive Testing (NDT) market is experiencing robust growth, driven by increasing demand for air travel, defense modernization initiatives, and stringent safety regulations. The market, valued at $9.11 billion in 2025, is projected to exhibit a Compound Annual Growth Rate (CAGR) of 15.74% from 2025 to 2033. This expansion is fueled by several key factors. Firstly, the rising adoption of advanced NDT technologies, such as radiography testing and ultrasonic testing, enables more precise and efficient inspection of aircraft components and defense systems, leading to improved safety and reduced maintenance costs. Secondly, the increasing complexity of aerospace and defense equipment necessitates more sophisticated NDT methods to detect potential flaws early in the manufacturing process or during in-service inspections. Finally, stringent regulatory compliance mandates within the aerospace and defense industries necessitate thorough and documented NDT procedures, further boosting market demand. Growth is expected across all segments, with services likely dominating due to the increasing outsourcing of NDT activities by aerospace and defense companies. Technological advancements, particularly in automated and AI-powered NDT systems, will continue to shape market dynamics.
Aerospace and Defense NDT Industry Market Size (In Billion)
However, certain restraints exist. High initial investment costs associated with advanced NDT equipment can pose a barrier to entry for smaller companies. Furthermore, the need for skilled NDT personnel and the complexity of interpreting test results can limit market penetration in some regions. Despite these challenges, the long-term outlook for the Aerospace and Defense NDT market remains positive, fueled by continuous technological advancements and the unwavering emphasis on safety and quality within the aerospace and defense sectors. The market is expected to see significant growth in regions like Asia, driven by increasing investments in aerospace and defense infrastructure in developing economies. North America and Europe, with established aerospace and defense industries, will continue to hold significant market share, though the growth rate might be slightly lower than in emerging markets.
Aerospace and Defense NDT Industry Company Market Share
Aerospace and Defense NDT Industry Market Report: 2019-2033
This comprehensive report provides a detailed analysis of the Aerospace and Defense Non-Destructive Testing (NDT) industry, encompassing market dynamics, growth trends, competitive landscape, and future outlook. The study period covers 2019-2033, with a base year of 2025 and a forecast period of 2025-2033. The report delves into key segments – by type (Service, Equipment) and by technology (Radiography Testing, Ultrasonic Testing, Magnetic Particle Testing & Electromagnetic Testing, Liquid Penetrant Testing, Visual Inspection, Eddy Current) – providing valuable insights for industry professionals, investors, and strategic decision-makers. The global market value is estimated at xx Million in 2025.
Aerospace and Defense NDT Industry Market Dynamics & Structure
The Aerospace and Defense NDT market is characterized by a moderately concentrated landscape, with key players like Fujifilm NDT Systems, Intertek Group PLC, and Magnaflux Corporation holding significant market share. Technological innovation, driven by the need for enhanced inspection accuracy and efficiency, is a major growth driver. Stringent regulatory frameworks governing aircraft and defense system safety impose quality control standards, fueling demand for NDT solutions. Competitive substitutes exist, primarily in the form of alternative inspection techniques, but NDT maintains its dominance due to its reliability and versatility. The end-user demographic primarily comprises aerospace manufacturers, defense contractors, and maintenance, repair, and overhaul (MRO) service providers. M&A activity within the industry has been moderate in recent years, with xx deals recorded between 2019 and 2024, primarily focused on consolidating technological expertise and expanding service capabilities.
- Market Concentration: Moderately concentrated, with top 5 players holding approximately xx% market share in 2025.
- Technological Innovation: Focus on automation, AI integration, and advanced data analytics for improved inspection speed and accuracy.
- Regulatory Framework: Stringent safety standards drive adoption of NDT, particularly in aerospace and defense sectors.
- Competitive Substitutes: Limited, with NDT offering superior reliability and versatility compared to alternatives.
- M&A Activity: xx deals between 2019-2024, driven by technological integration and market expansion strategies.
- Innovation Barriers: High initial investment costs for advanced NDT equipment and skilled labor shortage.
Aerospace and Defense NDT Industry Growth Trends & Insights
The Aerospace and Defense Non-Destructive Testing (NDT) market is poised for significant expansion, driven by the burgeoning demand for air travel, sustained investment in defense modernization, and the unwavering enforcement of stringent safety and reliability regulations. Projections indicate the market could reach [Insert Estimated Market Size in Million] by 2033, with a projected Compound Annual Growth Rate (CAGR) of [Insert Projected CAGR]%. This robust growth is underpinned by the escalating adoption of cutting-edge NDT technologies, particularly in the realm of automated inspection systems and sophisticated data analytics. Technological advancements, notably the seamless integration of Artificial Intelligence (AI) and Machine Learning (ML) into NDT workflows, are revolutionizing inspection efficiency and precision. Furthermore, a heightened consumer emphasis on safety and dependability in both commercial aviation and defense platforms acts as a powerful catalyst for market expansion. The relatively nascent market penetration of advanced NDT solutions presents substantial untapped opportunities for future development and widespread implementation.
Dominant Regions, Countries, or Segments in Aerospace and Defense NDT Industry
North America and Europe currently dominate the Aerospace and Defense NDT market, driven by a strong presence of major aerospace and defense manufacturers and established NDT service providers. Within the segment breakdown, the Equipment segment holds a larger market share than the Service segment, primarily due to the ongoing demand for advanced NDT equipment. Among technologies, Radiography Testing and Ultrasonic Testing account for a significant portion of the market, owing to their widespread applicability and reliability. However, other NDT methods, such as Eddy Current and Magnetic Particle Testing, are expected to see increased adoption during the forecast period, fueled by technological advancements.
- North America Dominance: Strong presence of aerospace and defense manufacturers and established NDT service providers.
- European Market: High demand driven by stringent regulations and significant defense spending.
- Asia-Pacific Growth Potential: Rapid growth driven by increased investments in aerospace and defense infrastructure.
- Equipment Segment Leadership: High demand for advanced NDT equipment across all technologies.
- Radiography & Ultrasonic Testing: Dominant technologies due to established reliability and applicability.
Aerospace and Defense NDT Industry Product Landscape
The product landscape within the Aerospace and Defense NDT sector is characterized by a relentless pursuit of innovation, encompassing both sophisticated equipment and comprehensive service offerings. The development of advanced NDT systems is prioritizing enhanced portability, superior resolution capabilities, and integrated data analytics to facilitate swifter and more accurate inspections. Product designs are increasingly specialized, catering to a diverse array of applications, from the meticulous inspection of intricate aircraft components and critical engine parts to the comprehensive integrity assessment of sophisticated defense systems. Key differentiators are emerging through features such as AI-driven defect identification, real-time data interpretation, and automated reporting functionalities. The overarching technological trajectory is focused on maximizing inspection speed, accuracy, and overall efficiency, while simultaneously driving down operational costs for end-users.
Key Drivers, Barriers & Challenges in Aerospace and Defense NDT Industry
Key Drivers:
- The ever-increasing global demand for air travel, coupled with aggressive defense modernization initiatives worldwide.
- Strict adherence to rigorous safety regulations and uncompromising quality control standards mandated across the industries.
- Continuous technological advancements that significantly enhance inspection efficiency, accuracy, and data interpretation.
- The growing strategic imperative for adopting advanced NDT methodologies, including AI integration and widespread automation.
Barriers & Challenges:
- The substantial initial capital investment required for state-of-the-art NDT equipment presents a significant hurdle.
- A persistent shortage of highly skilled NDT professionals, necessitating robust training and upskilling programs.
- Vulnerability to supply chain disruptions, which can impact the timely availability of essential components and raw materials.
- Intense market competition and the potential for price erosion in specific market segments, challenging profitability.
Emerging Opportunities in Aerospace and Defense NDT Industry
The Aerospace and Defense NDT market presents several emerging opportunities, particularly in the development and adoption of advanced technologies such as AI, ML, and robotics for enhanced inspection capabilities. Untapped markets exist in developing economies with expanding aerospace and defense sectors. Innovative applications, such as the use of NDT for additive manufacturing quality control, represent significant growth potential. Evolving consumer preferences toward enhanced safety and reliability in air travel and defense systems create ongoing demand for more advanced and effective NDT solutions.
Growth Accelerators in the Aerospace and Defense NDT Industry
The long-term trajectory of the Aerospace and Defense NDT industry is set to be significantly propelled by ongoing technological breakthroughs. These include the development of more compact and performant NDT equipment, alongside the deeper integration of advanced data analytics to empower more informed and strategic decision-making. Furthermore, fostering strategic collaborations between NDT equipment manufacturers and service providers will be instrumental in accelerating growth by expanding market reach and enhancing service delivery capabilities. The implementation of proactive market expansion strategies, such as identifying and targeting novel applications and emerging geographic regions, will be paramount in sustaining and driving robust long-term industry expansion.
Key Players Shaping the Aerospace and Defense NDT Industry Market
Notable Milestones in Aerospace and Defense NDT Industry Sector
- March 2024: Eddyfi Technologies unveiled TubePro 6, an advanced pre-inspection and reporting software solution designed to significantly enhance the efficiency and accuracy of heat exchanger inspections.
- February 2024: Rad Source NDT introduced the NDT 1000 X-ray Inspection System, a cutting-edge platform delivering high-resolution imaging capabilities for materials up to 0.5 inches thick, catering to critical inspection needs.
In-Depth Aerospace and Defense NDT Industry Market Outlook
The Aerospace and Defense NDT market is poised for continued robust growth, fueled by technological advancements, increasing demand for reliable inspection solutions, and stringent safety regulations. Strategic opportunities lie in developing innovative NDT technologies, expanding into new applications and geographic markets, and forging strategic partnerships. The market's future success hinges on addressing challenges such as skilled labor shortages and managing supply chain complexities. The long-term outlook remains positive, with significant growth potential in the coming decade.
Aerospace and Defense NDT Industry Segmentation
-
1. Type
- 1.1. Service
- 1.2. Equipment
-
2. Technology
- 2.1. Radiography Testing
- 2.2. Ultrasonic Testing
- 2.3. Magnetic
- 2.4. Liquid Penetrant Testing
- 2.5. Visual Inspection
- 2.6. Eddy Current
Aerospace and Defense NDT Industry Segmentation By Geography
- 1. North America
- 2. Europe
- 3. Asia
- 4. Australia and New Zealand
- 5. Latin America
- 6. Middle East and Africa
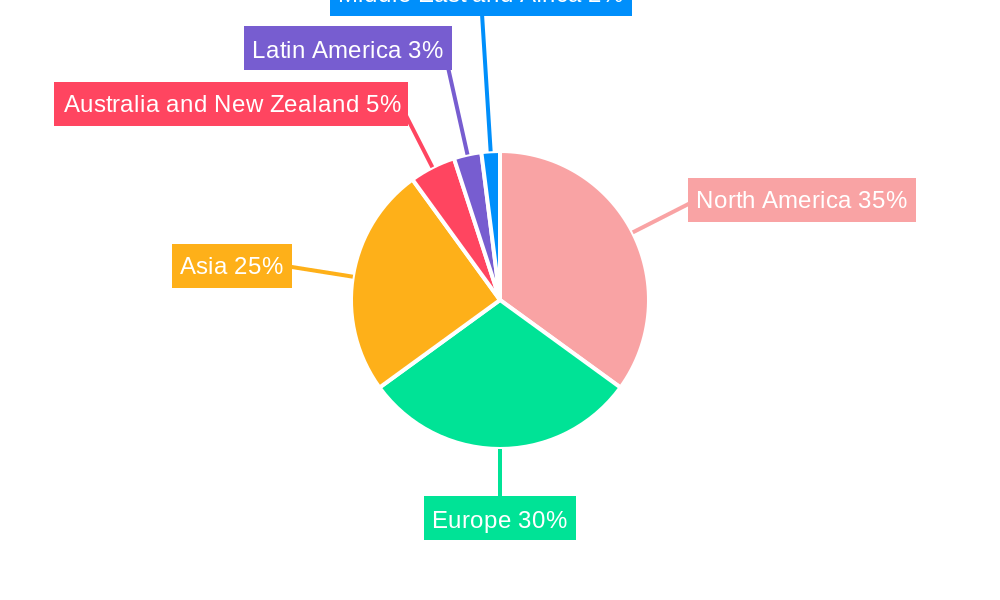
Aerospace and Defense NDT Industry Regional Market Share
Geographic Coverage of Aerospace and Defense NDT Industry
Aerospace and Defense NDT Industry REPORT HIGHLIGHTS
| Aspects | Details |
|---|---|
| Study Period | 2020-2034 |
| Base Year | 2025 |
| Estimated Year | 2026 |
| Forecast Period | 2026-2034 |
| Historical Period | 2020-2025 |
| Growth Rate | CAGR of 15.74% from 2020-2034 |
| Segmentation |
|
Table of Contents
- 1. Introduction
- 1.1. Research Scope
- 1.2. Market Segmentation
- 1.3. Research Objective
- 1.4. Definitions and Assumptions
- 2. Executive Summary
- 2.1. Market Snapshot
- 3. Market Dynamics
- 3.1. Market Drivers
- 3.2. Market Restrains
- 3.3. Market Trends
- 3.4. Market Opportunities
- 4. Market Factor Analysis
- 4.1. Porters Five Forces
- 4.1.1. Bargaining Power of Suppliers
- 4.1.2. Bargaining Power of Buyers
- 4.1.3. Threat of New Entrants
- 4.1.4. Threat of Substitutes
- 4.1.5. Competitive Rivalry
- 4.2. PESTEL analysis
- 4.3. BCG Analysis
- 4.3.1. Stars (High Growth, High Market Share)
- 4.3.2. Cash Cows (Low Growth, High Market Share)
- 4.3.3. Question Mark (High Growth, Low Market Share)
- 4.3.4. Dogs (Low Growth, Low Market Share)
- 4.4. Ansoff Matrix Analysis
- 4.5. Supply Chain Analysis
- 4.6. Regulatory Landscape
- 4.7. Current Market Potential and Opportunity Assessment (TAM–SAM–SOM Framework)
- 4.8. IMR Analyst Note
- 4.1. Porters Five Forces
- 5. Market Analysis, Insights and Forecast 2021-2033
- 5.1. Market Analysis, Insights and Forecast - by Type
- 5.1.1. Service
- 5.1.2. Equipment
- 5.2. Market Analysis, Insights and Forecast - by Technology
- 5.2.1. Radiography Testing
- 5.2.2. Ultrasonic Testing
- 5.2.3. Magnetic
- 5.2.4. Liquid Penetrant Testing
- 5.2.5. Visual Inspection
- 5.2.6. Eddy Current
- 5.3. Market Analysis, Insights and Forecast - by Region
- 5.3.1. North America
- 5.3.2. Europe
- 5.3.3. Asia
- 5.3.4. Australia and New Zealand
- 5.3.5. Latin America
- 5.3.6. Middle East and Africa
- 5.1. Market Analysis, Insights and Forecast - by Type
- 6. Global Aerospace and Defense NDT Industry Analysis, Insights and Forecast, 2021-2033
- 6.1. Market Analysis, Insights and Forecast - by Type
- 6.1.1. Service
- 6.1.2. Equipment
- 6.2. Market Analysis, Insights and Forecast - by Technology
- 6.2.1. Radiography Testing
- 6.2.2. Ultrasonic Testing
- 6.2.3. Magnetic
- 6.2.4. Liquid Penetrant Testing
- 6.2.5. Visual Inspection
- 6.2.6. Eddy Current
- 6.1. Market Analysis, Insights and Forecast - by Type
- 7. North America Aerospace and Defense NDT Industry Analysis, Insights and Forecast, 2020-2032
- 7.1. Market Analysis, Insights and Forecast - by Type
- 7.1.1. Service
- 7.1.2. Equipment
- 7.2. Market Analysis, Insights and Forecast - by Technology
- 7.2.1. Radiography Testing
- 7.2.2. Ultrasonic Testing
- 7.2.3. Magnetic
- 7.2.4. Liquid Penetrant Testing
- 7.2.5. Visual Inspection
- 7.2.6. Eddy Current
- 7.1. Market Analysis, Insights and Forecast - by Type
- 8. Europe Aerospace and Defense NDT Industry Analysis, Insights and Forecast, 2020-2032
- 8.1. Market Analysis, Insights and Forecast - by Type
- 8.1.1. Service
- 8.1.2. Equipment
- 8.2. Market Analysis, Insights and Forecast - by Technology
- 8.2.1. Radiography Testing
- 8.2.2. Ultrasonic Testing
- 8.2.3. Magnetic
- 8.2.4. Liquid Penetrant Testing
- 8.2.5. Visual Inspection
- 8.2.6. Eddy Current
- 8.1. Market Analysis, Insights and Forecast - by Type
- 9. Asia Aerospace and Defense NDT Industry Analysis, Insights and Forecast, 2020-2032
- 9.1. Market Analysis, Insights and Forecast - by Type
- 9.1.1. Service
- 9.1.2. Equipment
- 9.2. Market Analysis, Insights and Forecast - by Technology
- 9.2.1. Radiography Testing
- 9.2.2. Ultrasonic Testing
- 9.2.3. Magnetic
- 9.2.4. Liquid Penetrant Testing
- 9.2.5. Visual Inspection
- 9.2.6. Eddy Current
- 9.1. Market Analysis, Insights and Forecast - by Type
- 10. Australia and New Zealand Aerospace and Defense NDT Industry Analysis, Insights and Forecast, 2020-2032
- 10.1. Market Analysis, Insights and Forecast - by Type
- 10.1.1. Service
- 10.1.2. Equipment
- 10.2. Market Analysis, Insights and Forecast - by Technology
- 10.2.1. Radiography Testing
- 10.2.2. Ultrasonic Testing
- 10.2.3. Magnetic
- 10.2.4. Liquid Penetrant Testing
- 10.2.5. Visual Inspection
- 10.2.6. Eddy Current
- 10.1. Market Analysis, Insights and Forecast - by Type
- 11. Latin America Aerospace and Defense NDT Industry Analysis, Insights and Forecast, 2020-2032
- 11.1. Market Analysis, Insights and Forecast - by Type
- 11.1.1. Service
- 11.1.2. Equipment
- 11.2. Market Analysis, Insights and Forecast - by Technology
- 11.2.1. Radiography Testing
- 11.2.2. Ultrasonic Testing
- 11.2.3. Magnetic
- 11.2.4. Liquid Penetrant Testing
- 11.2.5. Visual Inspection
- 11.2.6. Eddy Current
- 11.1. Market Analysis, Insights and Forecast - by Type
- 12. Middle East and Africa Aerospace and Defense NDT Industry Analysis, Insights and Forecast, 2020-2032
- 12.1. Market Analysis, Insights and Forecast - by Type
- 12.1.1. Service
- 12.1.2. Equipment
- 12.2. Market Analysis, Insights and Forecast - by Technology
- 12.2.1. Radiography Testing
- 12.2.2. Ultrasonic Testing
- 12.2.3. Magnetic
- 12.2.4. Liquid Penetrant Testing
- 12.2.5. Visual Inspection
- 12.2.6. Eddy Current
- 12.1. Market Analysis, Insights and Forecast - by Type
- 13. Competitive Analysis
- 13.1. Company Profiles
- 13.1.1 Fujifilm NDT Systems
- 13.1.1.1. Company Overview
- 13.1.1.2. Products
- 13.1.1.3. Company Financials
- 13.1.1.4. SWOT Analysis
- 13.1.2 Intertek Group PLC
- 13.1.2.1. Company Overview
- 13.1.2.2. Products
- 13.1.2.3. Company Financials
- 13.1.2.4. SWOT Analysis
- 13.1.3 Magnaflux Corporation
- 13.1.3.1. Company Overview
- 13.1.3.2. Products
- 13.1.3.3. Company Financials
- 13.1.3.4. SWOT Analysis
- 13.1.4 Yxlon International GmbH
- 13.1.4.1. Company Overview
- 13.1.4.2. Products
- 13.1.4.3. Company Financials
- 13.1.4.4. SWOT Analysis
- 13.1.5 Team Inc
- 13.1.5.1. Company Overview
- 13.1.5.2. Products
- 13.1.5.3. Company Financials
- 13.1.5.4. SWOT Analysis
- 13.1.6 SGS Group
- 13.1.6.1. Company Overview
- 13.1.6.2. Products
- 13.1.6.3. Company Financials
- 13.1.6.4. SWOT Analysis
- 13.1.7 TUV Rheinland Ag
- 13.1.7.1. Company Overview
- 13.1.7.2. Products
- 13.1.7.3. Company Financials
- 13.1.7.4. SWOT Analysis
- 13.1.8 NikonMetrology Inc
- 13.1.8.1. Company Overview
- 13.1.8.2. Products
- 13.1.8.3. Company Financials
- 13.1.8.4. SWOT Analysis
- 13.1.9 Mistras Group
- 13.1.9.1. Company Overview
- 13.1.9.2. Products
- 13.1.9.3. Company Financials
- 13.1.9.4. SWOT Analysis
- 13.1.10 Olympus Corporation
- 13.1.10.1. Company Overview
- 13.1.10.2. Products
- 13.1.10.3. Company Financials
- 13.1.10.4. SWOT Analysis
- 13.1.11 GE Measurement and Control
- 13.1.11.1. Company Overview
- 13.1.11.2. Products
- 13.1.11.3. Company Financials
- 13.1.11.4. SWOT Analysis
- 13.1.12 Applus Services S A
- 13.1.12.1. Company Overview
- 13.1.12.2. Products
- 13.1.12.3. Company Financials
- 13.1.12.4. SWOT Analysis
- 13.1.13 FLIR Systems Inc *List Not Exhaustive
- 13.1.13.1. Company Overview
- 13.1.13.2. Products
- 13.1.13.3. Company Financials
- 13.1.13.4. SWOT Analysis
- 13.1.14 Gould-Bass Co
- 13.1.14.1. Company Overview
- 13.1.14.2. Products
- 13.1.14.3. Company Financials
- 13.1.14.4. SWOT Analysis
- 13.1.1 Fujifilm NDT Systems
- 13.2. Market Entropy
- 13.2.1 Company's Key Areas Served
- 13.2.2 Recent Developments
- 13.3. Company Market Share Analysis 2025
- 13.3.1 Top 5 Companies Market Share Analysis
- 13.3.2 Top 3 Companies Market Share Analysis
- 13.4. List of Potential Customers
- 14. Research Methodology
List of Figures
- Figure 1: Global Aerospace and Defense NDT Industry Revenue Breakdown (Million, %) by Region 2025 & 2033
- Figure 2: North America Aerospace and Defense NDT Industry Revenue (Million), by Type 2025 & 2033
- Figure 3: North America Aerospace and Defense NDT Industry Revenue Share (%), by Type 2025 & 2033
- Figure 4: North America Aerospace and Defense NDT Industry Revenue (Million), by Technology 2025 & 2033
- Figure 5: North America Aerospace and Defense NDT Industry Revenue Share (%), by Technology 2025 & 2033
- Figure 6: North America Aerospace and Defense NDT Industry Revenue (Million), by Country 2025 & 2033
- Figure 7: North America Aerospace and Defense NDT Industry Revenue Share (%), by Country 2025 & 2033
- Figure 8: Europe Aerospace and Defense NDT Industry Revenue (Million), by Type 2025 & 2033
- Figure 9: Europe Aerospace and Defense NDT Industry Revenue Share (%), by Type 2025 & 2033
- Figure 10: Europe Aerospace and Defense NDT Industry Revenue (Million), by Technology 2025 & 2033
- Figure 11: Europe Aerospace and Defense NDT Industry Revenue Share (%), by Technology 2025 & 2033
- Figure 12: Europe Aerospace and Defense NDT Industry Revenue (Million), by Country 2025 & 2033
- Figure 13: Europe Aerospace and Defense NDT Industry Revenue Share (%), by Country 2025 & 2033
- Figure 14: Asia Aerospace and Defense NDT Industry Revenue (Million), by Type 2025 & 2033
- Figure 15: Asia Aerospace and Defense NDT Industry Revenue Share (%), by Type 2025 & 2033
- Figure 16: Asia Aerospace and Defense NDT Industry Revenue (Million), by Technology 2025 & 2033
- Figure 17: Asia Aerospace and Defense NDT Industry Revenue Share (%), by Technology 2025 & 2033
- Figure 18: Asia Aerospace and Defense NDT Industry Revenue (Million), by Country 2025 & 2033
- Figure 19: Asia Aerospace and Defense NDT Industry Revenue Share (%), by Country 2025 & 2033
- Figure 20: Australia and New Zealand Aerospace and Defense NDT Industry Revenue (Million), by Type 2025 & 2033
- Figure 21: Australia and New Zealand Aerospace and Defense NDT Industry Revenue Share (%), by Type 2025 & 2033
- Figure 22: Australia and New Zealand Aerospace and Defense NDT Industry Revenue (Million), by Technology 2025 & 2033
- Figure 23: Australia and New Zealand Aerospace and Defense NDT Industry Revenue Share (%), by Technology 2025 & 2033
- Figure 24: Australia and New Zealand Aerospace and Defense NDT Industry Revenue (Million), by Country 2025 & 2033
- Figure 25: Australia and New Zealand Aerospace and Defense NDT Industry Revenue Share (%), by Country 2025 & 2033
- Figure 26: Latin America Aerospace and Defense NDT Industry Revenue (Million), by Type 2025 & 2033
- Figure 27: Latin America Aerospace and Defense NDT Industry Revenue Share (%), by Type 2025 & 2033
- Figure 28: Latin America Aerospace and Defense NDT Industry Revenue (Million), by Technology 2025 & 2033
- Figure 29: Latin America Aerospace and Defense NDT Industry Revenue Share (%), by Technology 2025 & 2033
- Figure 30: Latin America Aerospace and Defense NDT Industry Revenue (Million), by Country 2025 & 2033
- Figure 31: Latin America Aerospace and Defense NDT Industry Revenue Share (%), by Country 2025 & 2033
- Figure 32: Middle East and Africa Aerospace and Defense NDT Industry Revenue (Million), by Type 2025 & 2033
- Figure 33: Middle East and Africa Aerospace and Defense NDT Industry Revenue Share (%), by Type 2025 & 2033
- Figure 34: Middle East and Africa Aerospace and Defense NDT Industry Revenue (Million), by Technology 2025 & 2033
- Figure 35: Middle East and Africa Aerospace and Defense NDT Industry Revenue Share (%), by Technology 2025 & 2033
- Figure 36: Middle East and Africa Aerospace and Defense NDT Industry Revenue (Million), by Country 2025 & 2033
- Figure 37: Middle East and Africa Aerospace and Defense NDT Industry Revenue Share (%), by Country 2025 & 2033
List of Tables
- Table 1: Global Aerospace and Defense NDT Industry Revenue Million Forecast, by Type 2020 & 2033
- Table 2: Global Aerospace and Defense NDT Industry Revenue Million Forecast, by Technology 2020 & 2033
- Table 3: Global Aerospace and Defense NDT Industry Revenue Million Forecast, by Region 2020 & 2033
- Table 4: Global Aerospace and Defense NDT Industry Revenue Million Forecast, by Type 2020 & 2033
- Table 5: Global Aerospace and Defense NDT Industry Revenue Million Forecast, by Technology 2020 & 2033
- Table 6: Global Aerospace and Defense NDT Industry Revenue Million Forecast, by Country 2020 & 2033
- Table 7: Global Aerospace and Defense NDT Industry Revenue Million Forecast, by Type 2020 & 2033
- Table 8: Global Aerospace and Defense NDT Industry Revenue Million Forecast, by Technology 2020 & 2033
- Table 9: Global Aerospace and Defense NDT Industry Revenue Million Forecast, by Country 2020 & 2033
- Table 10: Global Aerospace and Defense NDT Industry Revenue Million Forecast, by Type 2020 & 2033
- Table 11: Global Aerospace and Defense NDT Industry Revenue Million Forecast, by Technology 2020 & 2033
- Table 12: Global Aerospace and Defense NDT Industry Revenue Million Forecast, by Country 2020 & 2033
- Table 13: Global Aerospace and Defense NDT Industry Revenue Million Forecast, by Type 2020 & 2033
- Table 14: Global Aerospace and Defense NDT Industry Revenue Million Forecast, by Technology 2020 & 2033
- Table 15: Global Aerospace and Defense NDT Industry Revenue Million Forecast, by Country 2020 & 2033
- Table 16: Global Aerospace and Defense NDT Industry Revenue Million Forecast, by Type 2020 & 2033
- Table 17: Global Aerospace and Defense NDT Industry Revenue Million Forecast, by Technology 2020 & 2033
- Table 18: Global Aerospace and Defense NDT Industry Revenue Million Forecast, by Country 2020 & 2033
- Table 19: Global Aerospace and Defense NDT Industry Revenue Million Forecast, by Type 2020 & 2033
- Table 20: Global Aerospace and Defense NDT Industry Revenue Million Forecast, by Technology 2020 & 2033
- Table 21: Global Aerospace and Defense NDT Industry Revenue Million Forecast, by Country 2020 & 2033
Frequently Asked Questions
1. What is the projected Compound Annual Growth Rate (CAGR) of the Aerospace and Defense NDT Industry?
The projected CAGR is approximately 15.74%.
2. Which companies are prominent players in the Aerospace and Defense NDT Industry?
Key companies in the market include Fujifilm NDT Systems, Intertek Group PLC, Magnaflux Corporation, Yxlon International GmbH, Team Inc, SGS Group, TUV Rheinland Ag, NikonMetrology Inc, Mistras Group, Olympus Corporation, GE Measurement and Control, Applus Services S A, FLIR Systems Inc *List Not Exhaustive, Gould-Bass Co.
3. What are the main segments of the Aerospace and Defense NDT Industry?
The market segments include Type, Technology.
4. Can you provide details about the market size?
The market size is estimated to be USD 9.11 Million as of 2022.
5. What are some drivers contributing to market growth?
Increasing Investments in Aerospace & Defense; Increasing Complexity of Machine and Infrastructure.
6. What are the notable trends driving market growth?
Radiography Testing Technology to Account for the Largest Share.
7. Are there any restraints impacting market growth?
Lack Of Technical Workforce; Relative Lack of Awareness.
8. Can you provide examples of recent developments in the market?
March 2024 – Eddyfi Technologies, a player in the global non-destructive testing (NDT) solutions market, unveils TubePro 6, its advanced pre-inspection and reporting software. TubePro 6 is equipping organizations with advanced tools. These features promise unmatched insights and operational efficiency, particularly in heat exchanger inspections.
9. What pricing options are available for accessing the report?
Pricing options include single-user, multi-user, and enterprise licenses priced at USD 4750, USD 5250, and USD 8750 respectively.
10. Is the market size provided in terms of value or volume?
The market size is provided in terms of value, measured in Million.
11. Are there any specific market keywords associated with the report?
Yes, the market keyword associated with the report is "Aerospace and Defense NDT Industry," which aids in identifying and referencing the specific market segment covered.
12. How do I determine which pricing option suits my needs best?
The pricing options vary based on user requirements and access needs. Individual users may opt for single-user licenses, while businesses requiring broader access may choose multi-user or enterprise licenses for cost-effective access to the report.
13. Are there any additional resources or data provided in the Aerospace and Defense NDT Industry report?
While the report offers comprehensive insights, it's advisable to review the specific contents or supplementary materials provided to ascertain if additional resources or data are available.
14. How can I stay updated on further developments or reports in the Aerospace and Defense NDT Industry?
To stay informed about further developments, trends, and reports in the Aerospace and Defense NDT Industry, consider subscribing to industry newsletters, following relevant companies and organizations, or regularly checking reputable industry news sources and publications.
Methodology
Step 1 - Identification of Relevant Samples Size from Population Database


Step 2 - Approaches for Defining Global Market Size (Value, Volume* & Price*)

Note*: In applicable scenarios
Step 3 - Data Sources
Primary Research
- Web Analytics
- Survey Reports
- Research Institute
- Latest Research Reports
- Opinion Leaders
Secondary Research
- Annual Reports
- White Paper
- Latest Press Release
- Industry Association
- Paid Database
- Investor Presentations

Step 4 - Data Triangulation
Involves using different sources of information in order to increase the validity of a study
These sources are likely to be stakeholders in a program - participants, other researchers, program staff, other community members, and so on.
Then we put all data in single framework & apply various statistical tools to find out the dynamic on the market.
During the analysis stage, feedback from the stakeholder groups would be compared to determine areas of agreement as well as areas of divergence