

Key Insights
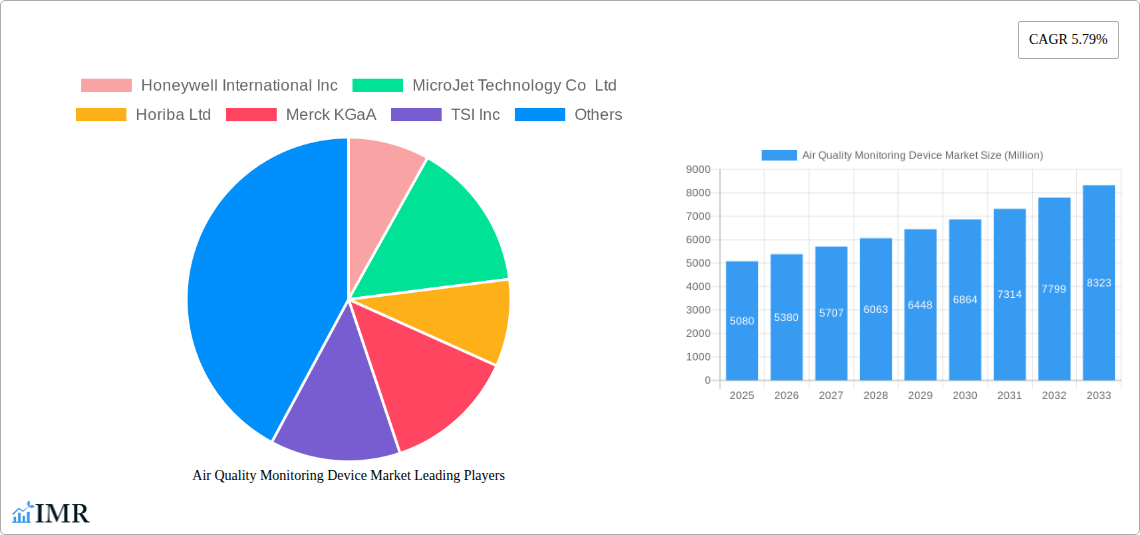
The Air Quality Monitoring Device market is experiencing robust growth, projected to reach a market size of $5.08 billion in 2025 and maintain a Compound Annual Growth Rate (CAGR) of 5.79% from 2025 to 2033. This expansion is driven by several key factors. Increasing environmental concerns and stricter government regulations regarding air quality are fueling demand, particularly in densely populated urban areas and regions with high industrial activity. Furthermore, advancements in sensor technology are leading to the development of more accurate, reliable, and cost-effective monitoring devices. The rise of smart cities and the increasing adoption of IoT (Internet of Things) technologies are also contributing to market growth, enabling real-time data collection and analysis for improved air quality management. Finally, the growing awareness among consumers about the health impacts of poor air quality is driving increased adoption of personal air quality monitors in residential settings.
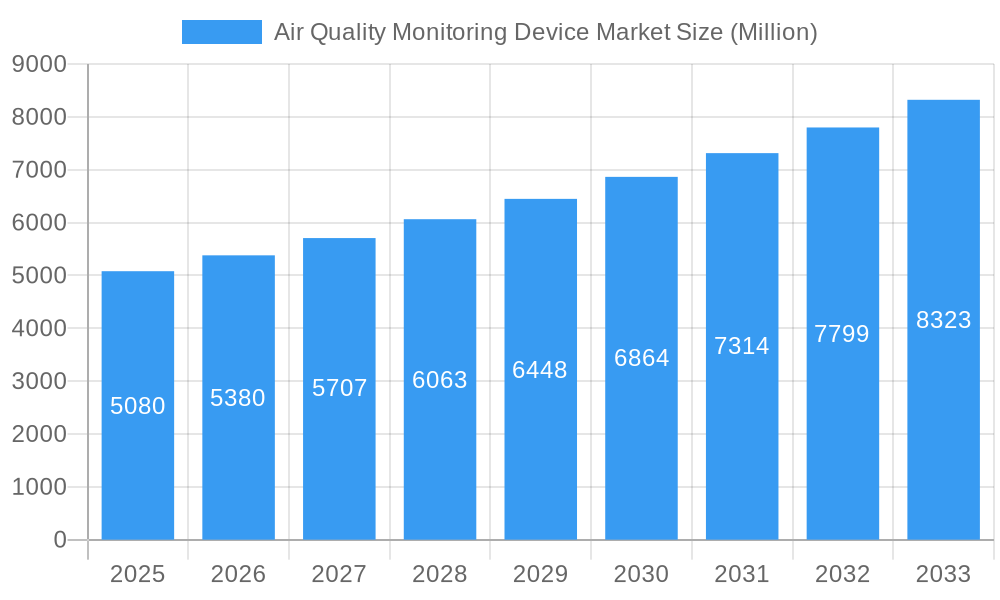
Air Quality Monitoring Device Market Market Size (In Billion)
The market is segmented by product type (indoor and outdoor monitors), sampling method (continuous, manual, and intermittent), and end-user (residential, commercial, power generation, petrochemicals, and others). The continuous monitoring segment is expected to dominate due to its ability to provide real-time data, crucial for effective air quality management. Geographically, North America and Europe currently hold significant market share, driven by strong environmental regulations and high technological adoption. However, the Asia-Pacific region is projected to witness the fastest growth rate due to rapid industrialization and urbanization in countries like China and India. While the market faces certain restraints, such as high initial investment costs for advanced monitoring systems and the need for skilled personnel for data interpretation and maintenance, the overall positive market trends suggest a continued upward trajectory for the foreseeable future. The competitive landscape includes both established players like Honeywell, Thermo Fisher Scientific, and Siemens, and emerging companies specializing in innovative monitoring technologies, resulting in continuous product development and improvement.
Air Quality Monitoring Device Market Company Market Share
Air Quality Monitoring Device Market: A Comprehensive Report (2019-2033)
This comprehensive report provides an in-depth analysis of the Air Quality Monitoring Device market, encompassing market dynamics, growth trends, regional segmentation, product landscape, key players, and future outlook. The study period covers 2019-2033, with 2025 as the base and estimated year. The report offers crucial insights for industry professionals, investors, and stakeholders seeking to navigate this rapidly evolving market.
The parent market is Environmental Monitoring Equipment, and the child market is Air Quality Monitoring Devices.
Air Quality Monitoring Device Market Dynamics & Structure
The Air Quality Monitoring Device market is characterized by moderate concentration, with key players like Honeywell International Inc, Honeywell International Inc, MicroJet Technology Co Ltd, Horiba Ltd, Merck KGaA, TSI Inc, Thermo Fisher Scientific Inc, Hawa Dawa GmbH, Emerson Electric Co, Siemens AG, Agilent Technologies Inc, 3M Co, and Teledyne Technologies Inc holding significant market share. Technological innovation, driven by advancements in sensor technology and data analytics, is a major growth driver. Stringent government regulations aimed at improving air quality globally are further propelling market expansion. However, high initial investment costs and the availability of substitute technologies pose challenges. The market witnesses consistent M&A activity, with xx deals recorded between 2019 and 2024, signifying consolidation and expansion strategies amongst key players. End-user demographics are expanding, with increasing demand from residential, commercial, power generation, and petrochemical sectors.
- Market Concentration: Moderately concentrated, with top 10 players holding xx% market share in 2024.
- Technological Innovation: Advancements in sensor technology (e.g., MEMS sensors), IoT integration, and AI-powered data analytics.
- Regulatory Landscape: Stringent emission standards and air quality monitoring mandates across various geographies.
- Competitive Substitutes: Limited, but alternative technologies are emerging, such as low-cost DIY solutions.
- M&A Activity: xx deals between 2019 and 2024, indicating a trend towards consolidation and expansion.
- End-User Demographics: Growing demand from residential, commercial, industrial, and governmental sectors.
Air Quality Monitoring Device Market Growth Trends & Insights
The Air Quality Monitoring Device market experienced substantial growth between 2019 and 2024, with a CAGR of xx%. This growth is attributed to increasing awareness of air pollution's health impacts, coupled with stricter environmental regulations. The market size is projected to reach xx million units by 2025 and is expected to maintain a robust CAGR of xx% during the forecast period (2025-2033), reaching xx million units by 2033. Technological disruptions, particularly the rise of IoT-enabled devices and advanced data analytics platforms, are driving adoption rates. Consumer behavior is shifting towards more sophisticated, user-friendly devices that offer real-time monitoring and data visualization. Market penetration in developed regions is relatively high, while developing countries present significant untapped potential for growth.
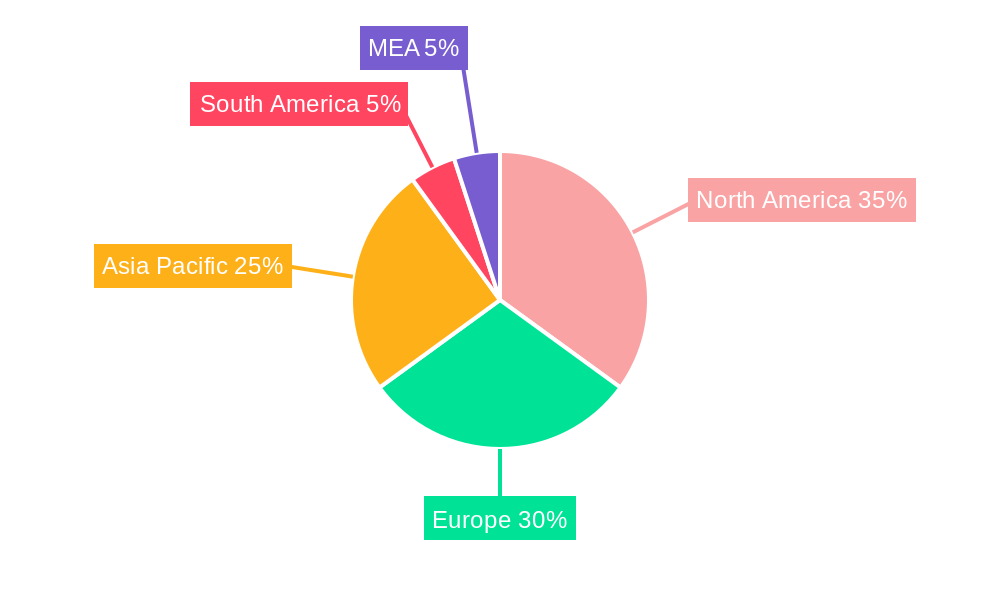
Dominant Regions, Countries, or Segments in Air Quality Monitoring Device Market
North America currently holds the largest market share, driven by stringent environmental regulations and high consumer awareness. However, the Asia-Pacific region is expected to witness the fastest growth, fueled by rapid industrialization and urbanization. Within product types, the outdoor monitor segment dominates, accounting for xx% of the market in 2024, due to widespread applications in environmental monitoring and industrial settings. Continuous sampling methods hold a significant share, reflecting the demand for real-time data and accurate pollution tracking. The residential and commercial end-user segment displays the highest growth potential, driven by increasing consumer demand for indoor air quality improvement.
- Leading Region: North America (xx% market share in 2024)
- Fastest-Growing Region: Asia-Pacific (projected CAGR of xx% during 2025-2033)
- Dominant Product Type: Outdoor Monitors (xx% market share in 2024)
- Dominant Sampling Method: Continuous (xx% market share in 2024)
- Highest Growth Potential End-User: Residential & Commercial
Air Quality Monitoring Device Market Product Landscape
The market offers a diverse range of air quality monitoring devices, from basic portable units to sophisticated, network-connected systems. Product innovations focus on enhanced accuracy, portability, and user-friendly interfaces. Advanced features such as real-time data analysis, remote monitoring capabilities, and integration with smart home ecosystems are becoming increasingly common. Key performance metrics include accuracy, sensitivity, response time, and data storage capacity. Unique selling propositions often include patented sensor technologies, cloud-based data platforms, and specialized applications for specific pollutants.
Key Drivers, Barriers & Challenges in Air Quality Monitoring Device Market
Key Drivers:
- Increasing awareness of air pollution's health effects.
- Stringent government regulations and emission standards.
- Technological advancements in sensor technology and data analytics.
- Growing demand for real-time air quality data.
Challenges & Restraints:
- High initial investment costs for advanced monitoring systems.
- Complexity of data interpretation and analysis for non-technical users.
- Potential for inaccurate readings due to environmental factors or sensor limitations.
- Supply chain disruptions impacting the availability of key components.
- Regulatory hurdles and varying standards across different regions.
Emerging Opportunities in Air Quality Monitoring Device Market
- Expansion into untapped markets in developing economies.
- Development of affordable and user-friendly devices for the residential market.
- Integration of air quality monitoring with smart city initiatives.
- Personalized air quality monitoring solutions tailored to individual needs.
- Growing demand for portable and wearable air quality sensors.
Growth Accelerators in the Air Quality Monitoring Device Market Industry
Long-term growth will be propelled by ongoing technological advancements, such as the development of more sensitive and cost-effective sensors. Strategic partnerships between sensor manufacturers, data analytics firms, and end-users will further accelerate market expansion. Government initiatives promoting air quality monitoring and the increasing adoption of smart city technologies will also play a pivotal role. Expansion into emerging markets in Asia, Africa, and South America presents significant growth opportunities.
Key Players Shaping the Air Quality Monitoring Device Market Market
- Honeywell International Inc
- MicroJet Technology Co Ltd
- Horiba Ltd
- Merck KGaA
- TSI Inc
- Thermo Fisher Scientific Inc
- Hawa Dawa GmbH
- Emerson Electric Co
- Siemens AG
- Agilent Technologies Inc
- 3M Co
- Teledyne Technologies Inc
Notable Milestones in Air Quality Monitoring Device Market Sector
- March 2023: Tyndall National Institute's participation in a European project focused on improving air quality monitoring.
- February 2022: Hawa Dawa's strategic partnership with Thies Clima to offer integrated air quality and weather data solutions.
In-Depth Air Quality Monitoring Device Market Market Outlook
The Air Quality Monitoring Device market is poised for continued robust growth, driven by increasing environmental concerns, technological innovation, and supportive government policies. The focus on developing cost-effective, user-friendly, and highly accurate devices will drive market penetration. Strategic partnerships and investments in research and development will play a key role in shaping the future landscape of this market, leading to greater precision, data analysis capabilities, and accessibility. The continued expansion into emerging markets presents substantial untapped potential for future growth.
Air Quality Monitoring Device Market Segmentation
-
1. Product Type
- 1.1. Indoor Monitor
- 1.2. Outdoor Monitor
-
2. Sampling Method
- 2.1. Continuous
- 2.2. Manual
- 2.3. Intermittent
-
3. End User
- 3.1. Residential and Commercial
- 3.2. Power Generation
- 3.3. Petrochemicals
- 3.4. Other End Users
Air Quality Monitoring Device Market Segmentation By Geography
-
1. North America
- 1.1. United States
- 1.2. Canada
- 1.3. Rest of the North America
-
2. Europe
- 2.1. United Kingdom
- 2.2. Spain
- 2.3. Germany
- 2.4. Italy
-
3. Asia
- 3.1. China
- 3.2. Japan
- 3.3. Vietnam
- 3.4. India
- 3.5. Australia and New Zealand
-
4. South America
- 4.1. Brazil
- 4.2. Argentina
-
5. Middle East and Africa
- 5.1. United Arab Emirates
- 5.2. South Africa
- 5.3. Saudi Arabia
- 5.4. Iraq
Air Quality Monitoring Device Market Regional Market Share
Geographic Coverage of Air Quality Monitoring Device Market
Air Quality Monitoring Device Market REPORT HIGHLIGHTS
| Aspects | Details |
|---|---|
| Study Period | 2020-2034 |
| Base Year | 2025 |
| Estimated Year | 2026 |
| Forecast Period | 2026-2034 |
| Historical Period | 2020-2025 |
| Growth Rate | CAGR of 5.79% from 2020-2034 |
| Segmentation |
|
Table of Contents
- 1. Introduction
- 1.1. Research Scope
- 1.2. Market Segmentation
- 1.3. Research Objective
- 1.4. Definitions and Assumptions
- 2. Executive Summary
- 2.1. Market Snapshot
- 3. Market Dynamics
- 3.1. Market Drivers
- 3.2. Market Restrains
- 3.3. Market Trends
- 3.4. Market Opportunities
- 4. Market Factor Analysis
- 4.1. Porters Five Forces
- 4.1.1. Bargaining Power of Suppliers
- 4.1.2. Bargaining Power of Buyers
- 4.1.3. Threat of New Entrants
- 4.1.4. Threat of Substitutes
- 4.1.5. Competitive Rivalry
- 4.2. PESTEL analysis
- 4.3. BCG Analysis
- 4.3.1. Stars (High Growth, High Market Share)
- 4.3.2. Cash Cows (Low Growth, High Market Share)
- 4.3.3. Question Mark (High Growth, Low Market Share)
- 4.3.4. Dogs (Low Growth, Low Market Share)
- 4.4. Ansoff Matrix Analysis
- 4.5. Supply Chain Analysis
- 4.6. Regulatory Landscape
- 4.7. Current Market Potential and Opportunity Assessment (TAM–SAM–SOM Framework)
- 4.8. IMR Analyst Note
- 4.1. Porters Five Forces
- 5. Market Analysis, Insights and Forecast 2021-2033
- 5.1. Market Analysis, Insights and Forecast - by Product Type
- 5.1.1. Indoor Monitor
- 5.1.2. Outdoor Monitor
- 5.2. Market Analysis, Insights and Forecast - by Sampling Method
- 5.2.1. Continuous
- 5.2.2. Manual
- 5.2.3. Intermittent
- 5.3. Market Analysis, Insights and Forecast - by End User
- 5.3.1. Residential and Commercial
- 5.3.2. Power Generation
- 5.3.3. Petrochemicals
- 5.3.4. Other End Users
- 5.4. Market Analysis, Insights and Forecast - by Region
- 5.4.1. North America
- 5.4.2. Europe
- 5.4.3. Asia
- 5.4.4. South America
- 5.4.5. Middle East and Africa
- 5.1. Market Analysis, Insights and Forecast - by Product Type
- 6. Global Air Quality Monitoring Device Market Analysis, Insights and Forecast, 2021-2033
- 6.1. Market Analysis, Insights and Forecast - by Product Type
- 6.1.1. Indoor Monitor
- 6.1.2. Outdoor Monitor
- 6.2. Market Analysis, Insights and Forecast - by Sampling Method
- 6.2.1. Continuous
- 6.2.2. Manual
- 6.2.3. Intermittent
- 6.3. Market Analysis, Insights and Forecast - by End User
- 6.3.1. Residential and Commercial
- 6.3.2. Power Generation
- 6.3.3. Petrochemicals
- 6.3.4. Other End Users
- 6.1. Market Analysis, Insights and Forecast - by Product Type
- 7. North America Air Quality Monitoring Device Market Analysis, Insights and Forecast, 2020-2032
- 7.1. Market Analysis, Insights and Forecast - by Product Type
- 7.1.1. Indoor Monitor
- 7.1.2. Outdoor Monitor
- 7.2. Market Analysis, Insights and Forecast - by Sampling Method
- 7.2.1. Continuous
- 7.2.2. Manual
- 7.2.3. Intermittent
- 7.3. Market Analysis, Insights and Forecast - by End User
- 7.3.1. Residential and Commercial
- 7.3.2. Power Generation
- 7.3.3. Petrochemicals
- 7.3.4. Other End Users
- 7.1. Market Analysis, Insights and Forecast - by Product Type
- 8. Europe Air Quality Monitoring Device Market Analysis, Insights and Forecast, 2020-2032
- 8.1. Market Analysis, Insights and Forecast - by Product Type
- 8.1.1. Indoor Monitor
- 8.1.2. Outdoor Monitor
- 8.2. Market Analysis, Insights and Forecast - by Sampling Method
- 8.2.1. Continuous
- 8.2.2. Manual
- 8.2.3. Intermittent
- 8.3. Market Analysis, Insights and Forecast - by End User
- 8.3.1. Residential and Commercial
- 8.3.2. Power Generation
- 8.3.3. Petrochemicals
- 8.3.4. Other End Users
- 8.1. Market Analysis, Insights and Forecast - by Product Type
- 9. Asia Air Quality Monitoring Device Market Analysis, Insights and Forecast, 2020-2032
- 9.1. Market Analysis, Insights and Forecast - by Product Type
- 9.1.1. Indoor Monitor
- 9.1.2. Outdoor Monitor
- 9.2. Market Analysis, Insights and Forecast - by Sampling Method
- 9.2.1. Continuous
- 9.2.2. Manual
- 9.2.3. Intermittent
- 9.3. Market Analysis, Insights and Forecast - by End User
- 9.3.1. Residential and Commercial
- 9.3.2. Power Generation
- 9.3.3. Petrochemicals
- 9.3.4. Other End Users
- 9.1. Market Analysis, Insights and Forecast - by Product Type
- 10. South America Air Quality Monitoring Device Market Analysis, Insights and Forecast, 2020-2032
- 10.1. Market Analysis, Insights and Forecast - by Product Type
- 10.1.1. Indoor Monitor
- 10.1.2. Outdoor Monitor
- 10.2. Market Analysis, Insights and Forecast - by Sampling Method
- 10.2.1. Continuous
- 10.2.2. Manual
- 10.2.3. Intermittent
- 10.3. Market Analysis, Insights and Forecast - by End User
- 10.3.1. Residential and Commercial
- 10.3.2. Power Generation
- 10.3.3. Petrochemicals
- 10.3.4. Other End Users
- 10.1. Market Analysis, Insights and Forecast - by Product Type
- 11. Middle East and Africa Air Quality Monitoring Device Market Analysis, Insights and Forecast, 2020-2032
- 11.1. Market Analysis, Insights and Forecast - by Product Type
- 11.1.1. Indoor Monitor
- 11.1.2. Outdoor Monitor
- 11.2. Market Analysis, Insights and Forecast - by Sampling Method
- 11.2.1. Continuous
- 11.2.2. Manual
- 11.2.3. Intermittent
- 11.3. Market Analysis, Insights and Forecast - by End User
- 11.3.1. Residential and Commercial
- 11.3.2. Power Generation
- 11.3.3. Petrochemicals
- 11.3.4. Other End Users
- 11.1. Market Analysis, Insights and Forecast - by Product Type
- 12. Competitive Analysis
- 12.1. Company Profiles
- 12.1.1 Honeywell International Inc
- 12.1.1.1. Company Overview
- 12.1.1.2. Products
- 12.1.1.3. Company Financials
- 12.1.1.4. SWOT Analysis
- 12.1.2 MicroJet Technology Co Ltd
- 12.1.2.1. Company Overview
- 12.1.2.2. Products
- 12.1.2.3. Company Financials
- 12.1.2.4. SWOT Analysis
- 12.1.3 Horiba Ltd
- 12.1.3.1. Company Overview
- 12.1.3.2. Products
- 12.1.3.3. Company Financials
- 12.1.3.4. SWOT Analysis
- 12.1.4 Merck KGaA
- 12.1.4.1. Company Overview
- 12.1.4.2. Products
- 12.1.4.3. Company Financials
- 12.1.4.4. SWOT Analysis
- 12.1.5 TSI Inc
- 12.1.5.1. Company Overview
- 12.1.5.2. Products
- 12.1.5.3. Company Financials
- 12.1.5.4. SWOT Analysis
- 12.1.6 Thermo Fisher Scientific Inc
- 12.1.6.1. Company Overview
- 12.1.6.2. Products
- 12.1.6.3. Company Financials
- 12.1.6.4. SWOT Analysis
- 12.1.7 Hawa Dawa GmbH
- 12.1.7.1. Company Overview
- 12.1.7.2. Products
- 12.1.7.3. Company Financials
- 12.1.7.4. SWOT Analysis
- 12.1.8 Emerson Electric Co
- 12.1.8.1. Company Overview
- 12.1.8.2. Products
- 12.1.8.3. Company Financials
- 12.1.8.4. SWOT Analysis
- 12.1.9 Siemens AG
- 12.1.9.1. Company Overview
- 12.1.9.2. Products
- 12.1.9.3. Company Financials
- 12.1.9.4. SWOT Analysis
- 12.1.10 Agilent Technologies Inc
- 12.1.10.1. Company Overview
- 12.1.10.2. Products
- 12.1.10.3. Company Financials
- 12.1.10.4. SWOT Analysis
- 12.1.11 3M Co
- 12.1.11.1. Company Overview
- 12.1.11.2. Products
- 12.1.11.3. Company Financials
- 12.1.11.4. SWOT Analysis
- 12.1.12 Teledyne Technologies Inc
- 12.1.12.1. Company Overview
- 12.1.12.2. Products
- 12.1.12.3. Company Financials
- 12.1.12.4. SWOT Analysis
- 12.1.1 Honeywell International Inc
- 12.2. Market Entropy
- 12.2.1 Company's Key Areas Served
- 12.2.2 Recent Developments
- 12.3. Company Market Share Analysis 2025
- 12.3.1 Top 5 Companies Market Share Analysis
- 12.3.2 Top 3 Companies Market Share Analysis
- 12.4. List of Potential Customers
- 13. Research Methodology
List of Figures
- Figure 1: Global Air Quality Monitoring Device Market Revenue Breakdown (Million, %) by Region 2025 & 2033
- Figure 2: Global Air Quality Monitoring Device Market Volume Breakdown (K Units, %) by Region 2025 & 2033
- Figure 3: North America Air Quality Monitoring Device Market Revenue (Million), by Product Type 2025 & 2033
- Figure 4: North America Air Quality Monitoring Device Market Volume (K Units), by Product Type 2025 & 2033
- Figure 5: North America Air Quality Monitoring Device Market Revenue Share (%), by Product Type 2025 & 2033
- Figure 6: North America Air Quality Monitoring Device Market Volume Share (%), by Product Type 2025 & 2033
- Figure 7: North America Air Quality Monitoring Device Market Revenue (Million), by Sampling Method 2025 & 2033
- Figure 8: North America Air Quality Monitoring Device Market Volume (K Units), by Sampling Method 2025 & 2033
- Figure 9: North America Air Quality Monitoring Device Market Revenue Share (%), by Sampling Method 2025 & 2033
- Figure 10: North America Air Quality Monitoring Device Market Volume Share (%), by Sampling Method 2025 & 2033
- Figure 11: North America Air Quality Monitoring Device Market Revenue (Million), by End User 2025 & 2033
- Figure 12: North America Air Quality Monitoring Device Market Volume (K Units), by End User 2025 & 2033
- Figure 13: North America Air Quality Monitoring Device Market Revenue Share (%), by End User 2025 & 2033
- Figure 14: North America Air Quality Monitoring Device Market Volume Share (%), by End User 2025 & 2033
- Figure 15: North America Air Quality Monitoring Device Market Revenue (Million), by Country 2025 & 2033
- Figure 16: North America Air Quality Monitoring Device Market Volume (K Units), by Country 2025 & 2033
- Figure 17: North America Air Quality Monitoring Device Market Revenue Share (%), by Country 2025 & 2033
- Figure 18: North America Air Quality Monitoring Device Market Volume Share (%), by Country 2025 & 2033
- Figure 19: Europe Air Quality Monitoring Device Market Revenue (Million), by Product Type 2025 & 2033
- Figure 20: Europe Air Quality Monitoring Device Market Volume (K Units), by Product Type 2025 & 2033
- Figure 21: Europe Air Quality Monitoring Device Market Revenue Share (%), by Product Type 2025 & 2033
- Figure 22: Europe Air Quality Monitoring Device Market Volume Share (%), by Product Type 2025 & 2033
- Figure 23: Europe Air Quality Monitoring Device Market Revenue (Million), by Sampling Method 2025 & 2033
- Figure 24: Europe Air Quality Monitoring Device Market Volume (K Units), by Sampling Method 2025 & 2033
- Figure 25: Europe Air Quality Monitoring Device Market Revenue Share (%), by Sampling Method 2025 & 2033
- Figure 26: Europe Air Quality Monitoring Device Market Volume Share (%), by Sampling Method 2025 & 2033
- Figure 27: Europe Air Quality Monitoring Device Market Revenue (Million), by End User 2025 & 2033
- Figure 28: Europe Air Quality Monitoring Device Market Volume (K Units), by End User 2025 & 2033
- Figure 29: Europe Air Quality Monitoring Device Market Revenue Share (%), by End User 2025 & 2033
- Figure 30: Europe Air Quality Monitoring Device Market Volume Share (%), by End User 2025 & 2033
- Figure 31: Europe Air Quality Monitoring Device Market Revenue (Million), by Country 2025 & 2033
- Figure 32: Europe Air Quality Monitoring Device Market Volume (K Units), by Country 2025 & 2033
- Figure 33: Europe Air Quality Monitoring Device Market Revenue Share (%), by Country 2025 & 2033
- Figure 34: Europe Air Quality Monitoring Device Market Volume Share (%), by Country 2025 & 2033
- Figure 35: Asia Air Quality Monitoring Device Market Revenue (Million), by Product Type 2025 & 2033
- Figure 36: Asia Air Quality Monitoring Device Market Volume (K Units), by Product Type 2025 & 2033
- Figure 37: Asia Air Quality Monitoring Device Market Revenue Share (%), by Product Type 2025 & 2033
- Figure 38: Asia Air Quality Monitoring Device Market Volume Share (%), by Product Type 2025 & 2033
- Figure 39: Asia Air Quality Monitoring Device Market Revenue (Million), by Sampling Method 2025 & 2033
- Figure 40: Asia Air Quality Monitoring Device Market Volume (K Units), by Sampling Method 2025 & 2033
- Figure 41: Asia Air Quality Monitoring Device Market Revenue Share (%), by Sampling Method 2025 & 2033
- Figure 42: Asia Air Quality Monitoring Device Market Volume Share (%), by Sampling Method 2025 & 2033
- Figure 43: Asia Air Quality Monitoring Device Market Revenue (Million), by End User 2025 & 2033
- Figure 44: Asia Air Quality Monitoring Device Market Volume (K Units), by End User 2025 & 2033
- Figure 45: Asia Air Quality Monitoring Device Market Revenue Share (%), by End User 2025 & 2033
- Figure 46: Asia Air Quality Monitoring Device Market Volume Share (%), by End User 2025 & 2033
- Figure 47: Asia Air Quality Monitoring Device Market Revenue (Million), by Country 2025 & 2033
- Figure 48: Asia Air Quality Monitoring Device Market Volume (K Units), by Country 2025 & 2033
- Figure 49: Asia Air Quality Monitoring Device Market Revenue Share (%), by Country 2025 & 2033
- Figure 50: Asia Air Quality Monitoring Device Market Volume Share (%), by Country 2025 & 2033
- Figure 51: South America Air Quality Monitoring Device Market Revenue (Million), by Product Type 2025 & 2033
- Figure 52: South America Air Quality Monitoring Device Market Volume (K Units), by Product Type 2025 & 2033
- Figure 53: South America Air Quality Monitoring Device Market Revenue Share (%), by Product Type 2025 & 2033
- Figure 54: South America Air Quality Monitoring Device Market Volume Share (%), by Product Type 2025 & 2033
- Figure 55: South America Air Quality Monitoring Device Market Revenue (Million), by Sampling Method 2025 & 2033
- Figure 56: South America Air Quality Monitoring Device Market Volume (K Units), by Sampling Method 2025 & 2033
- Figure 57: South America Air Quality Monitoring Device Market Revenue Share (%), by Sampling Method 2025 & 2033
- Figure 58: South America Air Quality Monitoring Device Market Volume Share (%), by Sampling Method 2025 & 2033
- Figure 59: South America Air Quality Monitoring Device Market Revenue (Million), by End User 2025 & 2033
- Figure 60: South America Air Quality Monitoring Device Market Volume (K Units), by End User 2025 & 2033
- Figure 61: South America Air Quality Monitoring Device Market Revenue Share (%), by End User 2025 & 2033
- Figure 62: South America Air Quality Monitoring Device Market Volume Share (%), by End User 2025 & 2033
- Figure 63: South America Air Quality Monitoring Device Market Revenue (Million), by Country 2025 & 2033
- Figure 64: South America Air Quality Monitoring Device Market Volume (K Units), by Country 2025 & 2033
- Figure 65: South America Air Quality Monitoring Device Market Revenue Share (%), by Country 2025 & 2033
- Figure 66: South America Air Quality Monitoring Device Market Volume Share (%), by Country 2025 & 2033
- Figure 67: Middle East and Africa Air Quality Monitoring Device Market Revenue (Million), by Product Type 2025 & 2033
- Figure 68: Middle East and Africa Air Quality Monitoring Device Market Volume (K Units), by Product Type 2025 & 2033
- Figure 69: Middle East and Africa Air Quality Monitoring Device Market Revenue Share (%), by Product Type 2025 & 2033
- Figure 70: Middle East and Africa Air Quality Monitoring Device Market Volume Share (%), by Product Type 2025 & 2033
- Figure 71: Middle East and Africa Air Quality Monitoring Device Market Revenue (Million), by Sampling Method 2025 & 2033
- Figure 72: Middle East and Africa Air Quality Monitoring Device Market Volume (K Units), by Sampling Method 2025 & 2033
- Figure 73: Middle East and Africa Air Quality Monitoring Device Market Revenue Share (%), by Sampling Method 2025 & 2033
- Figure 74: Middle East and Africa Air Quality Monitoring Device Market Volume Share (%), by Sampling Method 2025 & 2033
- Figure 75: Middle East and Africa Air Quality Monitoring Device Market Revenue (Million), by End User 2025 & 2033
- Figure 76: Middle East and Africa Air Quality Monitoring Device Market Volume (K Units), by End User 2025 & 2033
- Figure 77: Middle East and Africa Air Quality Monitoring Device Market Revenue Share (%), by End User 2025 & 2033
- Figure 78: Middle East and Africa Air Quality Monitoring Device Market Volume Share (%), by End User 2025 & 2033
- Figure 79: Middle East and Africa Air Quality Monitoring Device Market Revenue (Million), by Country 2025 & 2033
- Figure 80: Middle East and Africa Air Quality Monitoring Device Market Volume (K Units), by Country 2025 & 2033
- Figure 81: Middle East and Africa Air Quality Monitoring Device Market Revenue Share (%), by Country 2025 & 2033
- Figure 82: Middle East and Africa Air Quality Monitoring Device Market Volume Share (%), by Country 2025 & 2033
List of Tables
- Table 1: Global Air Quality Monitoring Device Market Revenue Million Forecast, by Product Type 2020 & 2033
- Table 2: Global Air Quality Monitoring Device Market Volume K Units Forecast, by Product Type 2020 & 2033
- Table 3: Global Air Quality Monitoring Device Market Revenue Million Forecast, by Sampling Method 2020 & 2033
- Table 4: Global Air Quality Monitoring Device Market Volume K Units Forecast, by Sampling Method 2020 & 2033
- Table 5: Global Air Quality Monitoring Device Market Revenue Million Forecast, by End User 2020 & 2033
- Table 6: Global Air Quality Monitoring Device Market Volume K Units Forecast, by End User 2020 & 2033
- Table 7: Global Air Quality Monitoring Device Market Revenue Million Forecast, by Region 2020 & 2033
- Table 8: Global Air Quality Monitoring Device Market Volume K Units Forecast, by Region 2020 & 2033
- Table 9: Global Air Quality Monitoring Device Market Revenue Million Forecast, by Product Type 2020 & 2033
- Table 10: Global Air Quality Monitoring Device Market Volume K Units Forecast, by Product Type 2020 & 2033
- Table 11: Global Air Quality Monitoring Device Market Revenue Million Forecast, by Sampling Method 2020 & 2033
- Table 12: Global Air Quality Monitoring Device Market Volume K Units Forecast, by Sampling Method 2020 & 2033
- Table 13: Global Air Quality Monitoring Device Market Revenue Million Forecast, by End User 2020 & 2033
- Table 14: Global Air Quality Monitoring Device Market Volume K Units Forecast, by End User 2020 & 2033
- Table 15: Global Air Quality Monitoring Device Market Revenue Million Forecast, by Country 2020 & 2033
- Table 16: Global Air Quality Monitoring Device Market Volume K Units Forecast, by Country 2020 & 2033
- Table 17: United States Air Quality Monitoring Device Market Revenue (Million) Forecast, by Application 2020 & 2033
- Table 18: United States Air Quality Monitoring Device Market Volume (K Units) Forecast, by Application 2020 & 2033
- Table 19: Canada Air Quality Monitoring Device Market Revenue (Million) Forecast, by Application 2020 & 2033
- Table 20: Canada Air Quality Monitoring Device Market Volume (K Units) Forecast, by Application 2020 & 2033
- Table 21: Rest of the North America Air Quality Monitoring Device Market Revenue (Million) Forecast, by Application 2020 & 2033
- Table 22: Rest of the North America Air Quality Monitoring Device Market Volume (K Units) Forecast, by Application 2020 & 2033
- Table 23: Global Air Quality Monitoring Device Market Revenue Million Forecast, by Product Type 2020 & 2033
- Table 24: Global Air Quality Monitoring Device Market Volume K Units Forecast, by Product Type 2020 & 2033
- Table 25: Global Air Quality Monitoring Device Market Revenue Million Forecast, by Sampling Method 2020 & 2033
- Table 26: Global Air Quality Monitoring Device Market Volume K Units Forecast, by Sampling Method 2020 & 2033
- Table 27: Global Air Quality Monitoring Device Market Revenue Million Forecast, by End User 2020 & 2033
- Table 28: Global Air Quality Monitoring Device Market Volume K Units Forecast, by End User 2020 & 2033
- Table 29: Global Air Quality Monitoring Device Market Revenue Million Forecast, by Country 2020 & 2033
- Table 30: Global Air Quality Monitoring Device Market Volume K Units Forecast, by Country 2020 & 2033
- Table 31: United Kingdom Air Quality Monitoring Device Market Revenue (Million) Forecast, by Application 2020 & 2033
- Table 32: United Kingdom Air Quality Monitoring Device Market Volume (K Units) Forecast, by Application 2020 & 2033
- Table 33: Spain Air Quality Monitoring Device Market Revenue (Million) Forecast, by Application 2020 & 2033
- Table 34: Spain Air Quality Monitoring Device Market Volume (K Units) Forecast, by Application 2020 & 2033
- Table 35: Germany Air Quality Monitoring Device Market Revenue (Million) Forecast, by Application 2020 & 2033
- Table 36: Germany Air Quality Monitoring Device Market Volume (K Units) Forecast, by Application 2020 & 2033
- Table 37: Italy Air Quality Monitoring Device Market Revenue (Million) Forecast, by Application 2020 & 2033
- Table 38: Italy Air Quality Monitoring Device Market Volume (K Units) Forecast, by Application 2020 & 2033
- Table 39: Global Air Quality Monitoring Device Market Revenue Million Forecast, by Product Type 2020 & 2033
- Table 40: Global Air Quality Monitoring Device Market Volume K Units Forecast, by Product Type 2020 & 2033
- Table 41: Global Air Quality Monitoring Device Market Revenue Million Forecast, by Sampling Method 2020 & 2033
- Table 42: Global Air Quality Monitoring Device Market Volume K Units Forecast, by Sampling Method 2020 & 2033
- Table 43: Global Air Quality Monitoring Device Market Revenue Million Forecast, by End User 2020 & 2033
- Table 44: Global Air Quality Monitoring Device Market Volume K Units Forecast, by End User 2020 & 2033
- Table 45: Global Air Quality Monitoring Device Market Revenue Million Forecast, by Country 2020 & 2033
- Table 46: Global Air Quality Monitoring Device Market Volume K Units Forecast, by Country 2020 & 2033
- Table 47: China Air Quality Monitoring Device Market Revenue (Million) Forecast, by Application 2020 & 2033
- Table 48: China Air Quality Monitoring Device Market Volume (K Units) Forecast, by Application 2020 & 2033
- Table 49: Japan Air Quality Monitoring Device Market Revenue (Million) Forecast, by Application 2020 & 2033
- Table 50: Japan Air Quality Monitoring Device Market Volume (K Units) Forecast, by Application 2020 & 2033
- Table 51: Vietnam Air Quality Monitoring Device Market Revenue (Million) Forecast, by Application 2020 & 2033
- Table 52: Vietnam Air Quality Monitoring Device Market Volume (K Units) Forecast, by Application 2020 & 2033
- Table 53: India Air Quality Monitoring Device Market Revenue (Million) Forecast, by Application 2020 & 2033
- Table 54: India Air Quality Monitoring Device Market Volume (K Units) Forecast, by Application 2020 & 2033
- Table 55: Australia and New Zealand Air Quality Monitoring Device Market Revenue (Million) Forecast, by Application 2020 & 2033
- Table 56: Australia and New Zealand Air Quality Monitoring Device Market Volume (K Units) Forecast, by Application 2020 & 2033
- Table 57: Global Air Quality Monitoring Device Market Revenue Million Forecast, by Product Type 2020 & 2033
- Table 58: Global Air Quality Monitoring Device Market Volume K Units Forecast, by Product Type 2020 & 2033
- Table 59: Global Air Quality Monitoring Device Market Revenue Million Forecast, by Sampling Method 2020 & 2033
- Table 60: Global Air Quality Monitoring Device Market Volume K Units Forecast, by Sampling Method 2020 & 2033
- Table 61: Global Air Quality Monitoring Device Market Revenue Million Forecast, by End User 2020 & 2033
- Table 62: Global Air Quality Monitoring Device Market Volume K Units Forecast, by End User 2020 & 2033
- Table 63: Global Air Quality Monitoring Device Market Revenue Million Forecast, by Country 2020 & 2033
- Table 64: Global Air Quality Monitoring Device Market Volume K Units Forecast, by Country 2020 & 2033
- Table 65: Brazil Air Quality Monitoring Device Market Revenue (Million) Forecast, by Application 2020 & 2033
- Table 66: Brazil Air Quality Monitoring Device Market Volume (K Units) Forecast, by Application 2020 & 2033
- Table 67: Argentina Air Quality Monitoring Device Market Revenue (Million) Forecast, by Application 2020 & 2033
- Table 68: Argentina Air Quality Monitoring Device Market Volume (K Units) Forecast, by Application 2020 & 2033
- Table 69: Global Air Quality Monitoring Device Market Revenue Million Forecast, by Product Type 2020 & 2033
- Table 70: Global Air Quality Monitoring Device Market Volume K Units Forecast, by Product Type 2020 & 2033
- Table 71: Global Air Quality Monitoring Device Market Revenue Million Forecast, by Sampling Method 2020 & 2033
- Table 72: Global Air Quality Monitoring Device Market Volume K Units Forecast, by Sampling Method 2020 & 2033
- Table 73: Global Air Quality Monitoring Device Market Revenue Million Forecast, by End User 2020 & 2033
- Table 74: Global Air Quality Monitoring Device Market Volume K Units Forecast, by End User 2020 & 2033
- Table 75: Global Air Quality Monitoring Device Market Revenue Million Forecast, by Country 2020 & 2033
- Table 76: Global Air Quality Monitoring Device Market Volume K Units Forecast, by Country 2020 & 2033
- Table 77: United Arab Emirates Air Quality Monitoring Device Market Revenue (Million) Forecast, by Application 2020 & 2033
- Table 78: United Arab Emirates Air Quality Monitoring Device Market Volume (K Units) Forecast, by Application 2020 & 2033
- Table 79: South Africa Air Quality Monitoring Device Market Revenue (Million) Forecast, by Application 2020 & 2033
- Table 80: South Africa Air Quality Monitoring Device Market Volume (K Units) Forecast, by Application 2020 & 2033
- Table 81: Saudi Arabia Air Quality Monitoring Device Market Revenue (Million) Forecast, by Application 2020 & 2033
- Table 82: Saudi Arabia Air Quality Monitoring Device Market Volume (K Units) Forecast, by Application 2020 & 2033
- Table 83: Iraq Air Quality Monitoring Device Market Revenue (Million) Forecast, by Application 2020 & 2033
- Table 84: Iraq Air Quality Monitoring Device Market Volume (K Units) Forecast, by Application 2020 & 2033
Frequently Asked Questions
1. What is the projected Compound Annual Growth Rate (CAGR) of the Air Quality Monitoring Device Market?
The projected CAGR is approximately 5.79%.
2. Which companies are prominent players in the Air Quality Monitoring Device Market?
Key companies in the market include Honeywell International Inc, MicroJet Technology Co Ltd, Horiba Ltd, Merck KGaA, TSI Inc, Thermo Fisher Scientific Inc, Hawa Dawa GmbH, Emerson Electric Co, Siemens AG, Agilent Technologies Inc, 3M Co, Teledyne Technologies Inc.
3. What are the main segments of the Air Quality Monitoring Device Market?
The market segments include Product Type, Sampling Method, End User.
4. Can you provide details about the market size?
The market size is estimated to be USD 5.08 Million as of 2022.
5. What are some drivers contributing to market growth?
4.; Supportive Government Policies to Regulate Air Pollution4.; Expansion of Industrialization Across the World.
6. What are the notable trends driving market growth?
The Outdoor Monitor Segment is Expected to be the Fastest-growing Segment.
7. Are there any restraints impacting market growth?
4.; The Penetration of Cleaner Energy Sources Like Renewables and Nuclear Power.
8. Can you provide examples of recent developments in the market?
In March 2023, Tyndall participated in a new European project aiming to improve air quality monitoring. It is a group member that has received EC (European Commission) funds to research air quality monitoring. The Tyndall National Institute for Research and Development in Microtechnologies (IMT) in Bucharest will lead the initiative, which will benefit from the experience of research institutions in Ireland and Italy.
9. What pricing options are available for accessing the report?
Pricing options include single-user, multi-user, and enterprise licenses priced at USD 4750, USD 5250, and USD 8750 respectively.
10. Is the market size provided in terms of value or volume?
The market size is provided in terms of value, measured in Million and volume, measured in K Units.
11. Are there any specific market keywords associated with the report?
Yes, the market keyword associated with the report is "Air Quality Monitoring Device Market," which aids in identifying and referencing the specific market segment covered.
12. How do I determine which pricing option suits my needs best?
The pricing options vary based on user requirements and access needs. Individual users may opt for single-user licenses, while businesses requiring broader access may choose multi-user or enterprise licenses for cost-effective access to the report.
13. Are there any additional resources or data provided in the Air Quality Monitoring Device Market report?
While the report offers comprehensive insights, it's advisable to review the specific contents or supplementary materials provided to ascertain if additional resources or data are available.
14. How can I stay updated on further developments or reports in the Air Quality Monitoring Device Market?
To stay informed about further developments, trends, and reports in the Air Quality Monitoring Device Market, consider subscribing to industry newsletters, following relevant companies and organizations, or regularly checking reputable industry news sources and publications.
Methodology
Step 1 - Identification of Relevant Samples Size from Population Database


Step 2 - Approaches for Defining Global Market Size (Value, Volume* & Price*)

Note*: In applicable scenarios
Step 3 - Data Sources
Primary Research
- Web Analytics
- Survey Reports
- Research Institute
- Latest Research Reports
- Opinion Leaders
Secondary Research
- Annual Reports
- White Paper
- Latest Press Release
- Industry Association
- Paid Database
- Investor Presentations

Step 4 - Data Triangulation
Involves using different sources of information in order to increase the validity of a study
These sources are likely to be stakeholders in a program - participants, other researchers, program staff, other community members, and so on.
Then we put all data in single framework & apply various statistical tools to find out the dynamic on the market.
During the analysis stage, feedback from the stakeholder groups would be compared to determine areas of agreement as well as areas of divergence