

Key Insights
The global pump jack market is poised for robust expansion, projected to reach a valuation of $5.5 billion in 2025, with a compelling compound annual growth rate (CAGR) of 6.15% through 2033. This sustained growth is primarily fueled by the ever-increasing global demand for oil and gas, necessitating efficient and reliable artificial lift solutions. Key drivers include the ongoing exploration and production activities in both mature and emerging oilfields, particularly those requiring enhanced oil recovery techniques. The market is also benefiting from technological advancements in pump jack design, leading to improved efficiency, reduced operational costs, and greater durability. Innovations such as variable frequency drives (VFDs) for optimized speed control, intelligent monitoring systems for predictive maintenance, and the development of lighter, more robust materials are contributing to market dynamism. Furthermore, the strategic importance of onshore operations, coupled with the increasing complexity and scale of offshore projects, creates a dual-pronged demand for diverse pump jack solutions.
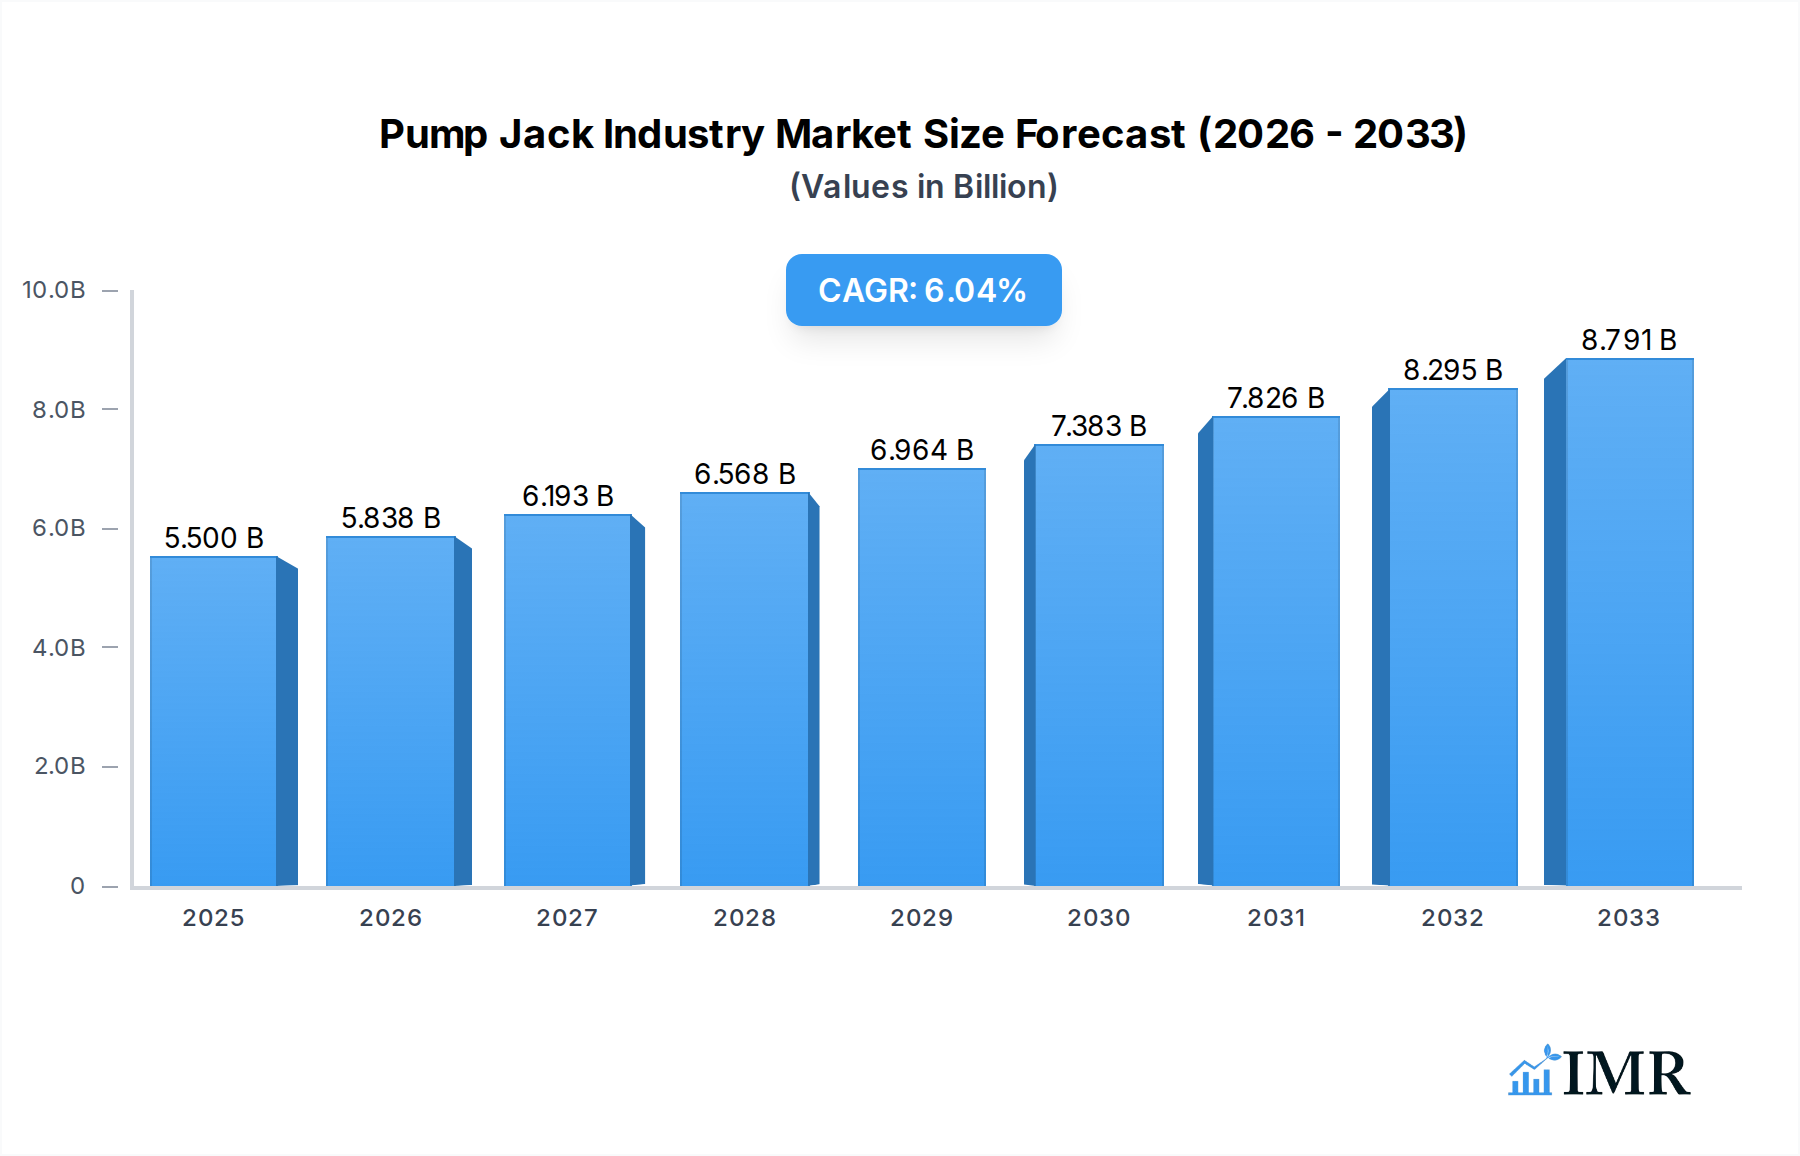
Pump Jack Industry Market Size (In Billion)
The pump jack market segmentation by type reveals a strong preference for both vertical and horizontal well applications, reflecting the diverse geological formations and extraction strategies employed worldwide. While onshore operations dominate in terms of volume and accessibility, offshore applications, despite their higher initial investment, are gaining traction due to the discovery of vast deep-water reserves. The competitive landscape is characterized by the presence of established global players like Schlumberger Limited, Baker Hughes Company, and Halliburton Company, alongside specialized manufacturers. These companies are actively investing in research and development to offer integrated solutions that encompass installation, maintenance, and digital monitoring services. However, the market faces certain restraints, including stringent environmental regulations in some regions and the inherent volatility of oil prices, which can impact upstream investment decisions. Despite these challenges, the projected growth trajectory indicates a resilient market driven by the fundamental need for hydrocarbon extraction to meet global energy requirements.

Pump Jack Industry Company Market Share
Pump Jack Industry: Global Market Dynamics, Growth Trends, and Future Outlook (2019-2033)
This comprehensive report offers an in-depth analysis of the global Pump Jack Industry, providing critical insights for stakeholders across the upstream oil and gas sector. Covering the historical period from 2019 to 2024, the base year of 2025, and a robust forecast period extending to 2033, this report details market size, growth drivers, regional dominance, technological advancements, and competitive landscapes. With a focus on both parent and child markets, we deliver actionable intelligence to inform strategic decision-making and capitalize on emerging opportunities.
Pump Jack Industry Market Dynamics & Structure
The global Pump Jack Industry exhibits a moderately concentrated market structure, characterized by a mix of established multinational corporations and emerging regional players. Technological innovation is a significant driver, with ongoing advancements in artificial lift technologies, automation, and predictive maintenance aimed at enhancing operational efficiency and reducing downtime. Regulatory frameworks, particularly concerning environmental standards and safety protocols, play a crucial role in shaping market entry and operational practices. Competitive product substitutes, such as electric submersible pumps (ESPs) and progressing cavity pumps (PCPs), exert pressure on traditional pump jack systems, especially in specific well conditions. End-user demographics are primarily driven by the global demand for crude oil, with production needs dictating the installation and maintenance of pump jacks. Mergers and acquisitions (M&A) trends indicate consolidation among key players seeking to expand their product portfolios, geographical reach, and technological capabilities. For instance, several strategic acquisitions have focused on integrating digital solutions and advanced analytics into pump jack operations.
- Market Concentration: Moderately concentrated with a few key global players holding significant market share.
- Technological Innovation Drivers: Automation, digital twin technology, AI-powered diagnostics, energy efficiency improvements, remote monitoring.
- Regulatory Frameworks: Evolving environmental regulations, safety standards, and emissions controls.
- Competitive Product Substitutes: Electric Submersible Pumps (ESPs), Progressing Cavity Pumps (PCPs), gas lift systems.
- End-User Demographics: Oil and gas exploration and production (E&P) companies, national oil companies (NOCs).
- M&A Trends: Strategic acquisitions focused on technology integration, market expansion, and portfolio diversification.
Pump Jack Industry Growth Trends & Insights
The Pump Jack Industry is poised for steady growth driven by the persistent global demand for crude oil and the continued reliance on artificial lift systems in mature oil fields. The global market size for pump jacks is projected to reach approximately $12.5 billion by 2033, exhibiting a Compound Annual Growth Rate (CAGR) of around 3.8% from the base year of 2025. Adoption rates are expected to remain robust, particularly in onshore applications where pump jacks are the most prevalent artificial lift method for conventional oil production. Technological disruptions are shaping the market, with increasing integration of Internet of Things (IoT) sensors, advanced analytics, and artificial intelligence (AI) for real-time monitoring, predictive maintenance, and optimized performance. This shift towards smarter, more efficient pump jack systems addresses the industry's imperative to reduce operational costs and improve production output. Consumer behavior shifts, influenced by the energy transition, are also indirectly impacting the market. While the focus is on renewables, the continued necessity of fossil fuels for the foreseeable future ensures sustained demand for conventional production methods, including pump jacks. The market penetration of advanced, digitized pump jack solutions is expected to accelerate as operators seek to maximize the efficiency and longevity of existing infrastructure.
- Market Size Evolution: The global pump jack market is anticipated to grow from an estimated $10.1 billion in 2025 to approximately $12.5 billion by 2033.
- CAGR: An estimated CAGR of 3.8% from 2025 to 2033.
- Adoption Rates: Strong adoption in onshore conventional oil production, with increasing demand for advanced and digitalized solutions.
- Technological Disruptions: Integration of IoT, AI, predictive maintenance, and automation for enhanced operational efficiency.
- Consumer Behavior Shifts: Indirect influence through sustained demand for crude oil amidst the energy transition.
- Market Penetration: Increasing penetration of smart pump jack systems driven by cost reduction and efficiency gains.
- Key Growth Metrics: Projected market value, CAGR, and adoption trends for both traditional and advanced pump jack systems.
Dominant Regions, Countries, or Segments in Pump Jack Industry
The Onshore application segment is the dominant force driving growth within the global Pump Jack Industry, accounting for an estimated 75% of the total market value in 2025. This dominance is primarily attributed to the vast number of conventional oil wells worldwide that rely on pump jacks for artificial lift. Within this segment, Vertical Well applications hold a significant share, reflecting the historical prevalence of vertical drilling in oil exploration. However, the market is witnessing a steady increase in Horizontal Well applications, particularly in unconventional resource plays, which are increasingly adopting pump jacks as a viable artificial lift solution.
North America, particularly the United States, is the leading region, driven by its extensive onshore oil production, a mature market for artificial lift technologies, and significant investments in enhanced oil recovery (EOR) techniques. The presence of major oilfields and a robust upstream oil and gas industry, coupled with favorable economic policies and established infrastructure, contributes to this regional dominance. Key drivers include the shale revolution, which, despite the shift towards horizontal drilling, still requires efficient artificial lift to maintain production levels, and the continuous need to optimize production from mature conventional fields. The region's commitment to technological innovation and the adoption of advanced pump jack solutions further bolster its market leadership.
- Dominant Application Segment: Onshore applications, expected to hold over 75% of the market share in 2025, driven by conventional oil production.
- Dominant Well Type: Vertical Well applications are leading, but Horizontal Well applications are showing significant growth potential.
- Leading Region: North America, with the United States as a key market.
- Key Drivers in North America: Mature onshore production, extensive EOR activities, shale oil production requiring efficient lift, technological innovation, and supportive economic policies.
- Growth Potential in Horizontal Wells: Increasing adoption of pump jacks for horizontal well production, particularly in unconventional plays.
- Market Share & Growth Potential: North America is projected to maintain its leading position with a substantial market share and steady growth due to ongoing production optimization efforts.
Pump Jack Industry Product Landscape
The product landscape of the Pump Jack Industry is characterized by continuous innovation focused on enhancing efficiency, reliability, and operational intelligence. Modern pump jacks incorporate advanced materials for increased durability and reduced wear, alongside sophisticated control systems that enable precise stroke adjustments and variable speed operations. Innovations such as integrated sensors for real-time performance monitoring, vibration analysis, and lubricant condition tracking are becoming standard, facilitating predictive maintenance and minimizing costly downtime. Furthermore, advancements in energy efficiency, including optimized gearbox designs and reduced power consumption, are key selling points. The integration of digital technologies, such as remote diagnostics and cloud-based data analytics, allows for remote operation and performance optimization, catering to the evolving needs of oilfield operators seeking smarter, more connected artificial lift solutions.
Key Drivers, Barriers & Challenges in Pump Jack Industry
Key Drivers:
- Sustained Global Oil Demand: Continued reliance on crude oil for energy and petrochemicals necessitates efficient extraction methods.
- Aging Oil Fields: Mature fields require reliable artificial lift systems like pump jacks to maintain production levels.
- Technological Advancements: Innovations in automation, digital monitoring, and energy efficiency enhance operational viability.
- Cost-Effectiveness: Pump jacks offer a relatively economical artificial lift solution for many well types.
- Onshore Production Growth: Ongoing exploration and development in onshore basins drive demand.
Barriers & Challenges:
- Volatility in Oil Prices: Fluctuations in crude oil prices directly impact upstream investment and demand for new equipment.
- Energy Transition Concerns: Increasing focus on renewable energy sources creates long-term uncertainty for fossil fuel infrastructure.
- Competition from Alternative Lift Methods: ESPs and PCPs offer viable alternatives in specific operational conditions.
- Environmental Regulations: Stricter environmental standards can increase operational costs and necessitate compliance upgrades.
- Supply Chain Disruptions: Global events can impact the availability of raw materials and components, leading to production delays and increased costs.
- Skilled Labor Shortages: A lack of experienced technicians for installation, maintenance, and operation can hinder growth.
Emerging Opportunities in Pump Jack Industry
Emerging opportunities in the Pump Jack Industry lie in the expansion of smart pump jack technologies, offering enhanced predictive maintenance capabilities through IoT integration and AI-driven analytics. This allows for reduced downtime and optimized production, particularly attractive to operators looking to maximize output from existing assets. Furthermore, there is a growing demand for pump jack solutions designed for increasingly challenging environments, including deeper wells and those with higher viscosity or corrosive fluids. The potential for retrofitting existing pump jack infrastructure with advanced digital components presents a significant market opportunity. Untapped markets in regions with developing oil and gas sectors, where conventional production is being prioritized, also offer substantial growth prospects.
Growth Accelerators in the Pump Jack Industry Industry
The long-term growth of the Pump Jack Industry will be significantly accelerated by sustained investment in research and development for more energy-efficient designs and advanced materials that extend equipment lifespan. Strategic partnerships between pump jack manufacturers, technology providers (especially in IoT and AI), and oilfield service companies will foster integrated solutions that enhance operational efficiency and reduce total cost of ownership. Market expansion strategies focusing on developing economies with significant onshore potential, coupled with the adoption of modular and easily deployable pump jack systems, will also act as key growth accelerators. The continuous need to optimize production from mature fields, even in the context of energy transition, will ensure a baseline demand that smart technologies can further leverage.
Key Players Shaping the Pump Jack Industry Market
- Weil-McLain (Shandong) Cast-Iron-Boiler Co Ltd
- Flotek Industries Inc
- Alkhorayef Commercial Co
- Baker Hughes Company
- Halliburton Company
- National-Oilwell Varco Inc
- Borets International Ltd
- Weatherford International Ltd
- Schlumberger Limited
- Dover Corp
Notable Milestones in Pump Jack Industry Sector
- 2020: Increased adoption of remote monitoring and control systems due to global health challenges, driving demand for connected pump jack solutions.
- 2021: Significant investments in AI-powered predictive maintenance algorithms to reduce unplanned downtime in oilfields.
- 2022: Launch of new lightweight and corrosion-resistant materials for pump jack components to enhance durability in harsh environments.
- 2023: Growing emphasis on energy-efficient pump jack designs to reduce operational costs and environmental footprint.
- 2024 (Q1): Major acquisitions aimed at consolidating digital technology offerings within the artificial lift sector.
In-Depth Pump Jack Industry Market Outlook
The future market outlook for the Pump Jack Industry remains positive, underpinned by the ongoing global demand for crude oil and the critical role of artificial lift in maintaining production from existing and new onshore wells. Growth accelerators such as relentless technological innovation, particularly in digitization and automation, will continue to enhance the efficiency and cost-effectiveness of pump jack operations. Strategic partnerships and market expansion into emerging oil-producing regions will broaden the industry's reach. While the energy transition presents long-term challenges, the immediate and medium-term outlook highlights the sustained necessity for reliable and optimized conventional oil extraction methods, ensuring a robust demand for advanced pump jack solutions. The industry is well-positioned to leverage these trends for continued growth and profitability.
Pump Jack Industry Segmentation
-
1. Type
- 1.1. Vertical Well
- 1.2. Horizontal Well
-
2. Application
- 2.1. Offshore
- 2.2. Onshore
Pump Jack Industry Segmentation By Geography
- 1. North America
- 2. Asia Pacific
- 3. Europe
- 4. South America
- 5. Middle East and Africa
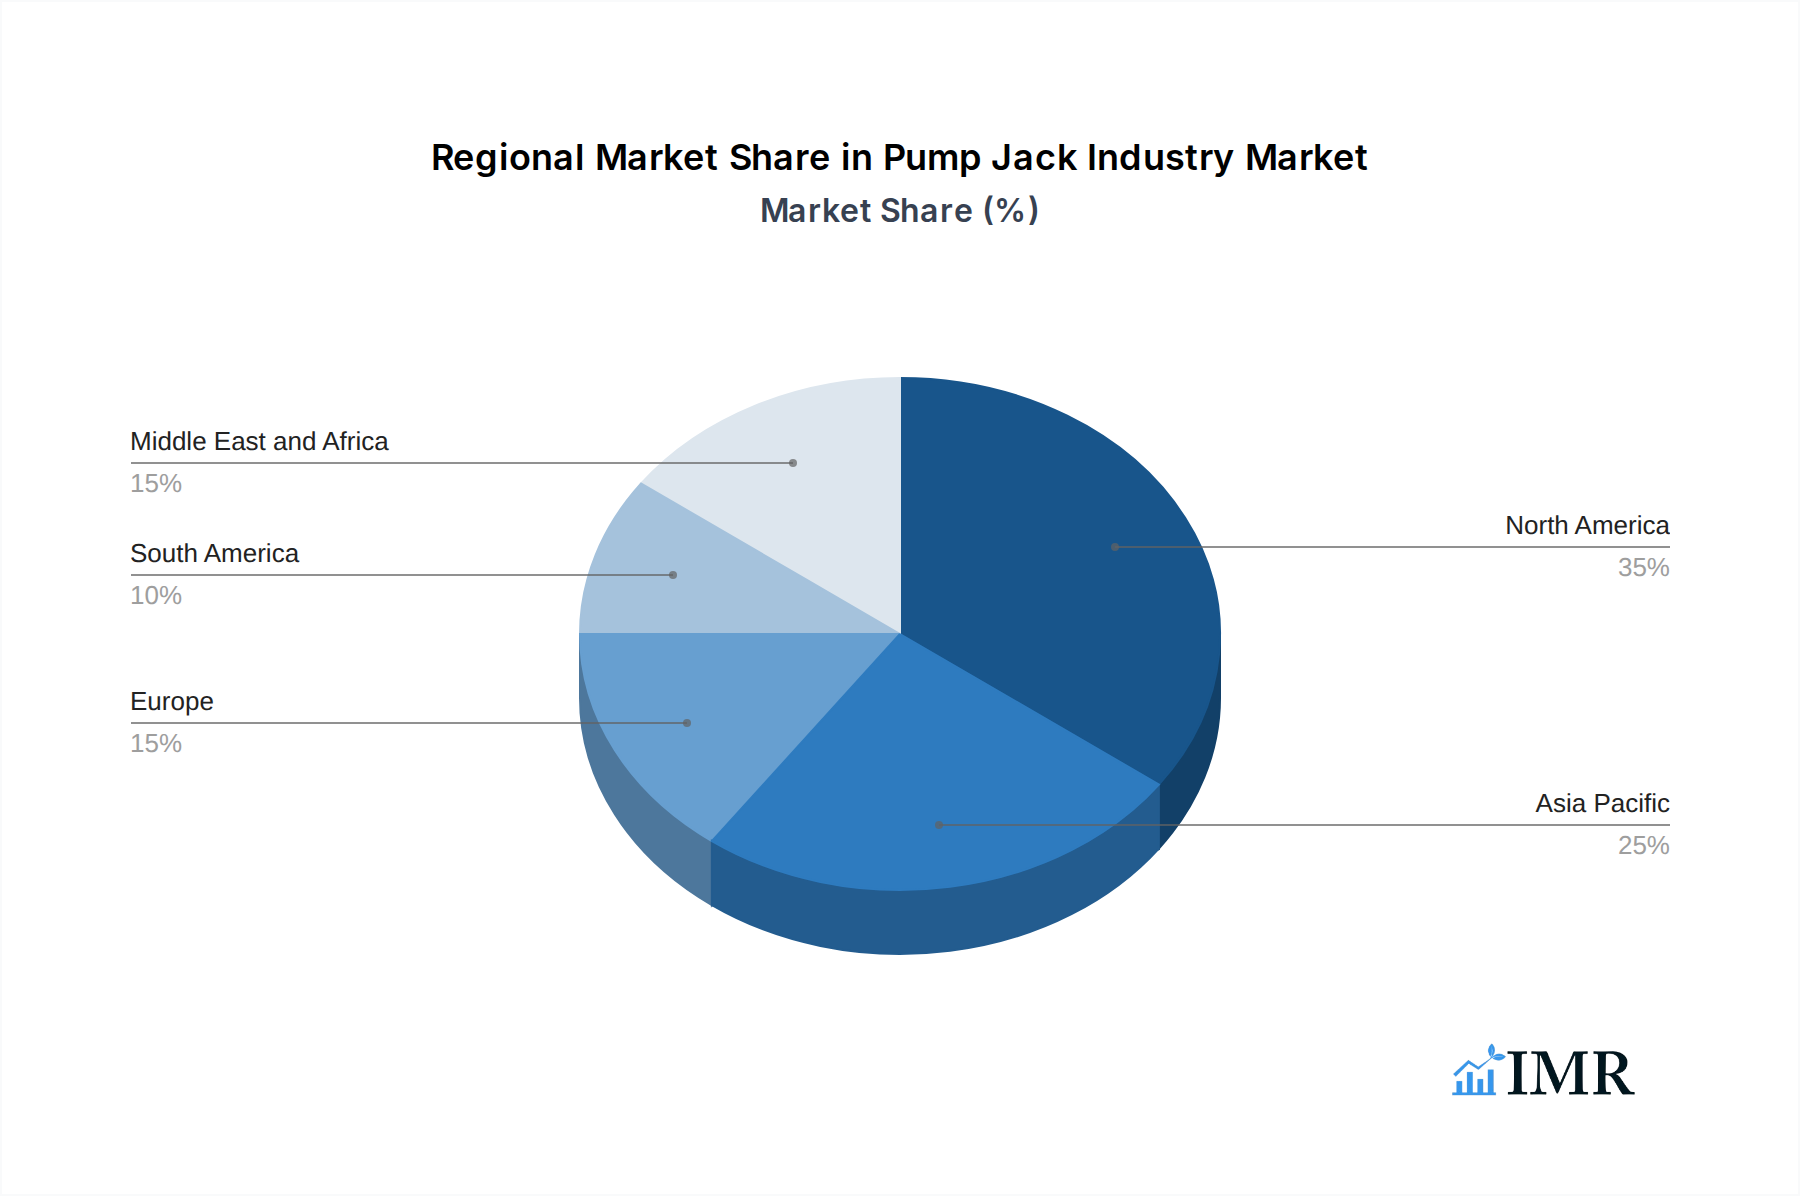
Pump Jack Industry Regional Market Share
Geographic Coverage of Pump Jack Industry
Pump Jack Industry REPORT HIGHLIGHTS
| Aspects | Details |
|---|---|
| Study Period | 2020-2034 |
| Base Year | 2025 |
| Estimated Year | 2026 |
| Forecast Period | 2026-2034 |
| Historical Period | 2020-2025 |
| Growth Rate | CAGR of 5.7% from 2020-2034 |
| Segmentation |
|
Table of Contents
- 1. Introduction
- 1.1. Research Scope
- 1.2. Market Segmentation
- 1.3. Research Objective
- 1.4. Definitions and Assumptions
- 2. Executive Summary
- 2.1. Market Snapshot
- 3. Market Dynamics
- 3.1. Market Drivers
- 3.2. Market Restrains
- 3.3. Market Trends
- 3.4. Market Opportunities
- 4. Market Factor Analysis
- 4.1. Porters Five Forces
- 4.1.1. Bargaining Power of Suppliers
- 4.1.2. Bargaining Power of Buyers
- 4.1.3. Threat of New Entrants
- 4.1.4. Threat of Substitutes
- 4.1.5. Competitive Rivalry
- 4.2. PESTEL analysis
- 4.3. BCG Analysis
- 4.3.1. Stars (High Growth, High Market Share)
- 4.3.2. Cash Cows (Low Growth, High Market Share)
- 4.3.3. Question Mark (High Growth, Low Market Share)
- 4.3.4. Dogs (Low Growth, Low Market Share)
- 4.4. Ansoff Matrix Analysis
- 4.5. Supply Chain Analysis
- 4.6. Regulatory Landscape
- 4.7. Current Market Potential and Opportunity Assessment (TAM–SAM–SOM Framework)
- 4.8. IMR Analyst Note
- 4.1. Porters Five Forces
- 5. Market Analysis, Insights and Forecast 2021-2033
- 5.1. Market Analysis, Insights and Forecast - by Type
- 5.1.1. Vertical Well
- 5.1.2. Horizontal Well
- 5.2. Market Analysis, Insights and Forecast - by Application
- 5.2.1. Offshore
- 5.2.2. Onshore
- 5.3. Market Analysis, Insights and Forecast - by Region
- 5.3.1. North America
- 5.3.2. Asia Pacific
- 5.3.3. Europe
- 5.3.4. South America
- 5.3.5. Middle East and Africa
- 5.1. Market Analysis, Insights and Forecast - by Type
- 6. Global Pump Jack Industry Analysis, Insights and Forecast, 2021-2033
- 6.1. Market Analysis, Insights and Forecast - by Type
- 6.1.1. Vertical Well
- 6.1.2. Horizontal Well
- 6.2. Market Analysis, Insights and Forecast - by Application
- 6.2.1. Offshore
- 6.2.2. Onshore
- 6.1. Market Analysis, Insights and Forecast - by Type
- 7. North America Pump Jack Industry Analysis, Insights and Forecast, 2020-2032
- 7.1. Market Analysis, Insights and Forecast - by Type
- 7.1.1. Vertical Well
- 7.1.2. Horizontal Well
- 7.2. Market Analysis, Insights and Forecast - by Application
- 7.2.1. Offshore
- 7.2.2. Onshore
- 7.1. Market Analysis, Insights and Forecast - by Type
- 8. Asia Pacific Pump Jack Industry Analysis, Insights and Forecast, 2020-2032
- 8.1. Market Analysis, Insights and Forecast - by Type
- 8.1.1. Vertical Well
- 8.1.2. Horizontal Well
- 8.2. Market Analysis, Insights and Forecast - by Application
- 8.2.1. Offshore
- 8.2.2. Onshore
- 8.1. Market Analysis, Insights and Forecast - by Type
- 9. Europe Pump Jack Industry Analysis, Insights and Forecast, 2020-2032
- 9.1. Market Analysis, Insights and Forecast - by Type
- 9.1.1. Vertical Well
- 9.1.2. Horizontal Well
- 9.2. Market Analysis, Insights and Forecast - by Application
- 9.2.1. Offshore
- 9.2.2. Onshore
- 9.1. Market Analysis, Insights and Forecast - by Type
- 10. South America Pump Jack Industry Analysis, Insights and Forecast, 2020-2032
- 10.1. Market Analysis, Insights and Forecast - by Type
- 10.1.1. Vertical Well
- 10.1.2. Horizontal Well
- 10.2. Market Analysis, Insights and Forecast - by Application
- 10.2.1. Offshore
- 10.2.2. Onshore
- 10.1. Market Analysis, Insights and Forecast - by Type
- 11. Middle East and Africa Pump Jack Industry Analysis, Insights and Forecast, 2020-2032
- 11.1. Market Analysis, Insights and Forecast - by Type
- 11.1.1. Vertical Well
- 11.1.2. Horizontal Well
- 11.2. Market Analysis, Insights and Forecast - by Application
- 11.2.1. Offshore
- 11.2.2. Onshore
- 11.1. Market Analysis, Insights and Forecast - by Type
- 12. Competitive Analysis
- 12.1. Company Profiles
- 12.1.1 Weil-McLain (Shandong) Cast-Iron-Boiler Co Ltd
- 12.1.1.1. Company Overview
- 12.1.1.2. Products
- 12.1.1.3. Company Financials
- 12.1.1.4. SWOT Analysis
- 12.1.2 Flotek Industries Inc
- 12.1.2.1. Company Overview
- 12.1.2.2. Products
- 12.1.2.3. Company Financials
- 12.1.2.4. SWOT Analysis
- 12.1.3 Alkhorayef Commercial Co
- 12.1.3.1. Company Overview
- 12.1.3.2. Products
- 12.1.3.3. Company Financials
- 12.1.3.4. SWOT Analysis
- 12.1.4 Baker Hughes Company
- 12.1.4.1. Company Overview
- 12.1.4.2. Products
- 12.1.4.3. Company Financials
- 12.1.4.4. SWOT Analysis
- 12.1.5 Halliburton Company
- 12.1.5.1. Company Overview
- 12.1.5.2. Products
- 12.1.5.3. Company Financials
- 12.1.5.4. SWOT Analysis
- 12.1.6 National-Oilwell Varco Inc
- 12.1.6.1. Company Overview
- 12.1.6.2. Products
- 12.1.6.3. Company Financials
- 12.1.6.4. SWOT Analysis
- 12.1.7 Borets International Ltd
- 12.1.7.1. Company Overview
- 12.1.7.2. Products
- 12.1.7.3. Company Financials
- 12.1.7.4. SWOT Analysis
- 12.1.8 Weatherford International Ltd
- 12.1.8.1. Company Overview
- 12.1.8.2. Products
- 12.1.8.3. Company Financials
- 12.1.8.4. SWOT Analysis
- 12.1.9 Schlumberger Limited
- 12.1.9.1. Company Overview
- 12.1.9.2. Products
- 12.1.9.3. Company Financials
- 12.1.9.4. SWOT Analysis
- 12.1.10 Dover Corp
- 12.1.10.1. Company Overview
- 12.1.10.2. Products
- 12.1.10.3. Company Financials
- 12.1.10.4. SWOT Analysis
- 12.1.1 Weil-McLain (Shandong) Cast-Iron-Boiler Co Ltd
- 12.2. Market Entropy
- 12.2.1 Company's Key Areas Served
- 12.2.2 Recent Developments
- 12.3. Company Market Share Analysis 2025
- 12.3.1 Top 5 Companies Market Share Analysis
- 12.3.2 Top 3 Companies Market Share Analysis
- 12.4. List of Potential Customers
- 13. Research Methodology
List of Figures
- Figure 1: Global Pump Jack Industry Revenue Breakdown (million, %) by Region 2025 & 2033
- Figure 2: North America Pump Jack Industry Revenue (million), by Type 2025 & 2033
- Figure 3: North America Pump Jack Industry Revenue Share (%), by Type 2025 & 2033
- Figure 4: North America Pump Jack Industry Revenue (million), by Application 2025 & 2033
- Figure 5: North America Pump Jack Industry Revenue Share (%), by Application 2025 & 2033
- Figure 6: North America Pump Jack Industry Revenue (million), by Country 2025 & 2033
- Figure 7: North America Pump Jack Industry Revenue Share (%), by Country 2025 & 2033
- Figure 8: Asia Pacific Pump Jack Industry Revenue (million), by Type 2025 & 2033
- Figure 9: Asia Pacific Pump Jack Industry Revenue Share (%), by Type 2025 & 2033
- Figure 10: Asia Pacific Pump Jack Industry Revenue (million), by Application 2025 & 2033
- Figure 11: Asia Pacific Pump Jack Industry Revenue Share (%), by Application 2025 & 2033
- Figure 12: Asia Pacific Pump Jack Industry Revenue (million), by Country 2025 & 2033
- Figure 13: Asia Pacific Pump Jack Industry Revenue Share (%), by Country 2025 & 2033
- Figure 14: Europe Pump Jack Industry Revenue (million), by Type 2025 & 2033
- Figure 15: Europe Pump Jack Industry Revenue Share (%), by Type 2025 & 2033
- Figure 16: Europe Pump Jack Industry Revenue (million), by Application 2025 & 2033
- Figure 17: Europe Pump Jack Industry Revenue Share (%), by Application 2025 & 2033
- Figure 18: Europe Pump Jack Industry Revenue (million), by Country 2025 & 2033
- Figure 19: Europe Pump Jack Industry Revenue Share (%), by Country 2025 & 2033
- Figure 20: South America Pump Jack Industry Revenue (million), by Type 2025 & 2033
- Figure 21: South America Pump Jack Industry Revenue Share (%), by Type 2025 & 2033
- Figure 22: South America Pump Jack Industry Revenue (million), by Application 2025 & 2033
- Figure 23: South America Pump Jack Industry Revenue Share (%), by Application 2025 & 2033
- Figure 24: South America Pump Jack Industry Revenue (million), by Country 2025 & 2033
- Figure 25: South America Pump Jack Industry Revenue Share (%), by Country 2025 & 2033
- Figure 26: Middle East and Africa Pump Jack Industry Revenue (million), by Type 2025 & 2033
- Figure 27: Middle East and Africa Pump Jack Industry Revenue Share (%), by Type 2025 & 2033
- Figure 28: Middle East and Africa Pump Jack Industry Revenue (million), by Application 2025 & 2033
- Figure 29: Middle East and Africa Pump Jack Industry Revenue Share (%), by Application 2025 & 2033
- Figure 30: Middle East and Africa Pump Jack Industry Revenue (million), by Country 2025 & 2033
- Figure 31: Middle East and Africa Pump Jack Industry Revenue Share (%), by Country 2025 & 2033
List of Tables
- Table 1: Global Pump Jack Industry Revenue million Forecast, by Type 2020 & 2033
- Table 2: Global Pump Jack Industry Revenue million Forecast, by Application 2020 & 2033
- Table 3: Global Pump Jack Industry Revenue million Forecast, by Region 2020 & 2033
- Table 4: Global Pump Jack Industry Revenue million Forecast, by Type 2020 & 2033
- Table 5: Global Pump Jack Industry Revenue million Forecast, by Application 2020 & 2033
- Table 6: Global Pump Jack Industry Revenue million Forecast, by Country 2020 & 2033
- Table 7: Global Pump Jack Industry Revenue million Forecast, by Type 2020 & 2033
- Table 8: Global Pump Jack Industry Revenue million Forecast, by Application 2020 & 2033
- Table 9: Global Pump Jack Industry Revenue million Forecast, by Country 2020 & 2033
- Table 10: Global Pump Jack Industry Revenue million Forecast, by Type 2020 & 2033
- Table 11: Global Pump Jack Industry Revenue million Forecast, by Application 2020 & 2033
- Table 12: Global Pump Jack Industry Revenue million Forecast, by Country 2020 & 2033
- Table 13: Global Pump Jack Industry Revenue million Forecast, by Type 2020 & 2033
- Table 14: Global Pump Jack Industry Revenue million Forecast, by Application 2020 & 2033
- Table 15: Global Pump Jack Industry Revenue million Forecast, by Country 2020 & 2033
- Table 16: Global Pump Jack Industry Revenue million Forecast, by Type 2020 & 2033
- Table 17: Global Pump Jack Industry Revenue million Forecast, by Application 2020 & 2033
- Table 18: Global Pump Jack Industry Revenue million Forecast, by Country 2020 & 2033
Frequently Asked Questions
1. What is the projected Compound Annual Growth Rate (CAGR) of the Pump Jack Industry?
The projected CAGR is approximately 5.7%.
2. Which companies are prominent players in the Pump Jack Industry?
Key companies in the market include Weil-McLain (Shandong) Cast-Iron-Boiler Co Ltd, Flotek Industries Inc, Alkhorayef Commercial Co, Baker Hughes Company, Halliburton Company, National-Oilwell Varco Inc, Borets International Ltd, Weatherford International Ltd, Schlumberger Limited, Dover Corp.
3. What are the main segments of the Pump Jack Industry?
The market segments include Type, Application.
4. Can you provide details about the market size?
The market size is estimated to be USD 3687.6 million as of 2022.
5. What are some drivers contributing to market growth?
4.; Focus On Unconventional Resources4.; Global Energy Demand And Exploration Activities.
6. What are the notable trends driving market growth?
Onshore Application to Dominate the Market.
7. Are there any restraints impacting market growth?
4.; High Implementation Costs.
8. Can you provide examples of recent developments in the market?
N/A
9. What pricing options are available for accessing the report?
Pricing options include single-user, multi-user, and enterprise licenses priced at USD 4750, USD 5250, and USD 8750 respectively.
10. Is the market size provided in terms of value or volume?
The market size is provided in terms of value, measured in million.
11. Are there any specific market keywords associated with the report?
Yes, the market keyword associated with the report is "Pump Jack Industry," which aids in identifying and referencing the specific market segment covered.
12. How do I determine which pricing option suits my needs best?
The pricing options vary based on user requirements and access needs. Individual users may opt for single-user licenses, while businesses requiring broader access may choose multi-user or enterprise licenses for cost-effective access to the report.
13. Are there any additional resources or data provided in the Pump Jack Industry report?
While the report offers comprehensive insights, it's advisable to review the specific contents or supplementary materials provided to ascertain if additional resources or data are available.
14. How can I stay updated on further developments or reports in the Pump Jack Industry?
To stay informed about further developments, trends, and reports in the Pump Jack Industry, consider subscribing to industry newsletters, following relevant companies and organizations, or regularly checking reputable industry news sources and publications.
Methodology
Step 1 - Identification of Relevant Samples Size from Population Database


Step 2 - Approaches for Defining Global Market Size (Value, Volume* & Price*)

Note*: In applicable scenarios
Step 3 - Data Sources
Primary Research
- Web Analytics
- Survey Reports
- Research Institute
- Latest Research Reports
- Opinion Leaders
Secondary Research
- Annual Reports
- White Paper
- Latest Press Release
- Industry Association
- Paid Database
- Investor Presentations

Step 4 - Data Triangulation
Involves using different sources of information in order to increase the validity of a study
These sources are likely to be stakeholders in a program - participants, other researchers, program staff, other community members, and so on.
Then we put all data in single framework & apply various statistical tools to find out the dynamic on the market.
During the analysis stage, feedback from the stakeholder groups would be compared to determine areas of agreement as well as areas of divergence