

Key Insights
The global Flue Gas Desulfurization (FGD) Systems market is poised for substantial expansion, projected to reach USD 9.55 billion in 2025, driven by a robust Compound Annual Growth Rate (CAGR) of 13.06% during the forecast period of 2025-2033. This remarkable growth is primarily fueled by increasingly stringent environmental regulations worldwide, compelling industries to adopt advanced pollution control technologies to mitigate sulfur dioxide (SO2) emissions, a major contributor to acid rain and respiratory illnesses. The escalating demand for cleaner energy sources and the growing industrialization across emerging economies are further propelling the adoption of FGD systems. Key drivers include governmental mandates for emission reduction, public awareness campaigns highlighting the health and environmental impacts of air pollution, and technological advancements leading to more efficient and cost-effective FGD solutions. The market's trajectory is strongly influenced by the global commitment to sustainable development and the urgent need to improve air quality, particularly in densely industrialized regions.
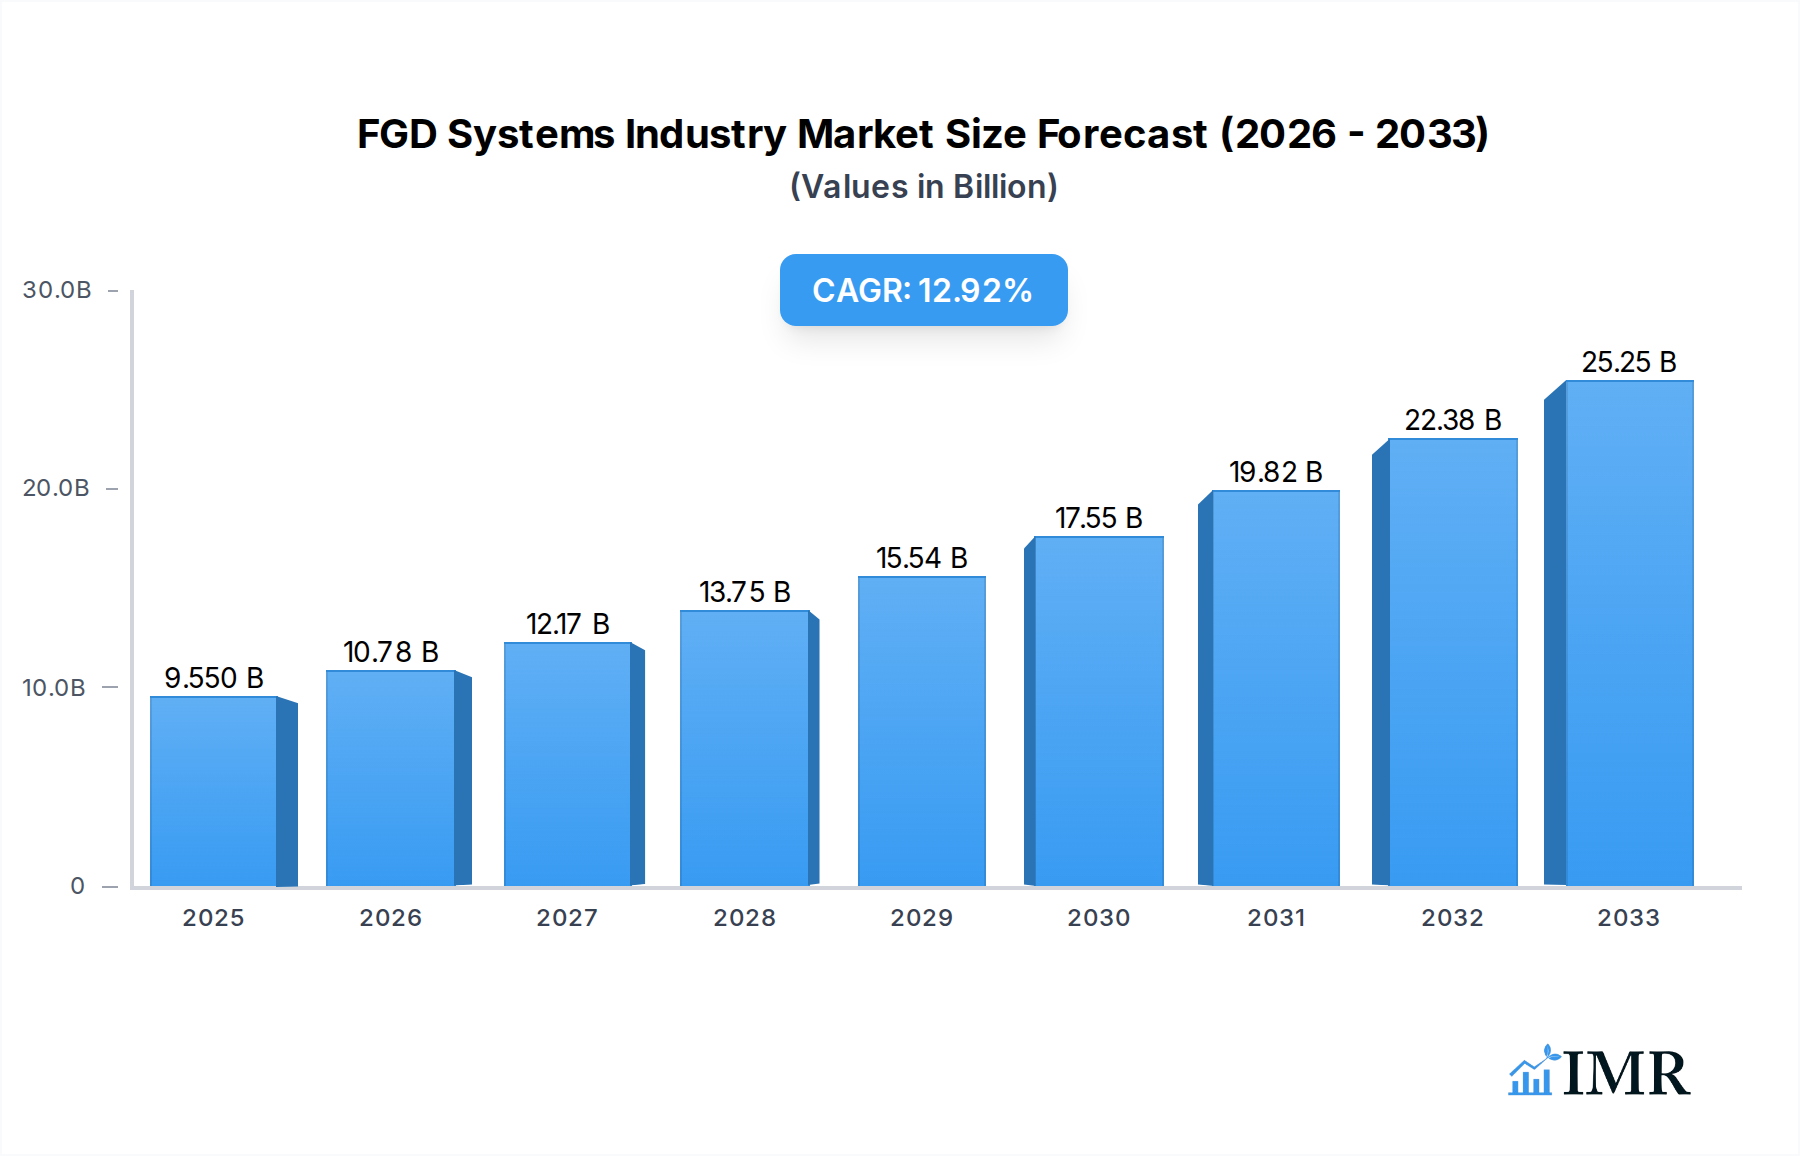
FGD Systems Industry Market Size (In Billion)
The FGD Systems market is segmented into Dry FGD and Wet FGD types, with Wet FGD systems currently dominating due to their high removal efficiency, especially for large-scale applications. End-user industries like Power Generation, Cement, Chemical, and Iron & Steel are the primary consumers of these systems, with the Power Generation sector leading the demand due to its significant contribution to SO2 emissions. However, the growth in other sectors like cement and chemical manufacturing, driven by increased production volumes and stricter environmental controls, is also noteworthy. Geographically, Asia Pacific is emerging as a dominant region, propelled by rapid industrialization, favorable government policies promoting environmental protection, and a substantial installed base of power plants. North America and Europe, with their well-established regulatory frameworks and focus on retrofitting existing facilities, also represent significant market shares. Restraints, such as the high initial capital investment and operational costs associated with FGD systems, as well as the availability of alternative emission control technologies, are being progressively addressed through technological innovations and government incentives, ensuring a positive market outlook.

FGD Systems Industry Company Market Share
Report Description: Global FGD Systems Industry Analysis 2019-2033
Unlock critical insights into the FGD Systems Industry with our comprehensive market report. This in-depth analysis, spanning from 2019 to 2033, offers a detailed examination of market dynamics, growth trends, and competitive landscapes. We delve into the parent market of industrial pollution control and the child markets of specific FGD technologies, providing unparalleled strategic intelligence. This report is an essential resource for stakeholders, including manufacturers, investors, and regulatory bodies, seeking to navigate the evolving flue gas desulfurization systems market and capitalize on emerging opportunities.
FGD Systems Industry Market Dynamics & Structure
The FGD Systems Industry is characterized by a moderately concentrated market structure, with a blend of large multinational corporations and specialized regional players. Technological innovation is a primary driver, spurred by increasingly stringent environmental regulations worldwide, particularly concerning sulfur dioxide (SO2) emissions from industrial processes. The dominance of Wet FGD systems is notable due to their higher efficiency in SO2 removal, though Dry FGD systems are gaining traction for their lower water consumption and operational costs. Regulatory frameworks, such as emissions standards set by environmental protection agencies and international climate accords, directly influence market demand and the adoption of advanced FGD technologies. Competitive product substitutes, while limited for core SO2 removal, include alternative pollution control methods and shifts towards cleaner energy sources. End-user demographics are heavily skewed towards the Power Generation sector, followed by Cement, Iron and Steel, and Chemical industries. Mergers and Acquisitions (M&A) activity is a significant trend, reflecting a consolidation drive and efforts to acquire innovative technologies or expand market reach.
- Market Concentration: Moderate, with key players holding significant but not overwhelming market shares.
- Technological Innovation Drivers: Stringent SO2 emission regulations, demand for higher efficiency, and cost-effective solutions.
- Regulatory Frameworks: Influenced by national environmental protection laws and international climate agreements.
- Competitive Product Substitutes: Limited for direct SO2 removal, but overall shifts in industrial processes and energy sources.
- End-User Demographics: Dominated by Power Generation, followed by Cement, Iron & Steel, and Chemical industries.
- M&A Trends: Increasing consolidation, strategic acquisitions for technology enhancement and market expansion.
FGD Systems Industry Growth Trends & Insights
The FGD Systems Industry is poised for robust growth, driven by an escalating global focus on air quality and emissions reduction. The market size is projected to expand significantly, with a projected Compound Annual Growth Rate (CAGR) of approximately 5.2% from 2025 to 2033. This growth is underpinned by increasing industrialization in emerging economies and the continuous need for compliance with evolving environmental standards across developed nations. Adoption rates for advanced FGD technologies are accelerating, as industries seek more efficient and cost-effective solutions for SO2 abatement. Technological disruptions, such as the development of more efficient sorbent materials, advanced process controls, and integrated systems for multiple pollutant removal, are reshaping the competitive landscape. Consumer behavior shifts, driven by corporate social responsibility and investor pressure, are pushing industries towards cleaner production methods, thereby boosting demand for sophisticated FGD solutions. The market penetration of FGD systems, particularly in sectors with historically high SO2 emissions, is expected to deepen as retrofit projects and new plant installations incorporate state-of-the-art desulfurization capabilities.
Dominant Regions, Countries, or Segments in FGD Systems Industry
The Power Generation end-user industry stands out as the dominant segment within the global FGD Systems Industry, significantly driving market growth. This dominance is primarily attributed to the substantial volume of SO2 emissions originating from coal-fired and oil-fired power plants, which constitute a major portion of the global energy mix, especially in developing economies. The demand for Wet FGD systems remains paramount within this segment due to their proven high efficiency in removing large quantities of SO2, making them the preferred choice for large-scale power generation facilities.
Regionally, Asia-Pacific is emerging as a powerhouse for FGD system installations and growth. This is fueled by rapid industrial expansion, a strong reliance on coal for power generation, and increasingly stringent environmental regulations being implemented by countries like China and India. Government initiatives promoting cleaner energy and emission control technologies are further accelerating the adoption of FGD systems in this region.
Key drivers in the Power Generation segment and Asia-Pacific region include:
- Economic Policies: Government incentives and mandates for emission control to improve air quality and public health.
- Infrastructure Development: Continued investment in new power plant construction and the retrofitting of existing facilities.
- Regulatory Enforcement: Increasingly stringent SO2 emission limits and penalties for non-compliance.
- Technological Advancements: Adoption of more efficient and cost-effective FGD technologies tailored for large-scale industrial applications.
- Environmental Awareness: Growing public and corporate concern over the environmental impact of industrial emissions.
The market share within the Power Generation segment is substantial, estimated to be over 65% of the total FGD systems market. Growth potential in this segment and region is immense, driven by the ongoing transition towards cleaner industrial practices and the persistent need to manage legacy emission sources effectively.
FGD Systems Industry Product Landscape
The FGD Systems Industry product landscape is defined by continuous innovation focused on enhancing SO2 removal efficiency, reducing operational costs, and minimizing environmental impact. Wet FGD systems, leveraging technologies like limestone-gypsum scrubbing, continue to be the benchmark for high-performance SO2 capture. Innovations in this area include optimized spray nozzle designs, advanced absorber configurations, and improved sorbent handling systems to maximize SO2 absorption and minimize energy consumption. Dry FGD systems, including spray dryer absorbers and dry sorbent injection, are evolving with more effective sorbent materials and improved dust collection mechanisms, offering advantages in lower water usage and easier waste disposal. Performance metrics such as SO2 removal efficiency (often exceeding 95% for wet systems), energy consumption (kW/MWh), sorbent consumption, and byproduct management are key differentiators. Unique selling propositions often revolve around modular designs for easier installation, reduced footprint, and integration capabilities with other pollution control equipment for multi-pollutant remediation.
Key Drivers, Barriers & Challenges in FGD Systems Industry
Key Drivers:
- Stringent Environmental Regulations: Global mandates on SO2 emissions, driven by concerns over acid rain and respiratory health, are the primary growth catalyst.
- Technological Advancements: Innovations in sorbent materials, process optimization, and integration with other pollution controls enhance efficiency and reduce costs.
- Industrial Growth in Emerging Economies: Rapid industrialization, particularly in power generation and heavy industries, necessitates robust emission control solutions.
- Corporate Sustainability Initiatives: Growing pressure from investors and the public for industries to adopt environmentally responsible practices.
Barriers & Challenges:
- High Capital and Operational Costs: The initial investment and ongoing maintenance of FGD systems can be substantial, posing a challenge for smaller enterprises.
- Byproduct Management: Disposal or utilization of byproducts like gypsum or fly ash requires careful planning and compliance with waste management regulations, potentially adding to costs.
- Competition from Alternative Technologies: While FGD is dominant for SO2, increasing adoption of renewable energy sources in power generation can indirectly impact demand for new FGD installations.
- Regulatory Uncertainty and Enforcement Gaps: Inconsistent or delayed enforcement of regulations in some regions can slow down adoption.
- Supply Chain Disruptions: Availability and cost fluctuations of key raw materials like limestone can impact project timelines and profitability.
Emerging Opportunities in FGD Systems Industry
Emerging opportunities in the FGD Systems Industry lie in the development of highly integrated, multi-pollutant control systems that go beyond SO2 removal to also address NOx and particulate matter. The growing demand for carbon capture technologies, often integrated with existing FGD infrastructure, presents a significant future avenue. Furthermore, the circular economy approach is driving innovation in byproduct utilization, with advancements in turning gypsum into valuable construction materials. Untapped markets in developing regions with nascent environmental regulations but rapidly expanding industrial bases represent substantial growth potential. The increasing focus on operational efficiency and energy-saving designs is also creating opportunities for advanced control systems and retrofit solutions for aging industrial plants.
Growth Accelerators in the FGD Systems Industry Industry
Several key catalysts are accelerating growth within the FGD Systems Industry. The continuous evolution and tightening of global SO2 emission standards are undeniable growth accelerators, forcing industries to invest in compliant technologies. Technological breakthroughs in sorbent efficiency and process automation significantly lower the cost-per-ton of SO2 removed, making FGD systems more economically viable. Strategic partnerships between technology providers and large industrial conglomerates are facilitating the development and deployment of customized and scalable solutions. Furthermore, the growing emphasis on retrofitting older industrial facilities with advanced FGD systems, rather than complete plant decommissioning, is a significant market expansion strategy. The increasing focus on sustainability and ESG (Environmental, Social, and Governance) factors by corporations is also a powerful accelerator, driving investment in pollution control technologies.
Key Players Shaping the FGD Systems Industry Market
- Ducon Technologies Inc
- Hamon Corporation
- Mitsubishi Hitachi Power Systems Ltd
- Fujian Longking Co Ltd
- Babcock & Wilcox Enterprises Inc
- Thermax Ltd
- John Wood Group PLC
- Alstom S A
- General Electric Company
- Andritz AG
Notable Milestones in FGD Systems Industry Sector
- 2019: Increased implementation of stricter SO2 emission standards in major industrial nations, driving retrofit projects.
- 2020: Development of advanced sorbent materials with enhanced SO2 absorption capabilities, improving efficiency.
- 2021: Significant growth in the Asia-Pacific region, driven by large-scale power plant construction and emission control mandates.
- 2022: Enhanced focus on byproduct utilization, with increased research into converting gypsum into high-value construction materials.
- 2023: Advancements in integrated pollution control systems, combining SO2 removal with NOx and particulate matter abatement.
- 2024: Growing adoption of digital twin technologies for FGD system optimization and predictive maintenance.
In-Depth FGD Systems Industry Market Outlook
The future outlook for the FGD Systems Industry remains exceptionally positive, driven by an unyielding global commitment to air quality improvement and sustainable industrial practices. Growth accelerators such as increasingly stringent regulatory frameworks and ongoing technological innovations in sorbent chemistry and process design will continue to propel market expansion. Strategic partnerships and the increasing trend of retrofitting existing industrial plants are opening up significant avenues for market penetration. The industry is also well-positioned to capitalize on the growing demand for integrated pollution control solutions and byproduct valorization, transforming waste streams into valuable resources. The global shift towards cleaner energy and industrial processes, coupled with the economic development in emerging markets, ensures a sustained demand for effective FGD systems, making this a critical sector for environmental protection and industrial compliance.
FGD Systems Industry Segmentation
-
1. Type
- 1.1. Dry FGD
- 1.2. Wet FGD
-
2. End-User Industry
- 2.1. Power Generation
- 2.2. Cement
- 2.3. Chemical
- 2.4. Iron and Steel
- 2.5. Other End-User Industries
FGD Systems Industry Segmentation By Geography
- 1. North America
- 2. Europe
- 3. Asia Pacific
- 4. South America
- 5. Middle East and Africa
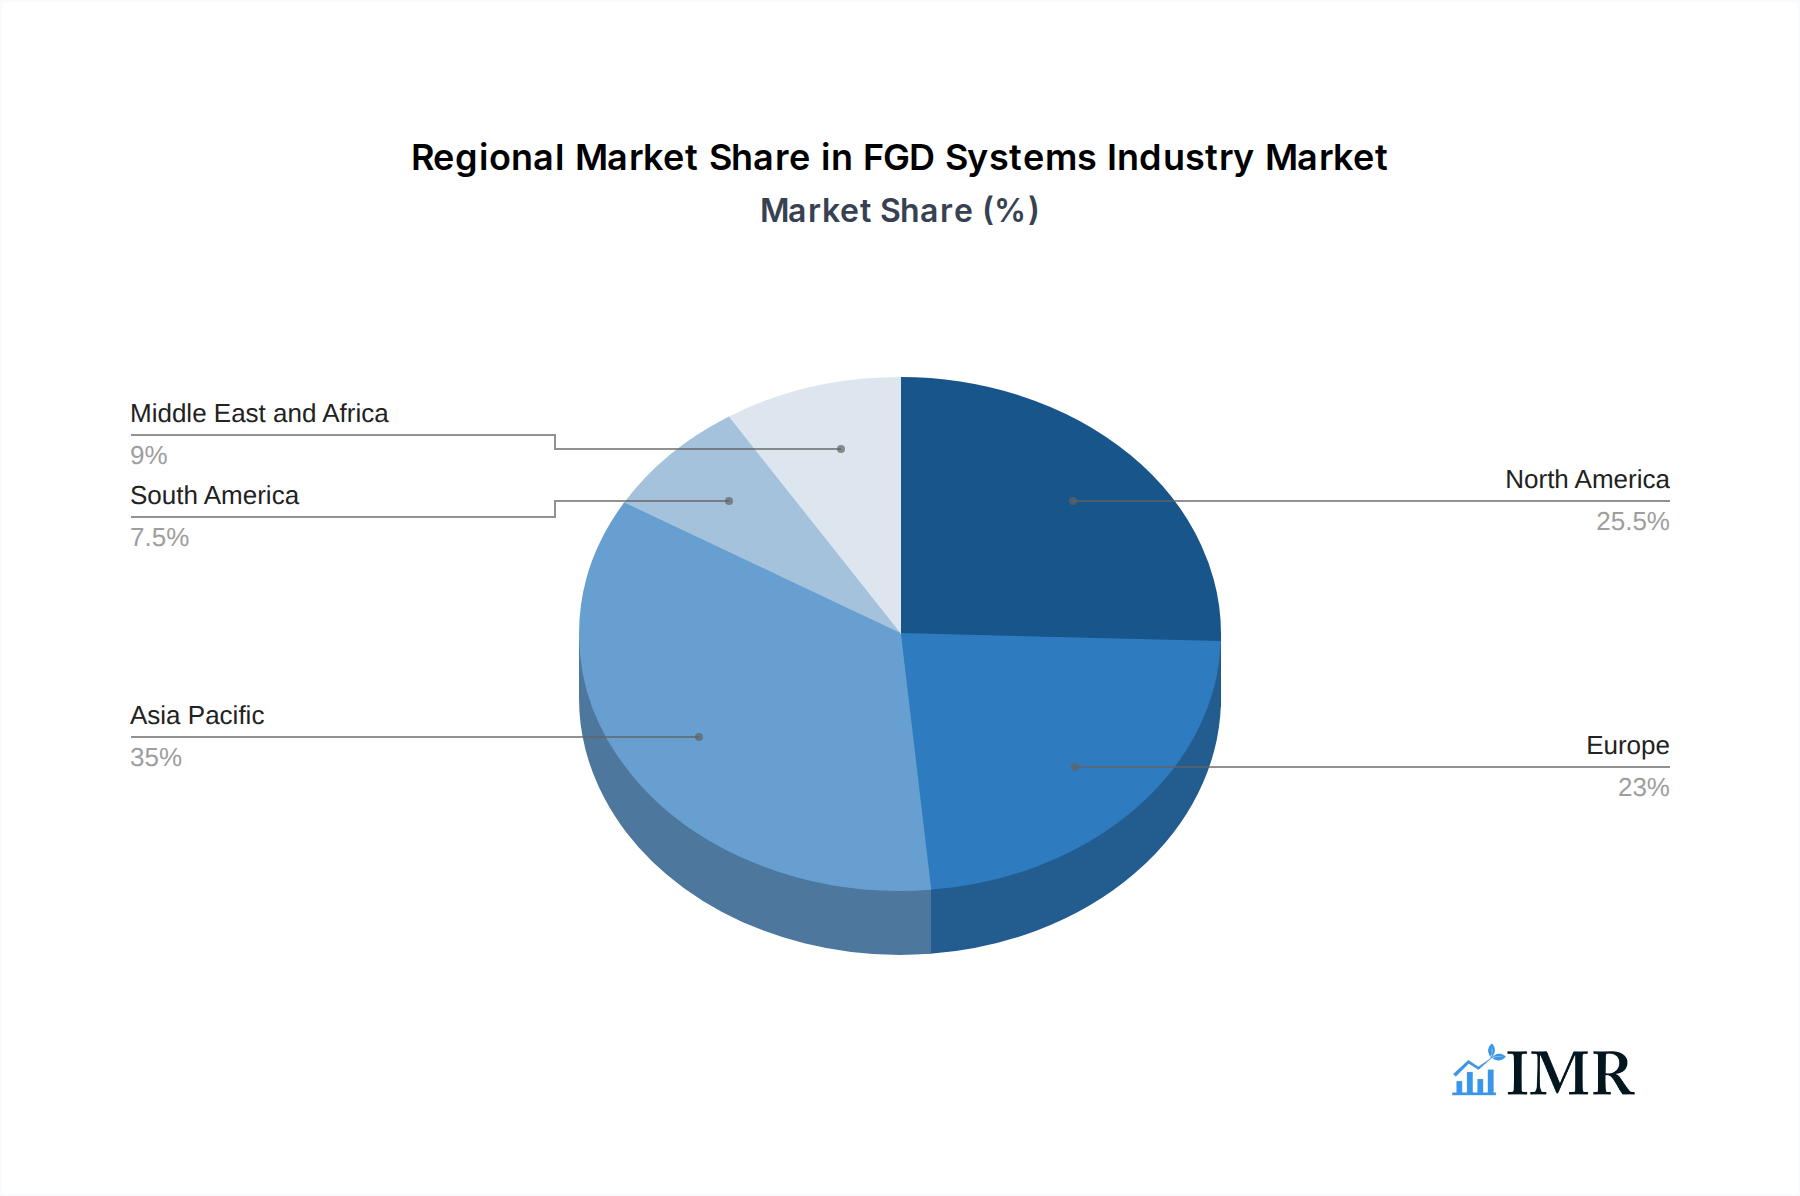
FGD Systems Industry Regional Market Share
Geographic Coverage of FGD Systems Industry
FGD Systems Industry REPORT HIGHLIGHTS
| Aspects | Details |
|---|---|
| Study Period | 2020-2034 |
| Base Year | 2025 |
| Estimated Year | 2026 |
| Forecast Period | 2026-2034 |
| Historical Period | 2020-2025 |
| Growth Rate | CAGR of 13.06% from 2020-2034 |
| Segmentation |
|
Table of Contents
- 1. Introduction
- 1.1. Research Scope
- 1.2. Market Segmentation
- 1.3. Research Objective
- 1.4. Definitions and Assumptions
- 2. Executive Summary
- 2.1. Market Snapshot
- 3. Market Dynamics
- 3.1. Market Drivers
- 3.2. Market Restrains
- 3.3. Market Trends
- 3.4. Market Opportunities
- 4. Market Factor Analysis
- 4.1. Porters Five Forces
- 4.1.1. Bargaining Power of Suppliers
- 4.1.2. Bargaining Power of Buyers
- 4.1.3. Threat of New Entrants
- 4.1.4. Threat of Substitutes
- 4.1.5. Competitive Rivalry
- 4.2. PESTEL analysis
- 4.3. BCG Analysis
- 4.3.1. Stars (High Growth, High Market Share)
- 4.3.2. Cash Cows (Low Growth, High Market Share)
- 4.3.3. Question Mark (High Growth, Low Market Share)
- 4.3.4. Dogs (Low Growth, Low Market Share)
- 4.4. Ansoff Matrix Analysis
- 4.5. Supply Chain Analysis
- 4.6. Regulatory Landscape
- 4.7. Current Market Potential and Opportunity Assessment (TAM–SAM–SOM Framework)
- 4.8. IMR Analyst Note
- 4.1. Porters Five Forces
- 5. Market Analysis, Insights and Forecast 2021-2033
- 5.1. Market Analysis, Insights and Forecast - by Type
- 5.1.1. Dry FGD
- 5.1.2. Wet FGD
- 5.2. Market Analysis, Insights and Forecast - by End-User Industry
- 5.2.1. Power Generation
- 5.2.2. Cement
- 5.2.3. Chemical
- 5.2.4. Iron and Steel
- 5.2.5. Other End-User Industries
- 5.3. Market Analysis, Insights and Forecast - by Region
- 5.3.1. North America
- 5.3.2. Europe
- 5.3.3. Asia Pacific
- 5.3.4. South America
- 5.3.5. Middle East and Africa
- 5.1. Market Analysis, Insights and Forecast - by Type
- 6. Global FGD Systems Industry Analysis, Insights and Forecast, 2021-2033
- 6.1. Market Analysis, Insights and Forecast - by Type
- 6.1.1. Dry FGD
- 6.1.2. Wet FGD
- 6.2. Market Analysis, Insights and Forecast - by End-User Industry
- 6.2.1. Power Generation
- 6.2.2. Cement
- 6.2.3. Chemical
- 6.2.4. Iron and Steel
- 6.2.5. Other End-User Industries
- 6.1. Market Analysis, Insights and Forecast - by Type
- 7. North America FGD Systems Industry Analysis, Insights and Forecast, 2020-2032
- 7.1. Market Analysis, Insights and Forecast - by Type
- 7.1.1. Dry FGD
- 7.1.2. Wet FGD
- 7.2. Market Analysis, Insights and Forecast - by End-User Industry
- 7.2.1. Power Generation
- 7.2.2. Cement
- 7.2.3. Chemical
- 7.2.4. Iron and Steel
- 7.2.5. Other End-User Industries
- 7.1. Market Analysis, Insights and Forecast - by Type
- 8. Europe FGD Systems Industry Analysis, Insights and Forecast, 2020-2032
- 8.1. Market Analysis, Insights and Forecast - by Type
- 8.1.1. Dry FGD
- 8.1.2. Wet FGD
- 8.2. Market Analysis, Insights and Forecast - by End-User Industry
- 8.2.1. Power Generation
- 8.2.2. Cement
- 8.2.3. Chemical
- 8.2.4. Iron and Steel
- 8.2.5. Other End-User Industries
- 8.1. Market Analysis, Insights and Forecast - by Type
- 9. Asia Pacific FGD Systems Industry Analysis, Insights and Forecast, 2020-2032
- 9.1. Market Analysis, Insights and Forecast - by Type
- 9.1.1. Dry FGD
- 9.1.2. Wet FGD
- 9.2. Market Analysis, Insights and Forecast - by End-User Industry
- 9.2.1. Power Generation
- 9.2.2. Cement
- 9.2.3. Chemical
- 9.2.4. Iron and Steel
- 9.2.5. Other End-User Industries
- 9.1. Market Analysis, Insights and Forecast - by Type
- 10. South America FGD Systems Industry Analysis, Insights and Forecast, 2020-2032
- 10.1. Market Analysis, Insights and Forecast - by Type
- 10.1.1. Dry FGD
- 10.1.2. Wet FGD
- 10.2. Market Analysis, Insights and Forecast - by End-User Industry
- 10.2.1. Power Generation
- 10.2.2. Cement
- 10.2.3. Chemical
- 10.2.4. Iron and Steel
- 10.2.5. Other End-User Industries
- 10.1. Market Analysis, Insights and Forecast - by Type
- 11. Middle East and Africa FGD Systems Industry Analysis, Insights and Forecast, 2020-2032
- 11.1. Market Analysis, Insights and Forecast - by Type
- 11.1.1. Dry FGD
- 11.1.2. Wet FGD
- 11.2. Market Analysis, Insights and Forecast - by End-User Industry
- 11.2.1. Power Generation
- 11.2.2. Cement
- 11.2.3. Chemical
- 11.2.4. Iron and Steel
- 11.2.5. Other End-User Industries
- 11.1. Market Analysis, Insights and Forecast - by Type
- 12. Competitive Analysis
- 12.1. Company Profiles
- 12.1.1 Ducon Technologies Inc
- 12.1.1.1. Company Overview
- 12.1.1.2. Products
- 12.1.1.3. Company Financials
- 12.1.1.4. SWOT Analysis
- 12.1.2 Hamon Corporation
- 12.1.2.1. Company Overview
- 12.1.2.2. Products
- 12.1.2.3. Company Financials
- 12.1.2.4. SWOT Analysis
- 12.1.3 Mitsubishi Hitachi Power Systems Ltd
- 12.1.3.1. Company Overview
- 12.1.3.2. Products
- 12.1.3.3. Company Financials
- 12.1.3.4. SWOT Analysis
- 12.1.4 Fujian Longking Co Ltd
- 12.1.4.1. Company Overview
- 12.1.4.2. Products
- 12.1.4.3. Company Financials
- 12.1.4.4. SWOT Analysis
- 12.1.5 Babcock & Wilcox Enterprises Inc
- 12.1.5.1. Company Overview
- 12.1.5.2. Products
- 12.1.5.3. Company Financials
- 12.1.5.4. SWOT Analysis
- 12.1.6 Thermax Ltd*List Not Exhaustive
- 12.1.6.1. Company Overview
- 12.1.6.2. Products
- 12.1.6.3. Company Financials
- 12.1.6.4. SWOT Analysis
- 12.1.7 John Wood Group PLC
- 12.1.7.1. Company Overview
- 12.1.7.2. Products
- 12.1.7.3. Company Financials
- 12.1.7.4. SWOT Analysis
- 12.1.8 Alstom S A
- 12.1.8.1. Company Overview
- 12.1.8.2. Products
- 12.1.8.3. Company Financials
- 12.1.8.4. SWOT Analysis
- 12.1.9 General Electric Company
- 12.1.9.1. Company Overview
- 12.1.9.2. Products
- 12.1.9.3. Company Financials
- 12.1.9.4. SWOT Analysis
- 12.1.10 Andritz AG
- 12.1.10.1. Company Overview
- 12.1.10.2. Products
- 12.1.10.3. Company Financials
- 12.1.10.4. SWOT Analysis
- 12.1.1 Ducon Technologies Inc
- 12.2. Market Entropy
- 12.2.1 Company's Key Areas Served
- 12.2.2 Recent Developments
- 12.3. Company Market Share Analysis 2025
- 12.3.1 Top 5 Companies Market Share Analysis
- 12.3.2 Top 3 Companies Market Share Analysis
- 12.4. List of Potential Customers
- 13. Research Methodology
List of Figures
- Figure 1: Global FGD Systems Industry Revenue Breakdown (billion, %) by Region 2025 & 2033
- Figure 2: North America FGD Systems Industry Revenue (billion), by Type 2025 & 2033
- Figure 3: North America FGD Systems Industry Revenue Share (%), by Type 2025 & 2033
- Figure 4: North America FGD Systems Industry Revenue (billion), by End-User Industry 2025 & 2033
- Figure 5: North America FGD Systems Industry Revenue Share (%), by End-User Industry 2025 & 2033
- Figure 6: North America FGD Systems Industry Revenue (billion), by Country 2025 & 2033
- Figure 7: North America FGD Systems Industry Revenue Share (%), by Country 2025 & 2033
- Figure 8: Europe FGD Systems Industry Revenue (billion), by Type 2025 & 2033
- Figure 9: Europe FGD Systems Industry Revenue Share (%), by Type 2025 & 2033
- Figure 10: Europe FGD Systems Industry Revenue (billion), by End-User Industry 2025 & 2033
- Figure 11: Europe FGD Systems Industry Revenue Share (%), by End-User Industry 2025 & 2033
- Figure 12: Europe FGD Systems Industry Revenue (billion), by Country 2025 & 2033
- Figure 13: Europe FGD Systems Industry Revenue Share (%), by Country 2025 & 2033
- Figure 14: Asia Pacific FGD Systems Industry Revenue (billion), by Type 2025 & 2033
- Figure 15: Asia Pacific FGD Systems Industry Revenue Share (%), by Type 2025 & 2033
- Figure 16: Asia Pacific FGD Systems Industry Revenue (billion), by End-User Industry 2025 & 2033
- Figure 17: Asia Pacific FGD Systems Industry Revenue Share (%), by End-User Industry 2025 & 2033
- Figure 18: Asia Pacific FGD Systems Industry Revenue (billion), by Country 2025 & 2033
- Figure 19: Asia Pacific FGD Systems Industry Revenue Share (%), by Country 2025 & 2033
- Figure 20: South America FGD Systems Industry Revenue (billion), by Type 2025 & 2033
- Figure 21: South America FGD Systems Industry Revenue Share (%), by Type 2025 & 2033
- Figure 22: South America FGD Systems Industry Revenue (billion), by End-User Industry 2025 & 2033
- Figure 23: South America FGD Systems Industry Revenue Share (%), by End-User Industry 2025 & 2033
- Figure 24: South America FGD Systems Industry Revenue (billion), by Country 2025 & 2033
- Figure 25: South America FGD Systems Industry Revenue Share (%), by Country 2025 & 2033
- Figure 26: Middle East and Africa FGD Systems Industry Revenue (billion), by Type 2025 & 2033
- Figure 27: Middle East and Africa FGD Systems Industry Revenue Share (%), by Type 2025 & 2033
- Figure 28: Middle East and Africa FGD Systems Industry Revenue (billion), by End-User Industry 2025 & 2033
- Figure 29: Middle East and Africa FGD Systems Industry Revenue Share (%), by End-User Industry 2025 & 2033
- Figure 30: Middle East and Africa FGD Systems Industry Revenue (billion), by Country 2025 & 2033
- Figure 31: Middle East and Africa FGD Systems Industry Revenue Share (%), by Country 2025 & 2033
List of Tables
- Table 1: Global FGD Systems Industry Revenue billion Forecast, by Type 2020 & 2033
- Table 2: Global FGD Systems Industry Revenue billion Forecast, by End-User Industry 2020 & 2033
- Table 3: Global FGD Systems Industry Revenue billion Forecast, by Region 2020 & 2033
- Table 4: Global FGD Systems Industry Revenue billion Forecast, by Type 2020 & 2033
- Table 5: Global FGD Systems Industry Revenue billion Forecast, by End-User Industry 2020 & 2033
- Table 6: Global FGD Systems Industry Revenue billion Forecast, by Country 2020 & 2033
- Table 7: Global FGD Systems Industry Revenue billion Forecast, by Type 2020 & 2033
- Table 8: Global FGD Systems Industry Revenue billion Forecast, by End-User Industry 2020 & 2033
- Table 9: Global FGD Systems Industry Revenue billion Forecast, by Country 2020 & 2033
- Table 10: Global FGD Systems Industry Revenue billion Forecast, by Type 2020 & 2033
- Table 11: Global FGD Systems Industry Revenue billion Forecast, by End-User Industry 2020 & 2033
- Table 12: Global FGD Systems Industry Revenue billion Forecast, by Country 2020 & 2033
- Table 13: Global FGD Systems Industry Revenue billion Forecast, by Type 2020 & 2033
- Table 14: Global FGD Systems Industry Revenue billion Forecast, by End-User Industry 2020 & 2033
- Table 15: Global FGD Systems Industry Revenue billion Forecast, by Country 2020 & 2033
- Table 16: Global FGD Systems Industry Revenue billion Forecast, by Type 2020 & 2033
- Table 17: Global FGD Systems Industry Revenue billion Forecast, by End-User Industry 2020 & 2033
- Table 18: Global FGD Systems Industry Revenue billion Forecast, by Country 2020 & 2033
Frequently Asked Questions
1. What is the projected Compound Annual Growth Rate (CAGR) of the FGD Systems Industry?
The projected CAGR is approximately 13.06%.
2. Which companies are prominent players in the FGD Systems Industry?
Key companies in the market include Ducon Technologies Inc, Hamon Corporation, Mitsubishi Hitachi Power Systems Ltd, Fujian Longking Co Ltd, Babcock & Wilcox Enterprises Inc, Thermax Ltd*List Not Exhaustive, John Wood Group PLC, Alstom S A, General Electric Company, Andritz AG.
3. What are the main segments of the FGD Systems Industry?
The market segments include Type, End-User Industry.
4. Can you provide details about the market size?
The market size is estimated to be USD 9.55 billion as of 2022.
5. What are some drivers contributing to market growth?
4.; Increasing Industrialization across the World4.; Expansion and Development of New Power Plants.
6. What are the notable trends driving market growth?
Increasing Demand from Power Generation Sector.
7. Are there any restraints impacting market growth?
4.; Increasing Adoption of Renewable Energy.
8. Can you provide examples of recent developments in the market?
N/A
9. What pricing options are available for accessing the report?
Pricing options include single-user, multi-user, and enterprise licenses priced at USD 4750, USD 5250, and USD 8750 respectively.
10. Is the market size provided in terms of value or volume?
The market size is provided in terms of value, measured in billion.
11. Are there any specific market keywords associated with the report?
Yes, the market keyword associated with the report is "FGD Systems Industry," which aids in identifying and referencing the specific market segment covered.
12. How do I determine which pricing option suits my needs best?
The pricing options vary based on user requirements and access needs. Individual users may opt for single-user licenses, while businesses requiring broader access may choose multi-user or enterprise licenses for cost-effective access to the report.
13. Are there any additional resources or data provided in the FGD Systems Industry report?
While the report offers comprehensive insights, it's advisable to review the specific contents or supplementary materials provided to ascertain if additional resources or data are available.
14. How can I stay updated on further developments or reports in the FGD Systems Industry?
To stay informed about further developments, trends, and reports in the FGD Systems Industry, consider subscribing to industry newsletters, following relevant companies and organizations, or regularly checking reputable industry news sources and publications.
Methodology
Step 1 - Identification of Relevant Samples Size from Population Database


Step 2 - Approaches for Defining Global Market Size (Value, Volume* & Price*)

Note*: In applicable scenarios
Step 3 - Data Sources
Primary Research
- Web Analytics
- Survey Reports
- Research Institute
- Latest Research Reports
- Opinion Leaders
Secondary Research
- Annual Reports
- White Paper
- Latest Press Release
- Industry Association
- Paid Database
- Investor Presentations

Step 4 - Data Triangulation
Involves using different sources of information in order to increase the validity of a study
These sources are likely to be stakeholders in a program - participants, other researchers, program staff, other community members, and so on.
Then we put all data in single framework & apply various statistical tools to find out the dynamic on the market.
During the analysis stage, feedback from the stakeholder groups would be compared to determine areas of agreement as well as areas of divergence