

Key Insights
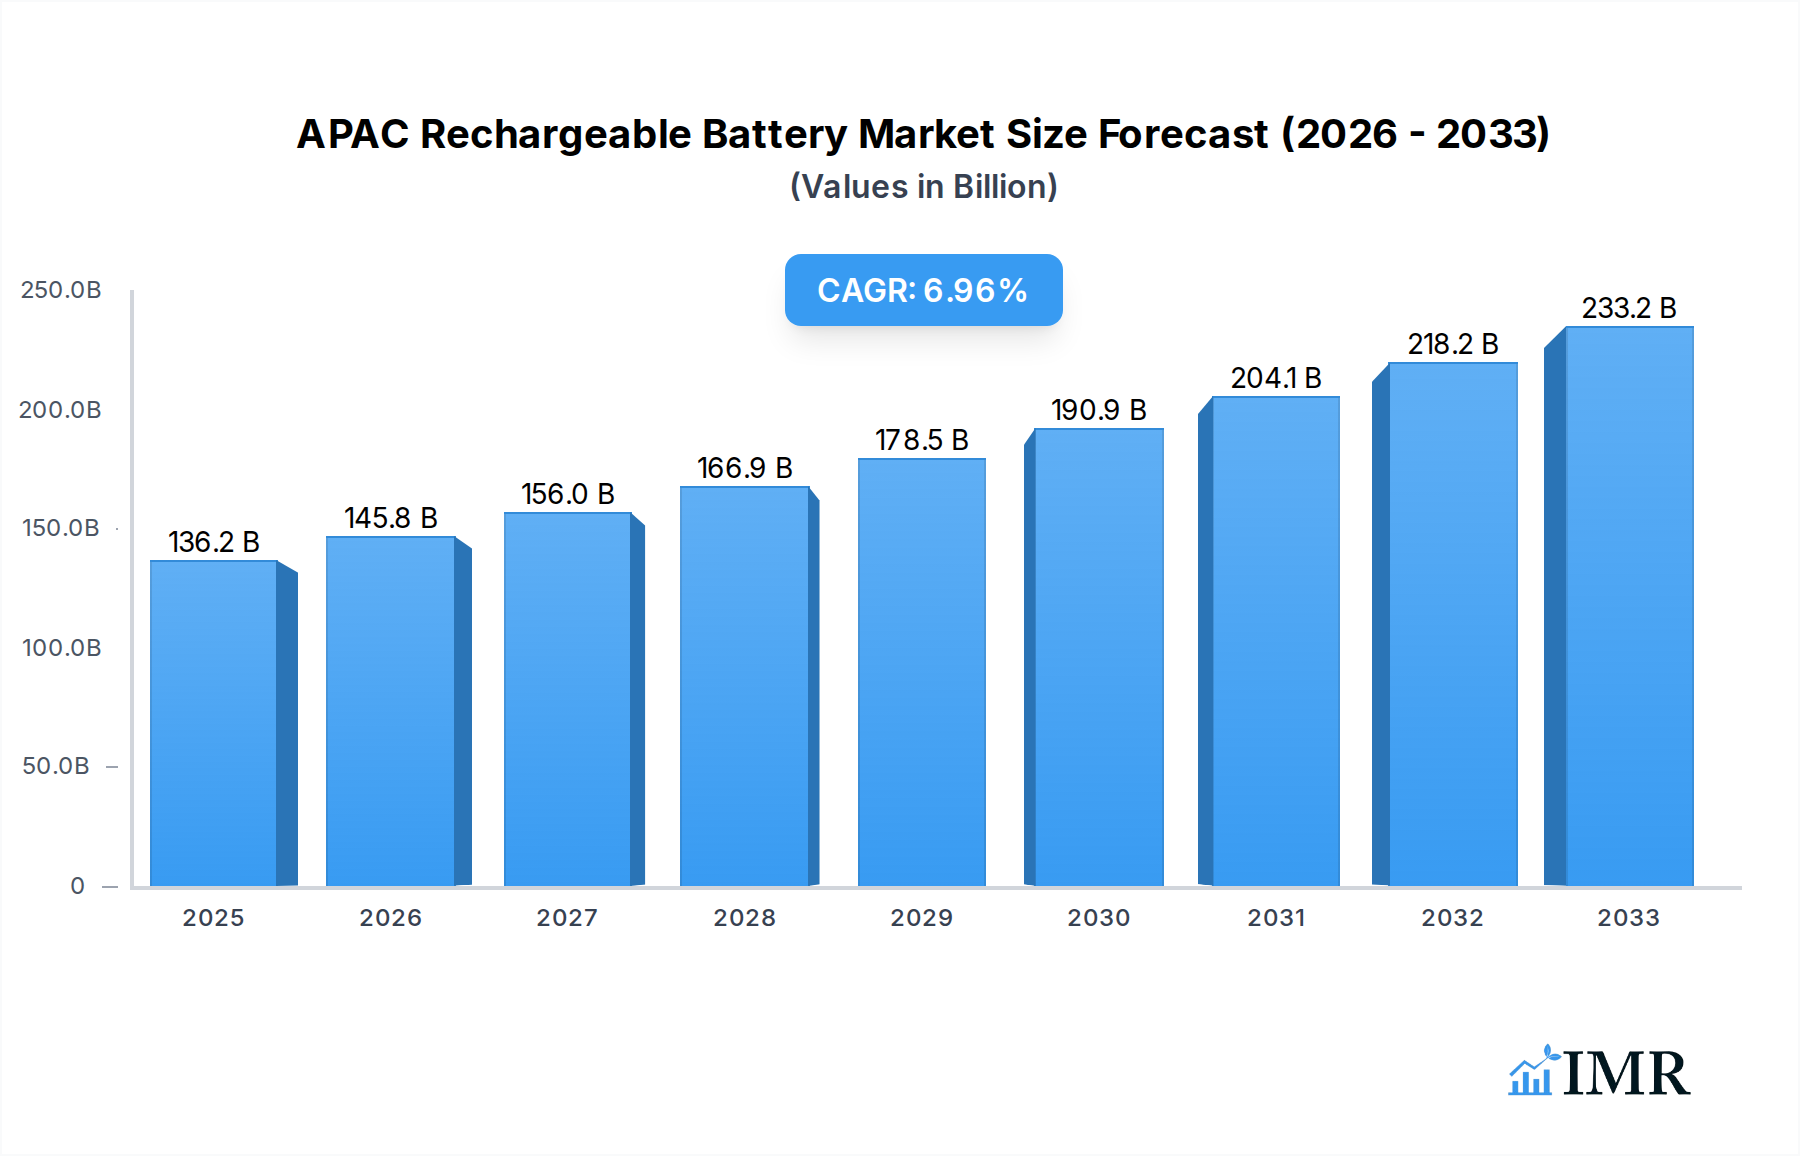
The APAC Rechargeable Battery Market is poised for significant expansion, projected to reach $136.17 billion by 2025, driven by a robust compound annual growth rate (CAGR) of 7.49% through 2033. This impressive growth is fueled by the escalating demand for electric vehicles (EVs), including Hybrid Electric Vehicles (HEVs) and Plug-in Hybrid Electric Vehicles (PHEVs), which are rapidly transforming the automotive landscape across the region. Furthermore, the burgeoning consumer electronics sector, characterized by a constant need for portable power solutions, and the increasing industrial electrification initiatives, are significant contributors to this market surge. Key technological advancements, particularly in Lithium-ion battery technology, are enhancing performance, safety, and cost-effectiveness, further accelerating adoption across various applications.

APAC Rechargeable Battery Market Market Size (In Billion)
The market's dynamic nature is also shaped by evolving consumer preferences and stringent government regulations promoting sustainable energy solutions. While the market exhibits strong growth, certain factors, such as the fluctuating raw material prices for battery components and the significant initial investment required for advanced battery manufacturing facilities, present potential challenges. However, the strategic initiatives undertaken by leading players to expand production capacities and invest in research and development for next-generation battery technologies are expected to mitigate these restraints. The Asia-Pacific region's diverse economic landscape, with strong manufacturing bases in China and growing adoption rates in India and South Korea, underscores its pivotal role in the global rechargeable battery market.
APAC Rechargeable Battery Market Company Market Share
APAC Rechargeable Battery Market: Comprehensive Analysis and Future Outlook (2019-2033)
Report Description:
Unlock the immense potential of the APAC Rechargeable Battery Market with this definitive industry report. Covering the period from 2019 to 2033, with a detailed focus on the 2025 base and estimated year, this analysis provides critical insights into the dynamic landscape of rechargeable battery technologies, applications, and regional growth across Asia-Pacific. Dive deep into market segmentation, understanding the pivotal roles of primary and secondary batteries, alongside the technological evolution from lead-acid to advanced lithium-ion solutions. Explore the burgeoning demand across automotive (HEV, PHEV, EV), industrial, and portable consumer electronics applications. With precise forecasts for 2025-2033 and historical context from 2019-2024, this report empowers stakeholders with actionable intelligence to navigate market trends, identify growth accelerators, and capitalize on emerging opportunities. Featuring in-depth analyses of market drivers, barriers, challenges, and the competitive strategies of industry giants like BYD Co Ltd, Contemporary Amperex Technology Co Limited, and Tesla Inc, this is your essential guide to the future of energy storage in the Asia-Pacific region.
APAC Rechargeable Battery Market Market Dynamics & Structure
The APAC rechargeable battery market is characterized by a dynamic interplay of factors shaping its growth and competitive intensity. Market concentration is moderate, with a few dominant players alongside a growing number of innovative smaller enterprises. Technological innovation remains a paramount driver, fueled by escalating demand for higher energy density, faster charging capabilities, and enhanced safety in lithium-ion batteries. Regulatory frameworks across countries like China, Japan, and South Korea are increasingly supportive of renewable energy adoption and electric vehicle (EV) deployment, directly impacting battery production and consumption. Competitive product substitutes are emerging, particularly in niche applications, but lithium-ion technology continues to solidify its dominance across major segments. End-user demographics are shifting rapidly, with a growing middle class in countries like India and Southeast Asia driving demand for consumer electronics and electric mobility. Mergers and acquisitions (M&A) trends indicate consolidation among leading manufacturers seeking to secure raw materials, expand production capacity, and gain market share.
- Market Concentration: A mix of large conglomerates and specialized battery manufacturers, with increasing consolidation through M&A.
- Technological Innovation Drivers: Demand for EVs, portable electronics, grid storage, and stringent performance requirements.
- Regulatory Frameworks: Government incentives for EV adoption, renewable energy integration, and stricter environmental standards.
- Competitive Product Substitutes: While Li-ion leads, advancements in solid-state and other next-generation batteries pose long-term challenges.
- End-User Demographics: Rapid urbanization, growing disposable incomes, and increasing adoption of smart devices and electric vehicles.
- M&A Trends: Strategic acquisitions to secure supply chains, enhance R&D, and expand global manufacturing footprints.
APAC Rechargeable Battery Market Growth Trends & Insights
The APAC rechargeable battery market is on an unprecedented growth trajectory, projected to witness substantial expansion driven by a confluence of technological advancements, evolving consumer behavior, and supportive industrial policies. The market size is expected to surge as the demand for electric vehicles (EVs), including hybrid electric vehicles (HEVs) and plug-in hybrid electric vehicles (PHEVs), continues to accelerate across key economies like China and South Korea. This surge in automotive applications is directly linked to increasing adoption rates of lithium-ion batteries, which offer superior energy density and performance compared to traditional lead-acid technologies. Technological disruptions, such as advancements in battery management systems (BMS), faster charging infrastructure, and the ongoing research into solid-state batteries, are further poised to redefine the market landscape. Consumer behavior shifts are also playing a crucial role, with a growing preference for sustainable energy solutions, smart devices, and personal mobility options contributing to higher penetration rates of rechargeable batteries.
The forecast period (2025–2033) is anticipated to be a period of significant market penetration for rechargeable batteries, especially within the secondary battery segment. The compound annual growth rate (CAGR) is expected to remain robust, reflecting the sustained demand from both established and emerging markets within the APAC region. Historical data from 2019-2024 indicates a steady upward trend, laying a strong foundation for future growth. Insights from industry leaders and technological breakthroughs suggest a continued focus on cost reduction, improved battery lifespan, and enhanced recyclability. The increasing integration of renewable energy sources into the grid also presents a substantial opportunity for large-scale energy storage solutions powered by rechargeable batteries. Furthermore, the burgeoning e-commerce sector and the widespread adoption of mobile devices across Asia-Pacific are creating a consistent demand for portable rechargeable batteries, underscoring the multifaceted nature of this market's expansion.
Dominant Regions, Countries, or Segments in APAC Rechargeable Battery Market
The APAC rechargeable battery market is a complex ecosystem with distinct regions, countries, and segments contributing to its overall growth and dominance. China stands as the undisputed leader, propelled by its massive domestic demand for electric vehicles, extensive manufacturing capabilities, and supportive government policies that have fostered rapid innovation and scaling of production for lithium-ion batteries. The sheer volume of EV sales, coupled with significant investments in battery research and development, positions China at the forefront of this sector.
Within the broader market segments, Secondary Batteries are experiencing remarkable growth, eclipsing primary batteries due to their reusability and application in high-demand sectors like EVs and consumer electronics. Among the various Technologies, Lithium-ion Battery technology is the dominant force, accounting for the largest market share. Its superior energy density, lighter weight, and longer cycle life make it the preferred choice for a wide array of applications, from powering smartphones and laptops to electrifying entire vehicle fleets.
The Automotive Batteries (HEV, PHEV, and EV) segment is a primary growth engine for the APAC rechargeable battery market. Governments across the region are actively promoting the transition to electric mobility through subsidies, tax incentives, and stringent emission regulations, creating an insatiable demand for EV batteries. Countries like South Korea and Japan are also significant contributors to this segment, with major automotive manufacturers heavily investing in electrification strategies.
India is emerging as a critical growth market, driven by its rapidly expanding economy, increasing urbanization, and a growing middle class with a burgeoning demand for consumer electronics and electric two-wheelers. Government initiatives aimed at boosting domestic manufacturing and promoting renewable energy are further accelerating the adoption of rechargeable battery technologies.
- Dominant Country: China
- Key Drivers: Largest EV market globally, substantial government subsidies and policy support, extensive battery manufacturing infrastructure, strong R&D investment.
- Market Share: Holds a commanding share in global battery production and consumption.
- Dominant Segment: Secondary Battery
- Key Drivers: Ubiquitous use in electric vehicles, portable electronics, and renewable energy storage.
- Growth Potential: Continual innovation in energy density and charging speed fuels demand.
- Dominant Technology: Lithium-ion Battery
- Key Drivers: High energy density, light weight, long cycle life, versatility across applications.
- Advancements: Ongoing research in cathode/anode materials and battery management systems.
- Dominant Application: Automotive Batteries (HEV, PHEV, and EV)
- Key Drivers: Global push for decarbonization, government mandates on EV sales, declining battery costs.
- Regional Impact: China, South Korea, and Japan are key markets for EV battery deployment.
- Emerging Growth Market: India
- Key Drivers: Large population, growing disposable income, increasing adoption of electric two-wheelers and three-wheelers, government "Make in India" initiative.
- Future Potential: Significant untapped potential for both consumer electronics and EV battery markets.
- Other Significant Geographies: South Korea and Japan are crucial for their technological prowess and significant contributions to battery innovation and manufacturing, particularly in advanced lithium-ion chemistries and specialized applications.
APAC Rechargeable Battery Market Product Landscape
The APAC rechargeable battery market is defined by a landscape rich in product innovation and expanding application diversity. Manufacturers are continuously pushing the boundaries of performance metrics, focusing on enhancing energy density to enable longer operating times for portable devices and extended ranges for electric vehicles. Faster charging capabilities are a key development, addressing consumer demand for convenience and minimizing downtime. Safety remains paramount, with advancements in battery management systems and cell chemistries aimed at mitigating risks and improving thermal stability. The product portfolio spans a wide spectrum, from compact lithium-ion coin cells for wearables to high-capacity battery packs for grid-scale energy storage and electric buses. Unique selling propositions often revolve around specialized chemistries like NMC (Nickel Manganese Cobalt) and LFP (Lithium Iron Phosphate) for EVs, each offering distinct advantages in terms of cost, safety, and lifespan. Furthermore, ongoing research into next-generation technologies like solid-state batteries promises even higher energy density and enhanced safety profiles, signaling a future of even more potent and efficient energy storage solutions.
Key Drivers, Barriers & Challenges in APAC Rechargeable Battery Market
Key Drivers: The APAC rechargeable battery market is propelled by several powerful forces. The escalating global demand for electric vehicles, driven by environmental concerns and government regulations, is a primary catalyst. Simultaneously, the ubiquitous growth of portable consumer electronics, from smartphones to smart home devices, creates a sustained need for reliable and high-performance rechargeable batteries. Government incentives, such as subsidies for EV purchases and manufacturing, are further stimulating market expansion. Technological advancements, particularly in lithium-ion battery chemistry and manufacturing processes, are leading to improved energy density, faster charging, and reduced costs, making rechargeable batteries more accessible and appealing.
Barriers & Challenges: Despite robust growth, the market faces significant hurdles. The volatile prices and limited supply of key raw materials, such as lithium, cobalt, and nickel, pose a considerable challenge, impacting production costs and supply chain stability. Intense competition among manufacturers, both established players and new entrants, can lead to price wars and squeezed profit margins. Stringent and evolving environmental regulations regarding battery disposal and recycling require substantial investment in sustainable practices. Furthermore, the development and adoption of new, cutting-edge battery technologies often face high R&D costs and lengthy commercialization timelines, potentially slowing down the transition to next-generation solutions.
Emerging Opportunities in APAC Rechargeable Battery Market
Emerging opportunities in the APAC rechargeable battery market are abundant, particularly in the realm of energy storage solutions for renewable energy integration. The increasing deployment of solar and wind power necessitates sophisticated battery systems for grid stabilization and load balancing. Untapped markets in Southeast Asia present significant potential for growth, driven by rising disposable incomes and increasing demand for electric mobility and consumer electronics. Innovative applications, such as battery-powered drones for logistics and agriculture, and advanced battery systems for electric aviation, are gaining traction. Evolving consumer preferences for sustainable and eco-friendly products are also creating opportunities for manufacturers offering batteries with longer lifespans and improved recyclability. The development of smart grids and the expansion of electric vehicle charging infrastructure will further fuel demand for diverse rechargeable battery solutions.
Growth Accelerators in the APAC Rechargeable Battery Market Industry
Several key catalysts are accelerating the long-term growth of the APAC rechargeable battery market. Technological breakthroughs, such as advancements in solid-state battery technology and the development of novel cathode and anode materials, promise higher energy density, faster charging, and enhanced safety, paving the way for next-generation energy storage. Strategic partnerships and joint ventures between battery manufacturers, automotive companies, and technology providers are crucial for sharing expertise, securing supply chains, and co-developing innovative solutions. Market expansion strategies, including increased investment in gigafactories and the establishment of robust recycling infrastructure, are essential for meeting the escalating demand and ensuring sustainable growth. The supportive regulatory environment in many APAC nations, aimed at promoting electrification and renewable energy adoption, continues to act as a significant growth accelerator.
Key Players Shaping the APAC Rechargeable Battery Market Market
- BYD Co Ltd
- EnerSys
- Contemporary Amperex Technology Co Limited
- Saft Groupe SA
- Samsung SDI Co Ltd
- LG Chem Ltd
- Tesla Inc
- Clarios International Inc
- GS Yuasa Corporation
- Duracell Inc
- TianJin Lishen Battery Joint-Stock Co Ltd
- Panasonic Corporation
Notable Milestones in APAC Rechargeable Battery Market Sector
- January 2022: China Lithium Battery Technology signed two contracts with two cities in the southern Chinese province of Guangdong to build new production facilities with an annual capacity of 50 GWh. The factories will be located in Guangzhou and Jiangmen.
- January 2022: BYD and FAW are planning a production facility for electric car batteries with an annual capacity of 45 GWh in north-eastern China. A joint venture between BYD and FAW called FAW FinDreams New Energy Technology was established, with a registered capital of EUR 140 million. BYD holds 51% of the JV, and FAW Group owns the remaining.
In-Depth APAC Rechargeable Battery Market Market Outlook
The APAC rechargeable battery market is poised for continued robust growth, driven by the accelerating transition to electric mobility and the increasing demand for efficient energy storage solutions. Future market potential is substantial, fueled by ongoing technological innovations that promise higher performance, improved safety, and reduced costs. Strategic opportunities lie in expanding production capacity to meet the burgeoning demand from both automotive and consumer electronics sectors, and in developing advanced battery recycling infrastructure to ensure sustainability. The growing emphasis on renewable energy integration will further propel the market for grid-scale battery storage. Stakeholders can capitalize on these trends by investing in R&D for next-generation battery technologies, forging strategic alliances, and adapting to evolving regulatory landscapes.
APAC Rechargeable Battery Market Segmentation
-
1. Type
- 1.1. Primary Battery
- 1.2. Secondary Battery
-
2. Technology
- 2.1. Lead-acid Battery
- 2.2. Lithium-ion Battery
- 2.3. Other Technologies
-
3. Application
- 3.1. Automotive Batteries (HEV, PHEV, and EV)
- 3.2. Industri
- 3.3. Portable Batteries (Consumer Electronics)
- 3.4. Other Applications
-
4. Geography
- 4.1. India
- 4.2. China
- 4.3. Japan
- 4.4. South Korea
- 4.5. Rest of Asia-Pacific
APAC Rechargeable Battery Market Segmentation By Geography
- 1. India
- 2. China
- 3. Japan
- 4. South Korea
- 5. Rest of Asia Pacific
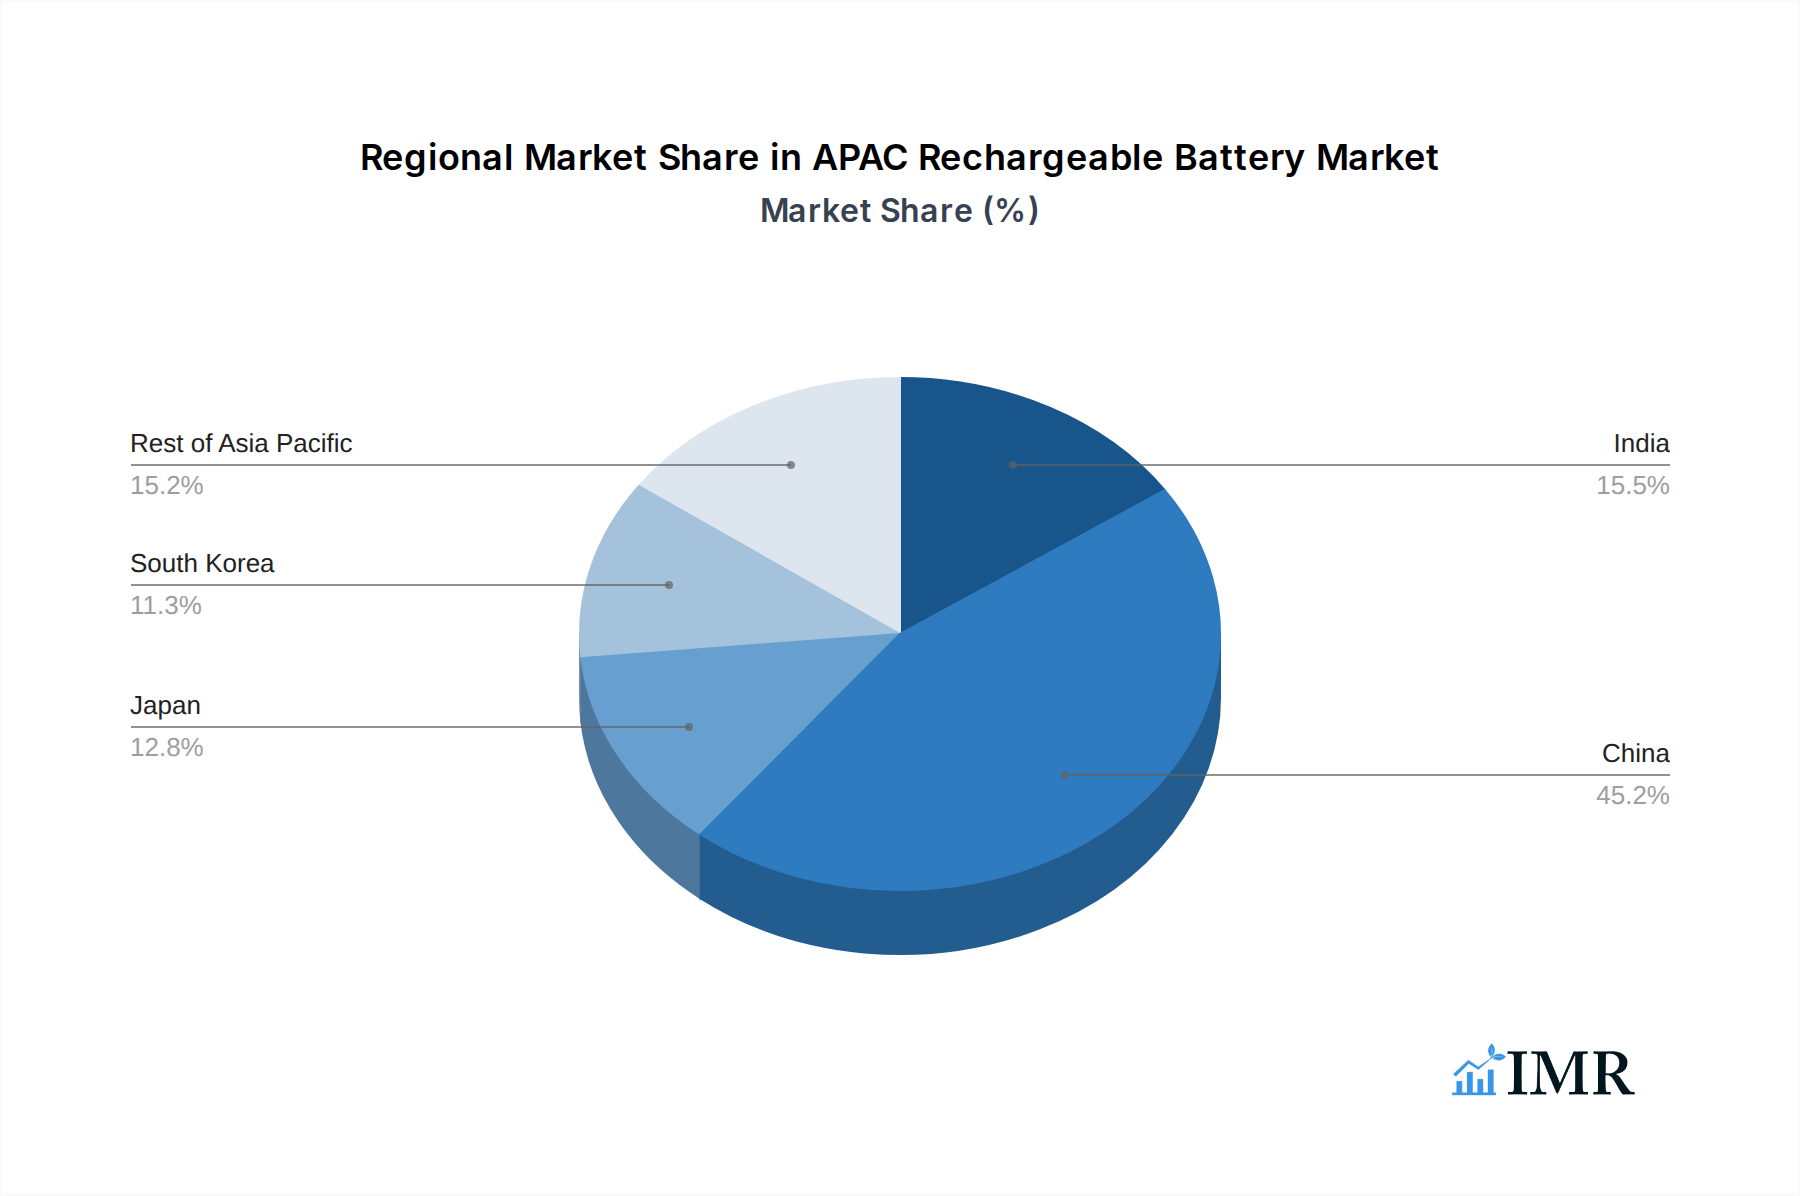
APAC Rechargeable Battery Market Regional Market Share
Geographic Coverage of APAC Rechargeable Battery Market
APAC Rechargeable Battery Market REPORT HIGHLIGHTS
| Aspects | Details |
|---|---|
| Study Period | 2020-2034 |
| Base Year | 2025 |
| Estimated Year | 2026 |
| Forecast Period | 2026-2034 |
| Historical Period | 2020-2025 |
| Growth Rate | CAGR of 7.49% from 2020-2034 |
| Segmentation |
|
Table of Contents
- 1. Introduction
- 1.1. Research Scope
- 1.2. Market Segmentation
- 1.3. Research Objective
- 1.4. Definitions and Assumptions
- 2. Executive Summary
- 2.1. Market Snapshot
- 3. Market Dynamics
- 3.1. Market Drivers
- 3.2. Market Restrains
- 3.3. Market Trends
- 3.4. Market Opportunities
- 4. Market Factor Analysis
- 4.1. Porters Five Forces
- 4.1.1. Bargaining Power of Suppliers
- 4.1.2. Bargaining Power of Buyers
- 4.1.3. Threat of New Entrants
- 4.1.4. Threat of Substitutes
- 4.1.5. Competitive Rivalry
- 4.2. PESTEL analysis
- 4.3. BCG Analysis
- 4.3.1. Stars (High Growth, High Market Share)
- 4.3.2. Cash Cows (Low Growth, High Market Share)
- 4.3.3. Question Mark (High Growth, Low Market Share)
- 4.3.4. Dogs (Low Growth, Low Market Share)
- 4.4. Ansoff Matrix Analysis
- 4.5. Supply Chain Analysis
- 4.6. Regulatory Landscape
- 4.7. Current Market Potential and Opportunity Assessment (TAM–SAM–SOM Framework)
- 4.8. IMR Analyst Note
- 4.1. Porters Five Forces
- 5. Market Analysis, Insights and Forecast 2021-2033
- 5.1. Market Analysis, Insights and Forecast - by Type
- 5.1.1. Primary Battery
- 5.1.2. Secondary Battery
- 5.2. Market Analysis, Insights and Forecast - by Technology
- 5.2.1. Lead-acid Battery
- 5.2.2. Lithium-ion Battery
- 5.2.3. Other Technologies
- 5.3. Market Analysis, Insights and Forecast - by Application
- 5.3.1. Automotive Batteries (HEV, PHEV, and EV)
- 5.3.2. Industri
- 5.3.3. Portable Batteries (Consumer Electronics)
- 5.3.4. Other Applications
- 5.4. Market Analysis, Insights and Forecast - by Geography
- 5.4.1. India
- 5.4.2. China
- 5.4.3. Japan
- 5.4.4. South Korea
- 5.4.5. Rest of Asia-Pacific
- 5.5. Market Analysis, Insights and Forecast - by Region
- 5.5.1. India
- 5.5.2. China
- 5.5.3. Japan
- 5.5.4. South Korea
- 5.5.5. Rest of Asia Pacific
- 5.1. Market Analysis, Insights and Forecast - by Type
- 6. Global APAC Rechargeable Battery Market Analysis, Insights and Forecast, 2021-2033
- 6.1. Market Analysis, Insights and Forecast - by Type
- 6.1.1. Primary Battery
- 6.1.2. Secondary Battery
- 6.2. Market Analysis, Insights and Forecast - by Technology
- 6.2.1. Lead-acid Battery
- 6.2.2. Lithium-ion Battery
- 6.2.3. Other Technologies
- 6.3. Market Analysis, Insights and Forecast - by Application
- 6.3.1. Automotive Batteries (HEV, PHEV, and EV)
- 6.3.2. Industri
- 6.3.3. Portable Batteries (Consumer Electronics)
- 6.3.4. Other Applications
- 6.4. Market Analysis, Insights and Forecast - by Geography
- 6.4.1. India
- 6.4.2. China
- 6.4.3. Japan
- 6.4.4. South Korea
- 6.4.5. Rest of Asia-Pacific
- 6.1. Market Analysis, Insights and Forecast - by Type
- 7. India APAC Rechargeable Battery Market Analysis, Insights and Forecast, 2020-2032
- 7.1. Market Analysis, Insights and Forecast - by Type
- 7.1.1. Primary Battery
- 7.1.2. Secondary Battery
- 7.2. Market Analysis, Insights and Forecast - by Technology
- 7.2.1. Lead-acid Battery
- 7.2.2. Lithium-ion Battery
- 7.2.3. Other Technologies
- 7.3. Market Analysis, Insights and Forecast - by Application
- 7.3.1. Automotive Batteries (HEV, PHEV, and EV)
- 7.3.2. Industri
- 7.3.3. Portable Batteries (Consumer Electronics)
- 7.3.4. Other Applications
- 7.4. Market Analysis, Insights and Forecast - by Geography
- 7.4.1. India
- 7.4.2. China
- 7.4.3. Japan
- 7.4.4. South Korea
- 7.4.5. Rest of Asia-Pacific
- 7.1. Market Analysis, Insights and Forecast - by Type
- 8. China APAC Rechargeable Battery Market Analysis, Insights and Forecast, 2020-2032
- 8.1. Market Analysis, Insights and Forecast - by Type
- 8.1.1. Primary Battery
- 8.1.2. Secondary Battery
- 8.2. Market Analysis, Insights and Forecast - by Technology
- 8.2.1. Lead-acid Battery
- 8.2.2. Lithium-ion Battery
- 8.2.3. Other Technologies
- 8.3. Market Analysis, Insights and Forecast - by Application
- 8.3.1. Automotive Batteries (HEV, PHEV, and EV)
- 8.3.2. Industri
- 8.3.3. Portable Batteries (Consumer Electronics)
- 8.3.4. Other Applications
- 8.4. Market Analysis, Insights and Forecast - by Geography
- 8.4.1. India
- 8.4.2. China
- 8.4.3. Japan
- 8.4.4. South Korea
- 8.4.5. Rest of Asia-Pacific
- 8.1. Market Analysis, Insights and Forecast - by Type
- 9. Japan APAC Rechargeable Battery Market Analysis, Insights and Forecast, 2020-2032
- 9.1. Market Analysis, Insights and Forecast - by Type
- 9.1.1. Primary Battery
- 9.1.2. Secondary Battery
- 9.2. Market Analysis, Insights and Forecast - by Technology
- 9.2.1. Lead-acid Battery
- 9.2.2. Lithium-ion Battery
- 9.2.3. Other Technologies
- 9.3. Market Analysis, Insights and Forecast - by Application
- 9.3.1. Automotive Batteries (HEV, PHEV, and EV)
- 9.3.2. Industri
- 9.3.3. Portable Batteries (Consumer Electronics)
- 9.3.4. Other Applications
- 9.4. Market Analysis, Insights and Forecast - by Geography
- 9.4.1. India
- 9.4.2. China
- 9.4.3. Japan
- 9.4.4. South Korea
- 9.4.5. Rest of Asia-Pacific
- 9.1. Market Analysis, Insights and Forecast - by Type
- 10. South Korea APAC Rechargeable Battery Market Analysis, Insights and Forecast, 2020-2032
- 10.1. Market Analysis, Insights and Forecast - by Type
- 10.1.1. Primary Battery
- 10.1.2. Secondary Battery
- 10.2. Market Analysis, Insights and Forecast - by Technology
- 10.2.1. Lead-acid Battery
- 10.2.2. Lithium-ion Battery
- 10.2.3. Other Technologies
- 10.3. Market Analysis, Insights and Forecast - by Application
- 10.3.1. Automotive Batteries (HEV, PHEV, and EV)
- 10.3.2. Industri
- 10.3.3. Portable Batteries (Consumer Electronics)
- 10.3.4. Other Applications
- 10.4. Market Analysis, Insights and Forecast - by Geography
- 10.4.1. India
- 10.4.2. China
- 10.4.3. Japan
- 10.4.4. South Korea
- 10.4.5. Rest of Asia-Pacific
- 10.1. Market Analysis, Insights and Forecast - by Type
- 11. Rest of Asia Pacific APAC Rechargeable Battery Market Analysis, Insights and Forecast, 2020-2032
- 11.1. Market Analysis, Insights and Forecast - by Type
- 11.1.1. Primary Battery
- 11.1.2. Secondary Battery
- 11.2. Market Analysis, Insights and Forecast - by Technology
- 11.2.1. Lead-acid Battery
- 11.2.2. Lithium-ion Battery
- 11.2.3. Other Technologies
- 11.3. Market Analysis, Insights and Forecast - by Application
- 11.3.1. Automotive Batteries (HEV, PHEV, and EV)
- 11.3.2. Industri
- 11.3.3. Portable Batteries (Consumer Electronics)
- 11.3.4. Other Applications
- 11.4. Market Analysis, Insights and Forecast - by Geography
- 11.4.1. India
- 11.4.2. China
- 11.4.3. Japan
- 11.4.4. South Korea
- 11.4.5. Rest of Asia-Pacific
- 11.1. Market Analysis, Insights and Forecast - by Type
- 12. Competitive Analysis
- 12.1. Company Profiles
- 12.1.1 BYD Co Ltd
- 12.1.1.1. Company Overview
- 12.1.1.2. Products
- 12.1.1.3. Company Financials
- 12.1.1.4. SWOT Analysis
- 12.1.2 EnerSys
- 12.1.2.1. Company Overview
- 12.1.2.2. Products
- 12.1.2.3. Company Financials
- 12.1.2.4. SWOT Analysis
- 12.1.3 Contemporary Amperex Technology Co Limited
- 12.1.3.1. Company Overview
- 12.1.3.2. Products
- 12.1.3.3. Company Financials
- 12.1.3.4. SWOT Analysis
- 12.1.4 Saft Groupe SA
- 12.1.4.1. Company Overview
- 12.1.4.2. Products
- 12.1.4.3. Company Financials
- 12.1.4.4. SWOT Analysis
- 12.1.5 Samsung SDI Co Ltd
- 12.1.5.1. Company Overview
- 12.1.5.2. Products
- 12.1.5.3. Company Financials
- 12.1.5.4. SWOT Analysis
- 12.1.6 LG Chem Ltd
- 12.1.6.1. Company Overview
- 12.1.6.2. Products
- 12.1.6.3. Company Financials
- 12.1.6.4. SWOT Analysis
- 12.1.7 Tesla Inc
- 12.1.7.1. Company Overview
- 12.1.7.2. Products
- 12.1.7.3. Company Financials
- 12.1.7.4. SWOT Analysis
- 12.1.8 Clarios International Inc
- 12.1.8.1. Company Overview
- 12.1.8.2. Products
- 12.1.8.3. Company Financials
- 12.1.8.4. SWOT Analysis
- 12.1.9 GS Yuasa Corporation
- 12.1.9.1. Company Overview
- 12.1.9.2. Products
- 12.1.9.3. Company Financials
- 12.1.9.4. SWOT Analysis
- 12.1.10 Duracell Inc
- 12.1.10.1. Company Overview
- 12.1.10.2. Products
- 12.1.10.3. Company Financials
- 12.1.10.4. SWOT Analysis
- 12.1.11 TianJin Lishen Battery Joint-Stock Co Ltd *List Not Exhaustive
- 12.1.11.1. Company Overview
- 12.1.11.2. Products
- 12.1.11.3. Company Financials
- 12.1.11.4. SWOT Analysis
- 12.1.12 Panasonic Corporation
- 12.1.12.1. Company Overview
- 12.1.12.2. Products
- 12.1.12.3. Company Financials
- 12.1.12.4. SWOT Analysis
- 12.1.1 BYD Co Ltd
- 12.2. Market Entropy
- 12.2.1 Company's Key Areas Served
- 12.2.2 Recent Developments
- 12.3. Company Market Share Analysis 2025
- 12.3.1 Top 5 Companies Market Share Analysis
- 12.3.2 Top 3 Companies Market Share Analysis
- 12.4. List of Potential Customers
- 13. Research Methodology
List of Figures
- Figure 1: Global APAC Rechargeable Battery Market Revenue Breakdown (billion, %) by Region 2025 & 2033
- Figure 2: Global APAC Rechargeable Battery Market Volume Breakdown (K Units, %) by Region 2025 & 2033
- Figure 3: India APAC Rechargeable Battery Market Revenue (billion), by Type 2025 & 2033
- Figure 4: India APAC Rechargeable Battery Market Volume (K Units), by Type 2025 & 2033
- Figure 5: India APAC Rechargeable Battery Market Revenue Share (%), by Type 2025 & 2033
- Figure 6: India APAC Rechargeable Battery Market Volume Share (%), by Type 2025 & 2033
- Figure 7: India APAC Rechargeable Battery Market Revenue (billion), by Technology 2025 & 2033
- Figure 8: India APAC Rechargeable Battery Market Volume (K Units), by Technology 2025 & 2033
- Figure 9: India APAC Rechargeable Battery Market Revenue Share (%), by Technology 2025 & 2033
- Figure 10: India APAC Rechargeable Battery Market Volume Share (%), by Technology 2025 & 2033
- Figure 11: India APAC Rechargeable Battery Market Revenue (billion), by Application 2025 & 2033
- Figure 12: India APAC Rechargeable Battery Market Volume (K Units), by Application 2025 & 2033
- Figure 13: India APAC Rechargeable Battery Market Revenue Share (%), by Application 2025 & 2033
- Figure 14: India APAC Rechargeable Battery Market Volume Share (%), by Application 2025 & 2033
- Figure 15: India APAC Rechargeable Battery Market Revenue (billion), by Geography 2025 & 2033
- Figure 16: India APAC Rechargeable Battery Market Volume (K Units), by Geography 2025 & 2033
- Figure 17: India APAC Rechargeable Battery Market Revenue Share (%), by Geography 2025 & 2033
- Figure 18: India APAC Rechargeable Battery Market Volume Share (%), by Geography 2025 & 2033
- Figure 19: India APAC Rechargeable Battery Market Revenue (billion), by Country 2025 & 2033
- Figure 20: India APAC Rechargeable Battery Market Volume (K Units), by Country 2025 & 2033
- Figure 21: India APAC Rechargeable Battery Market Revenue Share (%), by Country 2025 & 2033
- Figure 22: India APAC Rechargeable Battery Market Volume Share (%), by Country 2025 & 2033
- Figure 23: China APAC Rechargeable Battery Market Revenue (billion), by Type 2025 & 2033
- Figure 24: China APAC Rechargeable Battery Market Volume (K Units), by Type 2025 & 2033
- Figure 25: China APAC Rechargeable Battery Market Revenue Share (%), by Type 2025 & 2033
- Figure 26: China APAC Rechargeable Battery Market Volume Share (%), by Type 2025 & 2033
- Figure 27: China APAC Rechargeable Battery Market Revenue (billion), by Technology 2025 & 2033
- Figure 28: China APAC Rechargeable Battery Market Volume (K Units), by Technology 2025 & 2033
- Figure 29: China APAC Rechargeable Battery Market Revenue Share (%), by Technology 2025 & 2033
- Figure 30: China APAC Rechargeable Battery Market Volume Share (%), by Technology 2025 & 2033
- Figure 31: China APAC Rechargeable Battery Market Revenue (billion), by Application 2025 & 2033
- Figure 32: China APAC Rechargeable Battery Market Volume (K Units), by Application 2025 & 2033
- Figure 33: China APAC Rechargeable Battery Market Revenue Share (%), by Application 2025 & 2033
- Figure 34: China APAC Rechargeable Battery Market Volume Share (%), by Application 2025 & 2033
- Figure 35: China APAC Rechargeable Battery Market Revenue (billion), by Geography 2025 & 2033
- Figure 36: China APAC Rechargeable Battery Market Volume (K Units), by Geography 2025 & 2033
- Figure 37: China APAC Rechargeable Battery Market Revenue Share (%), by Geography 2025 & 2033
- Figure 38: China APAC Rechargeable Battery Market Volume Share (%), by Geography 2025 & 2033
- Figure 39: China APAC Rechargeable Battery Market Revenue (billion), by Country 2025 & 2033
- Figure 40: China APAC Rechargeable Battery Market Volume (K Units), by Country 2025 & 2033
- Figure 41: China APAC Rechargeable Battery Market Revenue Share (%), by Country 2025 & 2033
- Figure 42: China APAC Rechargeable Battery Market Volume Share (%), by Country 2025 & 2033
- Figure 43: Japan APAC Rechargeable Battery Market Revenue (billion), by Type 2025 & 2033
- Figure 44: Japan APAC Rechargeable Battery Market Volume (K Units), by Type 2025 & 2033
- Figure 45: Japan APAC Rechargeable Battery Market Revenue Share (%), by Type 2025 & 2033
- Figure 46: Japan APAC Rechargeable Battery Market Volume Share (%), by Type 2025 & 2033
- Figure 47: Japan APAC Rechargeable Battery Market Revenue (billion), by Technology 2025 & 2033
- Figure 48: Japan APAC Rechargeable Battery Market Volume (K Units), by Technology 2025 & 2033
- Figure 49: Japan APAC Rechargeable Battery Market Revenue Share (%), by Technology 2025 & 2033
- Figure 50: Japan APAC Rechargeable Battery Market Volume Share (%), by Technology 2025 & 2033
- Figure 51: Japan APAC Rechargeable Battery Market Revenue (billion), by Application 2025 & 2033
- Figure 52: Japan APAC Rechargeable Battery Market Volume (K Units), by Application 2025 & 2033
- Figure 53: Japan APAC Rechargeable Battery Market Revenue Share (%), by Application 2025 & 2033
- Figure 54: Japan APAC Rechargeable Battery Market Volume Share (%), by Application 2025 & 2033
- Figure 55: Japan APAC Rechargeable Battery Market Revenue (billion), by Geography 2025 & 2033
- Figure 56: Japan APAC Rechargeable Battery Market Volume (K Units), by Geography 2025 & 2033
- Figure 57: Japan APAC Rechargeable Battery Market Revenue Share (%), by Geography 2025 & 2033
- Figure 58: Japan APAC Rechargeable Battery Market Volume Share (%), by Geography 2025 & 2033
- Figure 59: Japan APAC Rechargeable Battery Market Revenue (billion), by Country 2025 & 2033
- Figure 60: Japan APAC Rechargeable Battery Market Volume (K Units), by Country 2025 & 2033
- Figure 61: Japan APAC Rechargeable Battery Market Revenue Share (%), by Country 2025 & 2033
- Figure 62: Japan APAC Rechargeable Battery Market Volume Share (%), by Country 2025 & 2033
- Figure 63: South Korea APAC Rechargeable Battery Market Revenue (billion), by Type 2025 & 2033
- Figure 64: South Korea APAC Rechargeable Battery Market Volume (K Units), by Type 2025 & 2033
- Figure 65: South Korea APAC Rechargeable Battery Market Revenue Share (%), by Type 2025 & 2033
- Figure 66: South Korea APAC Rechargeable Battery Market Volume Share (%), by Type 2025 & 2033
- Figure 67: South Korea APAC Rechargeable Battery Market Revenue (billion), by Technology 2025 & 2033
- Figure 68: South Korea APAC Rechargeable Battery Market Volume (K Units), by Technology 2025 & 2033
- Figure 69: South Korea APAC Rechargeable Battery Market Revenue Share (%), by Technology 2025 & 2033
- Figure 70: South Korea APAC Rechargeable Battery Market Volume Share (%), by Technology 2025 & 2033
- Figure 71: South Korea APAC Rechargeable Battery Market Revenue (billion), by Application 2025 & 2033
- Figure 72: South Korea APAC Rechargeable Battery Market Volume (K Units), by Application 2025 & 2033
- Figure 73: South Korea APAC Rechargeable Battery Market Revenue Share (%), by Application 2025 & 2033
- Figure 74: South Korea APAC Rechargeable Battery Market Volume Share (%), by Application 2025 & 2033
- Figure 75: South Korea APAC Rechargeable Battery Market Revenue (billion), by Geography 2025 & 2033
- Figure 76: South Korea APAC Rechargeable Battery Market Volume (K Units), by Geography 2025 & 2033
- Figure 77: South Korea APAC Rechargeable Battery Market Revenue Share (%), by Geography 2025 & 2033
- Figure 78: South Korea APAC Rechargeable Battery Market Volume Share (%), by Geography 2025 & 2033
- Figure 79: South Korea APAC Rechargeable Battery Market Revenue (billion), by Country 2025 & 2033
- Figure 80: South Korea APAC Rechargeable Battery Market Volume (K Units), by Country 2025 & 2033
- Figure 81: South Korea APAC Rechargeable Battery Market Revenue Share (%), by Country 2025 & 2033
- Figure 82: South Korea APAC Rechargeable Battery Market Volume Share (%), by Country 2025 & 2033
- Figure 83: Rest of Asia Pacific APAC Rechargeable Battery Market Revenue (billion), by Type 2025 & 2033
- Figure 84: Rest of Asia Pacific APAC Rechargeable Battery Market Volume (K Units), by Type 2025 & 2033
- Figure 85: Rest of Asia Pacific APAC Rechargeable Battery Market Revenue Share (%), by Type 2025 & 2033
- Figure 86: Rest of Asia Pacific APAC Rechargeable Battery Market Volume Share (%), by Type 2025 & 2033
- Figure 87: Rest of Asia Pacific APAC Rechargeable Battery Market Revenue (billion), by Technology 2025 & 2033
- Figure 88: Rest of Asia Pacific APAC Rechargeable Battery Market Volume (K Units), by Technology 2025 & 2033
- Figure 89: Rest of Asia Pacific APAC Rechargeable Battery Market Revenue Share (%), by Technology 2025 & 2033
- Figure 90: Rest of Asia Pacific APAC Rechargeable Battery Market Volume Share (%), by Technology 2025 & 2033
- Figure 91: Rest of Asia Pacific APAC Rechargeable Battery Market Revenue (billion), by Application 2025 & 2033
- Figure 92: Rest of Asia Pacific APAC Rechargeable Battery Market Volume (K Units), by Application 2025 & 2033
- Figure 93: Rest of Asia Pacific APAC Rechargeable Battery Market Revenue Share (%), by Application 2025 & 2033
- Figure 94: Rest of Asia Pacific APAC Rechargeable Battery Market Volume Share (%), by Application 2025 & 2033
- Figure 95: Rest of Asia Pacific APAC Rechargeable Battery Market Revenue (billion), by Geography 2025 & 2033
- Figure 96: Rest of Asia Pacific APAC Rechargeable Battery Market Volume (K Units), by Geography 2025 & 2033
- Figure 97: Rest of Asia Pacific APAC Rechargeable Battery Market Revenue Share (%), by Geography 2025 & 2033
- Figure 98: Rest of Asia Pacific APAC Rechargeable Battery Market Volume Share (%), by Geography 2025 & 2033
- Figure 99: Rest of Asia Pacific APAC Rechargeable Battery Market Revenue (billion), by Country 2025 & 2033
- Figure 100: Rest of Asia Pacific APAC Rechargeable Battery Market Volume (K Units), by Country 2025 & 2033
- Figure 101: Rest of Asia Pacific APAC Rechargeable Battery Market Revenue Share (%), by Country 2025 & 2033
- Figure 102: Rest of Asia Pacific APAC Rechargeable Battery Market Volume Share (%), by Country 2025 & 2033
List of Tables
- Table 1: Global APAC Rechargeable Battery Market Revenue billion Forecast, by Type 2020 & 2033
- Table 2: Global APAC Rechargeable Battery Market Volume K Units Forecast, by Type 2020 & 2033
- Table 3: Global APAC Rechargeable Battery Market Revenue billion Forecast, by Technology 2020 & 2033
- Table 4: Global APAC Rechargeable Battery Market Volume K Units Forecast, by Technology 2020 & 2033
- Table 5: Global APAC Rechargeable Battery Market Revenue billion Forecast, by Application 2020 & 2033
- Table 6: Global APAC Rechargeable Battery Market Volume K Units Forecast, by Application 2020 & 2033
- Table 7: Global APAC Rechargeable Battery Market Revenue billion Forecast, by Geography 2020 & 2033
- Table 8: Global APAC Rechargeable Battery Market Volume K Units Forecast, by Geography 2020 & 2033
- Table 9: Global APAC Rechargeable Battery Market Revenue billion Forecast, by Region 2020 & 2033
- Table 10: Global APAC Rechargeable Battery Market Volume K Units Forecast, by Region 2020 & 2033
- Table 11: Global APAC Rechargeable Battery Market Revenue billion Forecast, by Type 2020 & 2033
- Table 12: Global APAC Rechargeable Battery Market Volume K Units Forecast, by Type 2020 & 2033
- Table 13: Global APAC Rechargeable Battery Market Revenue billion Forecast, by Technology 2020 & 2033
- Table 14: Global APAC Rechargeable Battery Market Volume K Units Forecast, by Technology 2020 & 2033
- Table 15: Global APAC Rechargeable Battery Market Revenue billion Forecast, by Application 2020 & 2033
- Table 16: Global APAC Rechargeable Battery Market Volume K Units Forecast, by Application 2020 & 2033
- Table 17: Global APAC Rechargeable Battery Market Revenue billion Forecast, by Geography 2020 & 2033
- Table 18: Global APAC Rechargeable Battery Market Volume K Units Forecast, by Geography 2020 & 2033
- Table 19: Global APAC Rechargeable Battery Market Revenue billion Forecast, by Country 2020 & 2033
- Table 20: Global APAC Rechargeable Battery Market Volume K Units Forecast, by Country 2020 & 2033
- Table 21: Global APAC Rechargeable Battery Market Revenue billion Forecast, by Type 2020 & 2033
- Table 22: Global APAC Rechargeable Battery Market Volume K Units Forecast, by Type 2020 & 2033
- Table 23: Global APAC Rechargeable Battery Market Revenue billion Forecast, by Technology 2020 & 2033
- Table 24: Global APAC Rechargeable Battery Market Volume K Units Forecast, by Technology 2020 & 2033
- Table 25: Global APAC Rechargeable Battery Market Revenue billion Forecast, by Application 2020 & 2033
- Table 26: Global APAC Rechargeable Battery Market Volume K Units Forecast, by Application 2020 & 2033
- Table 27: Global APAC Rechargeable Battery Market Revenue billion Forecast, by Geography 2020 & 2033
- Table 28: Global APAC Rechargeable Battery Market Volume K Units Forecast, by Geography 2020 & 2033
- Table 29: Global APAC Rechargeable Battery Market Revenue billion Forecast, by Country 2020 & 2033
- Table 30: Global APAC Rechargeable Battery Market Volume K Units Forecast, by Country 2020 & 2033
- Table 31: Global APAC Rechargeable Battery Market Revenue billion Forecast, by Type 2020 & 2033
- Table 32: Global APAC Rechargeable Battery Market Volume K Units Forecast, by Type 2020 & 2033
- Table 33: Global APAC Rechargeable Battery Market Revenue billion Forecast, by Technology 2020 & 2033
- Table 34: Global APAC Rechargeable Battery Market Volume K Units Forecast, by Technology 2020 & 2033
- Table 35: Global APAC Rechargeable Battery Market Revenue billion Forecast, by Application 2020 & 2033
- Table 36: Global APAC Rechargeable Battery Market Volume K Units Forecast, by Application 2020 & 2033
- Table 37: Global APAC Rechargeable Battery Market Revenue billion Forecast, by Geography 2020 & 2033
- Table 38: Global APAC Rechargeable Battery Market Volume K Units Forecast, by Geography 2020 & 2033
- Table 39: Global APAC Rechargeable Battery Market Revenue billion Forecast, by Country 2020 & 2033
- Table 40: Global APAC Rechargeable Battery Market Volume K Units Forecast, by Country 2020 & 2033
- Table 41: Global APAC Rechargeable Battery Market Revenue billion Forecast, by Type 2020 & 2033
- Table 42: Global APAC Rechargeable Battery Market Volume K Units Forecast, by Type 2020 & 2033
- Table 43: Global APAC Rechargeable Battery Market Revenue billion Forecast, by Technology 2020 & 2033
- Table 44: Global APAC Rechargeable Battery Market Volume K Units Forecast, by Technology 2020 & 2033
- Table 45: Global APAC Rechargeable Battery Market Revenue billion Forecast, by Application 2020 & 2033
- Table 46: Global APAC Rechargeable Battery Market Volume K Units Forecast, by Application 2020 & 2033
- Table 47: Global APAC Rechargeable Battery Market Revenue billion Forecast, by Geography 2020 & 2033
- Table 48: Global APAC Rechargeable Battery Market Volume K Units Forecast, by Geography 2020 & 2033
- Table 49: Global APAC Rechargeable Battery Market Revenue billion Forecast, by Country 2020 & 2033
- Table 50: Global APAC Rechargeable Battery Market Volume K Units Forecast, by Country 2020 & 2033
- Table 51: Global APAC Rechargeable Battery Market Revenue billion Forecast, by Type 2020 & 2033
- Table 52: Global APAC Rechargeable Battery Market Volume K Units Forecast, by Type 2020 & 2033
- Table 53: Global APAC Rechargeable Battery Market Revenue billion Forecast, by Technology 2020 & 2033
- Table 54: Global APAC Rechargeable Battery Market Volume K Units Forecast, by Technology 2020 & 2033
- Table 55: Global APAC Rechargeable Battery Market Revenue billion Forecast, by Application 2020 & 2033
- Table 56: Global APAC Rechargeable Battery Market Volume K Units Forecast, by Application 2020 & 2033
- Table 57: Global APAC Rechargeable Battery Market Revenue billion Forecast, by Geography 2020 & 2033
- Table 58: Global APAC Rechargeable Battery Market Volume K Units Forecast, by Geography 2020 & 2033
- Table 59: Global APAC Rechargeable Battery Market Revenue billion Forecast, by Country 2020 & 2033
- Table 60: Global APAC Rechargeable Battery Market Volume K Units Forecast, by Country 2020 & 2033
Frequently Asked Questions
1. What is the projected Compound Annual Growth Rate (CAGR) of the APAC Rechargeable Battery Market?
The projected CAGR is approximately 7.49%.
2. Which companies are prominent players in the APAC Rechargeable Battery Market?
Key companies in the market include BYD Co Ltd, EnerSys, Contemporary Amperex Technology Co Limited, Saft Groupe SA, Samsung SDI Co Ltd, LG Chem Ltd, Tesla Inc, Clarios International Inc, GS Yuasa Corporation, Duracell Inc, TianJin Lishen Battery Joint-Stock Co Ltd *List Not Exhaustive, Panasonic Corporation.
3. What are the main segments of the APAC Rechargeable Battery Market?
The market segments include Type, Technology, Application, Geography.
4. Can you provide details about the market size?
The market size is estimated to be USD 136.17 billion as of 2022.
5. What are some drivers contributing to market growth?
Increasing Demand for Natural Gas and Developing Gas Infrastructure 4.; Increasing Offshore Oil & Gas Exploration Activities.
6. What are the notable trends driving market growth?
Automotive Battery Segment to Witness Significant Growth.
7. Are there any restraints impacting market growth?
Adoption of Cleaner Alternatives4.; High Volatility of Crude Oil Prices.
8. Can you provide examples of recent developments in the market?
January 2022: China Lithium Battery Technology signed two contracts with two cities in the southern Chinese province of Guangdong to build new production facilities with an annual capacity of 50 GWh. The factories will be located in Guangzhou and Jiangmen.
9. What pricing options are available for accessing the report?
Pricing options include single-user, multi-user, and enterprise licenses priced at USD 4750, USD 5250, and USD 8750 respectively.
10. Is the market size provided in terms of value or volume?
The market size is provided in terms of value, measured in billion and volume, measured in K Units.
11. Are there any specific market keywords associated with the report?
Yes, the market keyword associated with the report is "APAC Rechargeable Battery Market," which aids in identifying and referencing the specific market segment covered.
12. How do I determine which pricing option suits my needs best?
The pricing options vary based on user requirements and access needs. Individual users may opt for single-user licenses, while businesses requiring broader access may choose multi-user or enterprise licenses for cost-effective access to the report.
13. Are there any additional resources or data provided in the APAC Rechargeable Battery Market report?
While the report offers comprehensive insights, it's advisable to review the specific contents or supplementary materials provided to ascertain if additional resources or data are available.
14. How can I stay updated on further developments or reports in the APAC Rechargeable Battery Market?
To stay informed about further developments, trends, and reports in the APAC Rechargeable Battery Market, consider subscribing to industry newsletters, following relevant companies and organizations, or regularly checking reputable industry news sources and publications.
Methodology
Step 1 - Identification of Relevant Samples Size from Population Database


Step 2 - Approaches for Defining Global Market Size (Value, Volume* & Price*)

Note*: In applicable scenarios
Step 3 - Data Sources
Primary Research
- Web Analytics
- Survey Reports
- Research Institute
- Latest Research Reports
- Opinion Leaders
Secondary Research
- Annual Reports
- White Paper
- Latest Press Release
- Industry Association
- Paid Database
- Investor Presentations

Step 4 - Data Triangulation
Involves using different sources of information in order to increase the validity of a study
These sources are likely to be stakeholders in a program - participants, other researchers, program staff, other community members, and so on.
Then we put all data in single framework & apply various statistical tools to find out the dynamic on the market.
During the analysis stage, feedback from the stakeholder groups would be compared to determine areas of agreement as well as areas of divergence