

Key Insights
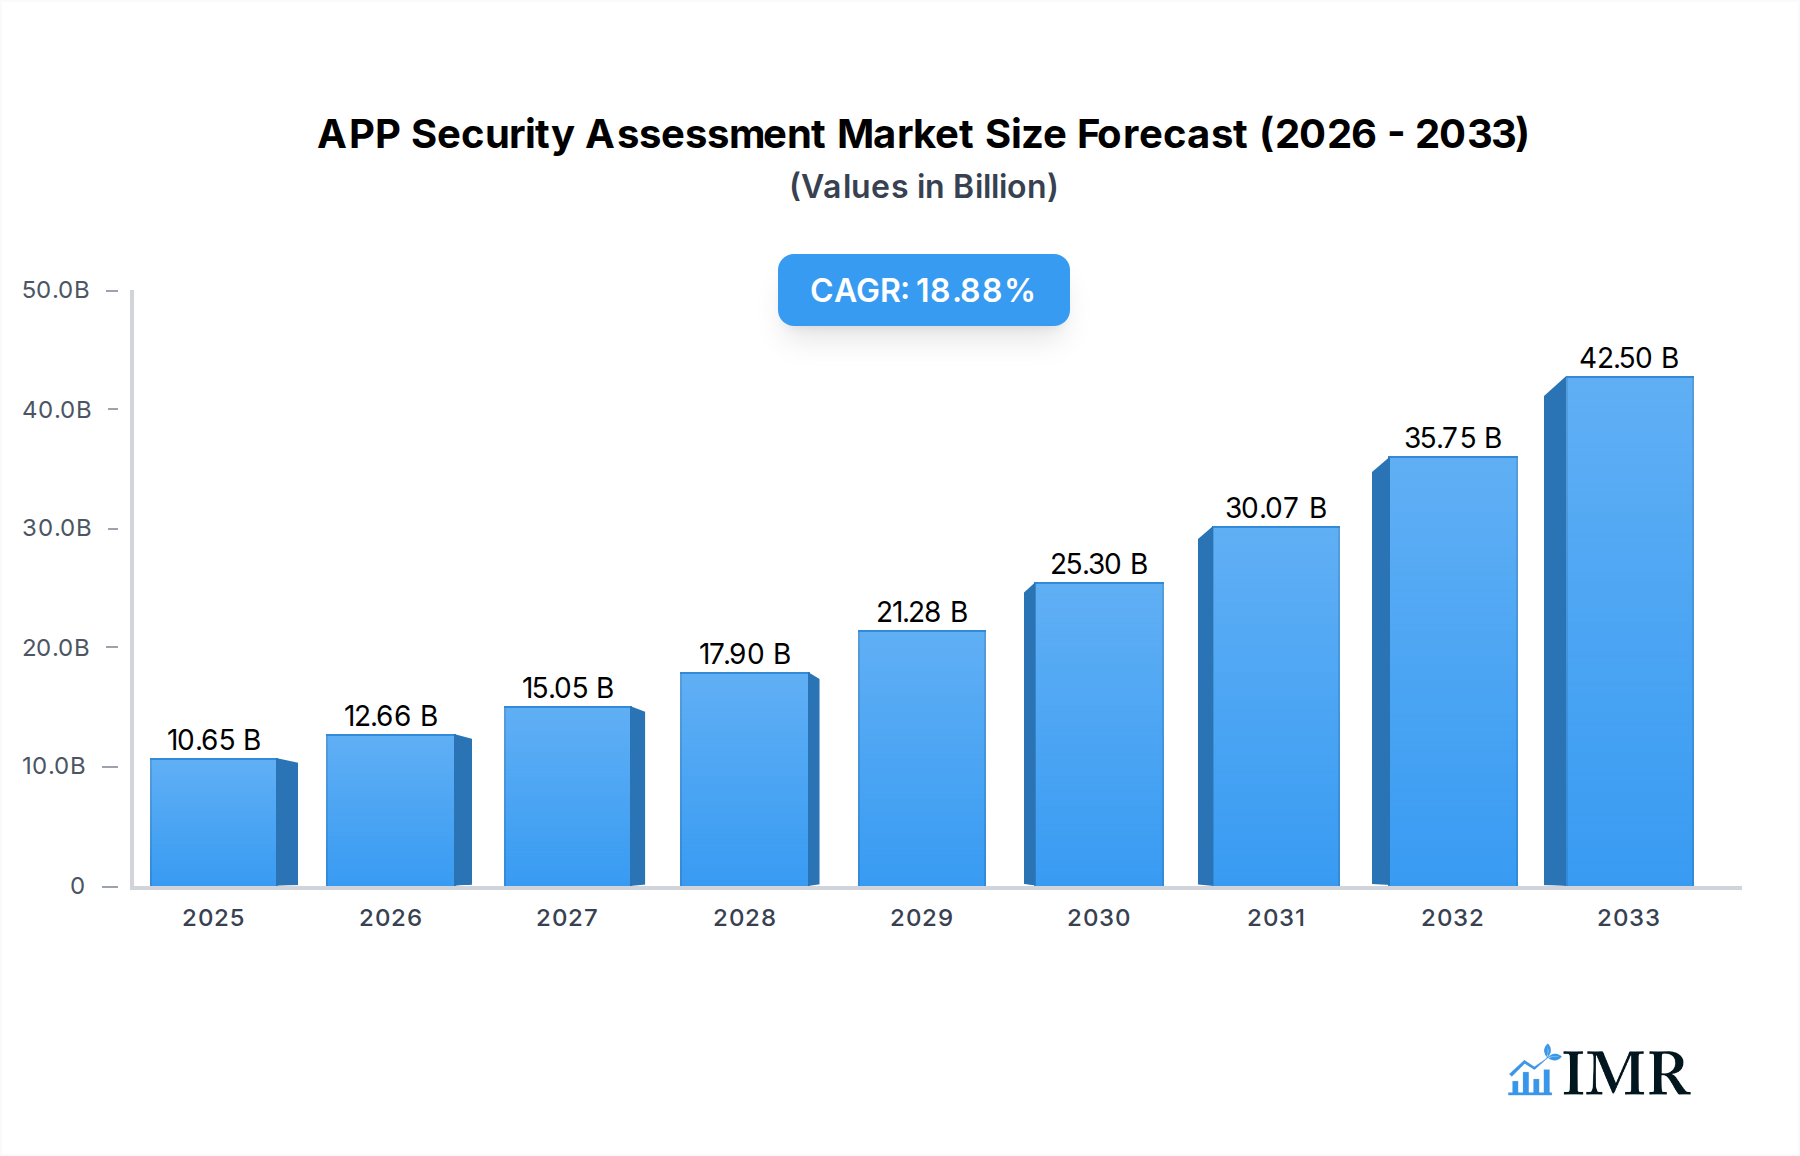
The Application Security Assessment market is poised for substantial growth, reaching an estimated $10.65 billion in 2025 and projected to expand at a robust CAGR of 18.8% through 2033. This rapid expansion is fueled by a confluence of factors, including the escalating sophistication of cyber threats targeting software, the increasing regulatory landscape demanding robust data protection, and the growing adoption of cloud-native applications and DevOps practices. Enterprises of all sizes, from large corporations to small and medium-sized businesses (SMEs), are recognizing the critical need to integrate security throughout the software development lifecycle. This proactive approach to identifying and mitigating vulnerabilities is no longer an afterthought but a core strategic imperative. The shift towards cloud-based solutions is a significant driver, offering scalability, flexibility, and cost-effectiveness, thereby democratizing access to advanced application security tools and services for a wider range of organizations.

APP Security Assessment Market Size (In Billion)
The market is characterized by distinct trends, including the rise of automated security testing tools, the integration of AI and machine learning for enhanced threat detection, and a growing emphasis on DevSecOps methodologies that embed security within development workflows. While these drivers propel growth, certain restraints, such as the shortage of skilled cybersecurity professionals and the complexity of integrating new security solutions into existing IT infrastructures, warrant careful consideration. Nevertheless, the overwhelming demand for secure applications in an increasingly digital world ensures a dynamic and promising future for the Application Security Assessment market. Key players are innovating with comprehensive platform solutions, offering services across the spectrum from static to dynamic analysis and runtime protection, catering to diverse application architectures and deployment models.
APP Security Assessment Company Market Share
APP Security Assessment Market Report: Comprehensive Analysis and Future Outlook (2019-2033)
This report provides an in-depth analysis of the global APP Security Assessment market, offering strategic insights for stakeholders navigating this dynamic landscape. The study covers the historical period from 2019 to 2024, the base year 2025, and forecasts market evolution through 2033. With an estimated market size of $XX billion in 2025, the APP Security Assessment sector is poised for significant expansion.
APP Security Assessment Market Dynamics & Structure
The APP Security Assessment market is characterized by a moderately concentrated structure, with leading players like Veracode, Checkmarx, and PortSwigger holding substantial market shares. Technological innovation is a primary driver, fueled by the escalating sophistication of cyber threats and the continuous evolution of software development methodologies. Regulatory frameworks, such as GDPR and CCPA, are increasingly mandating robust application security practices, further stimulating market demand. Competitive product substitutes, while present in the form of manual testing or basic vulnerability scanners, are largely being overshadowed by advanced, automated APP security assessment solutions. End-user demographics span both Large Enterprises and SMEs, each with distinct security needs and adoption capabilities. Mergers and acquisitions (M&A) are a notable trend, as companies seek to consolidate market presence, expand their service portfolios, and acquire innovative technologies. For instance, in the historical period, over 50 M&A deals were observed, signifying a robust consolidation phase. Barriers to innovation are relatively low, primarily due to the readily available cloud infrastructure and open-source tools that facilitate rapid development and deployment of new security solutions.
- Market Concentration: Moderate, with a few key players dominating.
- Technological Innovation: Driven by evolving cyber threats and secure coding practices.
- Regulatory Frameworks: Increasing mandates for application security compliance.
- Competitive Landscape: Shifting towards advanced automated solutions over manual testing.
- End-User Segments: Large Enterprises and SMEs are key adopters.
- M&A Activity: Active consolidation for market expansion and technology acquisition.
- Innovation Barriers: Low, supported by cloud and open-source ecosystems.
APP Security Assessment Growth Trends & Insights
The APP Security Assessment market is projected to experience robust growth, driven by the escalating volume and complexity of cyber threats targeting applications across various industries. The market size is anticipated to grow from approximately $XX billion in 2025 to an estimated $YY billion by 2033, reflecting a Compound Annual Growth Rate (CAGR) of over 15%. Adoption rates for APP security assessment solutions are rapidly increasing across both Large Enterprises and SMEs, a trend amplified by the shift towards cloud-based applications. The proliferation of mobile applications and the increasing reliance on web applications for critical business functions necessitate comprehensive security testing at every stage of the software development lifecycle (SDLC). Technological disruptions, such as the integration of Artificial Intelligence (AI) and Machine Learning (ML) into security assessment tools, are enhancing detection capabilities and reducing false positives. Consumer behavior shifts, with an increased awareness of data privacy and security breaches among end-users, are also indirectly driving demand as organizations prioritize application security to maintain customer trust and brand reputation. The market penetration of advanced APP security assessment tools is expected to surpass 60% by 2033, indicating a significant shift from traditional security measures. The increasing adoption of DevSecOps practices further integrates security into the development pipeline, promoting proactive rather than reactive security measures. This integrated approach leads to more resilient applications and reduces the overall cost of security incidents. Furthermore, the growing interconnectedness of systems and the rise of IoT devices create new attack vectors, underscoring the critical need for comprehensive APP security assessments.
Dominant Regions, Countries, or Segments in APP Security Assessment
The North America region, particularly the United States, is projected to be the dominant force in the APP Security Assessment market. This dominance is attributed to a confluence of factors, including a high concentration of technology companies, a mature cybersecurity market, and stringent regulatory enforcement. Large Enterprises in North America are at the forefront of adopting advanced APP security assessment solutions, driven by the need to protect sensitive customer data and maintain competitive advantage in a highly digitized economy. The estimated market share for North America in 2025 is expected to be around 40%, translating to an approximate market value of $XX billion. Key drivers of this dominance include significant investments in cybersecurity research and development, a robust ecosystem of cybersecurity vendors, and a proactive approach to threat intelligence. The U.S. government's emphasis on cybersecurity, coupled with significant private sector investment, has created an environment where application security is a top priority.
In terms of application types, Cloud-based APP security assessment solutions are experiencing the most rapid growth and are expected to capture a larger market share in the forecast period. This is intrinsically linked to the global migration of applications and infrastructure to cloud environments. SMEs, in particular, are increasingly opting for cloud-based solutions due to their scalability, cost-effectiveness, and ease of deployment compared to on-premise alternatives. The market share for cloud-based solutions is projected to grow from 55% in 2025 to over 70% by 2033. The agility and continuous updating capabilities of cloud platforms align perfectly with the evolving threat landscape, making them the preferred choice for modern application security. While on-premise solutions will continue to cater to specific industries with high regulatory compliance needs or unique infrastructure requirements, the overall trend favors the flexibility and accessibility of cloud-based APP security assessment.
- Dominant Region: North America, with the United States as a key market.
- Key Drivers (North America): High tech industry presence, stringent regulations, substantial cybersecurity investments, robust vendor ecosystem.
- Dominant Segment (Application Type): Cloud-based APP security assessment solutions.
- Drivers for Cloud-based Solutions: Scalability, cost-effectiveness, ease of deployment, continuous updates, alignment with modern IT infrastructure.
- Growth Potential for SMEs: Cloud solutions offer accessibility and affordability.
- Market Share Projection (Cloud-based): Increasing from 55% in 2025 to over 70% by 2033.
APP Security Assessment Product Landscape
The APP Security Assessment product landscape is witnessing rapid innovation, with solutions increasingly integrating AI and ML for more intelligent vulnerability detection and remediation. Vendors are focusing on providing comprehensive testing across the entire SDLC, from static analysis (SAST) to dynamic analysis (DAST), interactive application security testing (IAST), and software composition analysis (SCA). Key product differentiators include superior accuracy in identifying zero-day vulnerabilities, seamless integration with CI/CD pipelines, and robust reporting capabilities that provide actionable insights for developers and security teams. Companies like Veracode and Checkmarx are at the forefront, offering platforms that automate security testing and provide continuous monitoring. The performance metrics are evolving beyond simple vulnerability counts to focus on the risk reduction impact and the efficiency of the security assessment process.
Key Drivers, Barriers & Challenges in APP Security Assessment
The APP Security Assessment market is propelled by several key drivers, including the escalating cyber threat landscape, the increasing regulatory pressure for data protection, and the growing adoption of DevSecOps methodologies. The rising complexity of applications, coupled with the proliferation of APIs and microservices, creates new attack surfaces that necessitate rigorous security assessments.
- Key Drivers:
- Evolving Cyber Threats: Sophisticated attacks demand proactive security.
- Regulatory Compliance: GDPR, CCPA, and other mandates drive adoption.
- DevSecOps Integration: Embedding security throughout the SDLC.
- Application Complexity: The rise of APIs and microservices.
Conversely, the market faces challenges such as the shortage of skilled cybersecurity professionals, the complexity of integrating security tools into existing workflows, and the potential for false positives and negatives in automated testing. Supply chain issues can also impact the availability of specialized security solutions, and evolving threat vectors require continuous adaptation of assessment strategies.
- Key Challenges and Restraints:
- Talent Shortage: Lack of skilled application security experts.
- Integration Complexity: Difficulty in embedding tools into diverse workflows.
- False Positives/Negatives: Accuracy concerns in automated testing.
- Evolving Threat Landscape: Need for continuous adaptation of tools and techniques.
- Cost of Advanced Solutions: Can be a barrier for smaller organizations.
Emerging Opportunities in APP Security Assessment
Emerging opportunities in the APP Security Assessment market lie in the growing demand for specialized security testing for AI-powered applications, blockchain technologies, and the Internet of Things (IoT). There is a significant untapped market in providing tailored APP security assessment services for SMEs that lack in-house expertise. Furthermore, the development of AI-driven, predictive security assessment tools that can anticipate future vulnerabilities presents a significant avenue for innovation. The increasing focus on supply chain security also opens doors for solutions that can assess the security posture of third-party components and libraries.
Growth Accelerators in the APP Security Assessment Industry
Several catalysts are accelerating the growth of the APP Security Assessment industry. Technological breakthroughs, such as the advancement of AI and ML for intelligent threat detection and automated remediation, are significantly enhancing the effectiveness of assessment tools. Strategic partnerships between cybersecurity vendors, cloud providers, and software development platforms are creating integrated ecosystems that streamline security testing. Market expansion strategies, including the development of localized solutions for emerging economies and the offering of specialized services for niche industries, are also contributing to sustained growth.
Key Players Shaping the APP Security Assessment Market
- Veracode
- Checkmarx
- PortSwigger
- Micro Focus
- NTT Application Security
- Qualys
- Invicti Security
- CrowdStrike
- Wonfone Technology
- 360
- GuidePoint Security
- Data Theorem
- Parasoft
- Zimperium
Notable Milestones in APP Security Assessment Sector
- 2019: Increased regulatory focus on data privacy with GDPR enforcement impacting application security requirements globally.
- 2020: Accelerated adoption of cloud-based development and remote work, increasing the attack surface and demand for cloud security testing.
- 2021: Significant rise in sophisticated ransomware attacks targeting enterprise applications, highlighting the need for robust APP security.
- 2022: Growth in the adoption of DevSecOps practices, integrating security earlier in the software development lifecycle.
- 2023: Advancements in AI and ML capabilities enabling more accurate and efficient application vulnerability detection.
- 2024: Increased market consolidation through strategic M&A activities as vendors expand their portfolios and market reach.
In-Depth APP Security Assessment Market Outlook
The APP Security Assessment market outlook remains exceptionally strong, driven by persistent cybersecurity threats and evolving regulatory landscapes. Growth accelerators such as AI-driven automation, the expansion of cloud-native security, and the integration of security into the entire DevOps pipeline will continue to fuel market expansion. Strategic partnerships and the development of comprehensive, end-to-end security solutions will be critical for vendors to capitalize on emerging opportunities. The increasing demand for application security across all business sizes and sectors positions the APP Security Assessment market for sustained and significant growth in the coming years.
APP Security Assessment Segmentation
-
1. Application
- 1.1. Large Enterprises
- 1.2. SMEs
-
2. Types
- 2.1. On-premise
- 2.2. Cloud-based
APP Security Assessment Segmentation By Geography
-
1. North America
- 1.1. United States
- 1.2. Canada
- 1.3. Mexico
-
2. South America
- 2.1. Brazil
- 2.2. Argentina
- 2.3. Rest of South America
-
3. Europe
- 3.1. United Kingdom
- 3.2. Germany
- 3.3. France
- 3.4. Italy
- 3.5. Spain
- 3.6. Russia
- 3.7. Benelux
- 3.8. Nordics
- 3.9. Rest of Europe
-
4. Middle East & Africa
- 4.1. Turkey
- 4.2. Israel
- 4.3. GCC
- 4.4. North Africa
- 4.5. South Africa
- 4.6. Rest of Middle East & Africa
-
5. Asia Pacific
- 5.1. China
- 5.2. India
- 5.3. Japan
- 5.4. South Korea
- 5.5. ASEAN
- 5.6. Oceania
- 5.7. Rest of Asia Pacific

APP Security Assessment Regional Market Share
Geographic Coverage of APP Security Assessment
APP Security Assessment REPORT HIGHLIGHTS
| Aspects | Details |
|---|---|
| Study Period | 2020-2034 |
| Base Year | 2025 |
| Estimated Year | 2026 |
| Forecast Period | 2026-2034 |
| Historical Period | 2020-2025 |
| Growth Rate | CAGR of 18.8% from 2020-2034 |
| Segmentation |
|
Table of Contents
- 1. Introduction
- 1.1. Research Scope
- 1.2. Market Segmentation
- 1.3. Research Objective
- 1.4. Definitions and Assumptions
- 2. Executive Summary
- 2.1. Market Snapshot
- 3. Market Dynamics
- 3.1. Market Drivers
- 3.2. Market Restrains
- 3.3. Market Trends
- 3.4. Market Opportunities
- 4. Market Factor Analysis
- 4.1. Porters Five Forces
- 4.1.1. Bargaining Power of Suppliers
- 4.1.2. Bargaining Power of Buyers
- 4.1.3. Threat of New Entrants
- 4.1.4. Threat of Substitutes
- 4.1.5. Competitive Rivalry
- 4.2. PESTEL analysis
- 4.3. BCG Analysis
- 4.3.1. Stars (High Growth, High Market Share)
- 4.3.2. Cash Cows (Low Growth, High Market Share)
- 4.3.3. Question Mark (High Growth, Low Market Share)
- 4.3.4. Dogs (Low Growth, Low Market Share)
- 4.4. Ansoff Matrix Analysis
- 4.5. Supply Chain Analysis
- 4.6. Regulatory Landscape
- 4.7. Current Market Potential and Opportunity Assessment (TAM–SAM–SOM Framework)
- 4.8. IMR Analyst Note
- 4.1. Porters Five Forces
- 5. Market Analysis, Insights and Forecast 2021-2033
- 5.1. Market Analysis, Insights and Forecast - by Application
- 5.1.1. Large Enterprises
- 5.1.2. SMEs
- 5.2. Market Analysis, Insights and Forecast - by Types
- 5.2.1. On-premise
- 5.2.2. Cloud-based
- 5.3. Market Analysis, Insights and Forecast - by Region
- 5.3.1. North America
- 5.3.2. South America
- 5.3.3. Europe
- 5.3.4. Middle East & Africa
- 5.3.5. Asia Pacific
- 5.1. Market Analysis, Insights and Forecast - by Application
- 6. Global APP Security Assessment Analysis, Insights and Forecast, 2021-2033
- 6.1. Market Analysis, Insights and Forecast - by Application
- 6.1.1. Large Enterprises
- 6.1.2. SMEs
- 6.2. Market Analysis, Insights and Forecast - by Types
- 6.2.1. On-premise
- 6.2.2. Cloud-based
- 6.1. Market Analysis, Insights and Forecast - by Application
- 7. North America APP Security Assessment Analysis, Insights and Forecast, 2020-2032
- 7.1. Market Analysis, Insights and Forecast - by Application
- 7.1.1. Large Enterprises
- 7.1.2. SMEs
- 7.2. Market Analysis, Insights and Forecast - by Types
- 7.2.1. On-premise
- 7.2.2. Cloud-based
- 7.1. Market Analysis, Insights and Forecast - by Application
- 8. South America APP Security Assessment Analysis, Insights and Forecast, 2020-2032
- 8.1. Market Analysis, Insights and Forecast - by Application
- 8.1.1. Large Enterprises
- 8.1.2. SMEs
- 8.2. Market Analysis, Insights and Forecast - by Types
- 8.2.1. On-premise
- 8.2.2. Cloud-based
- 8.1. Market Analysis, Insights and Forecast - by Application
- 9. Europe APP Security Assessment Analysis, Insights and Forecast, 2020-2032
- 9.1. Market Analysis, Insights and Forecast - by Application
- 9.1.1. Large Enterprises
- 9.1.2. SMEs
- 9.2. Market Analysis, Insights and Forecast - by Types
- 9.2.1. On-premise
- 9.2.2. Cloud-based
- 9.1. Market Analysis, Insights and Forecast - by Application
- 10. Middle East & Africa APP Security Assessment Analysis, Insights and Forecast, 2020-2032
- 10.1. Market Analysis, Insights and Forecast - by Application
- 10.1.1. Large Enterprises
- 10.1.2. SMEs
- 10.2. Market Analysis, Insights and Forecast - by Types
- 10.2.1. On-premise
- 10.2.2. Cloud-based
- 10.1. Market Analysis, Insights and Forecast - by Application
- 11. Asia Pacific APP Security Assessment Analysis, Insights and Forecast, 2020-2032
- 11.1. Market Analysis, Insights and Forecast - by Application
- 11.1.1. Large Enterprises
- 11.1.2. SMEs
- 11.2. Market Analysis, Insights and Forecast - by Types
- 11.2.1. On-premise
- 11.2.2. Cloud-based
- 11.1. Market Analysis, Insights and Forecast - by Application
- 12. Competitive Analysis
- 12.1. Company Profiles
- 12.1.1 Veracode
- 12.1.1.1. Company Overview
- 12.1.1.2. Products
- 12.1.1.3. Company Financials
- 12.1.1.4. SWOT Analysis
- 12.1.2 Checkmarx
- 12.1.2.1. Company Overview
- 12.1.2.2. Products
- 12.1.2.3. Company Financials
- 12.1.2.4. SWOT Analysis
- 12.1.3 PortSwigger
- 12.1.3.1. Company Overview
- 12.1.3.2. Products
- 12.1.3.3. Company Financials
- 12.1.3.4. SWOT Analysis
- 12.1.4 Micro Focus
- 12.1.4.1. Company Overview
- 12.1.4.2. Products
- 12.1.4.3. Company Financials
- 12.1.4.4. SWOT Analysis
- 12.1.5 NTT Application Security
- 12.1.5.1. Company Overview
- 12.1.5.2. Products
- 12.1.5.3. Company Financials
- 12.1.5.4. SWOT Analysis
- 12.1.6 Qualys
- 12.1.6.1. Company Overview
- 12.1.6.2. Products
- 12.1.6.3. Company Financials
- 12.1.6.4. SWOT Analysis
- 12.1.7 Invicti Security
- 12.1.7.1. Company Overview
- 12.1.7.2. Products
- 12.1.7.3. Company Financials
- 12.1.7.4. SWOT Analysis
- 12.1.8 CrowdStrike
- 12.1.8.1. Company Overview
- 12.1.8.2. Products
- 12.1.8.3. Company Financials
- 12.1.8.4. SWOT Analysis
- 12.1.9 Wonfone Technology
- 12.1.9.1. Company Overview
- 12.1.9.2. Products
- 12.1.9.3. Company Financials
- 12.1.9.4. SWOT Analysis
- 12.1.10 360
- 12.1.10.1. Company Overview
- 12.1.10.2. Products
- 12.1.10.3. Company Financials
- 12.1.10.4. SWOT Analysis
- 12.1.11 GuidePoint Security
- 12.1.11.1. Company Overview
- 12.1.11.2. Products
- 12.1.11.3. Company Financials
- 12.1.11.4. SWOT Analysis
- 12.1.12 Data Theorem
- 12.1.12.1. Company Overview
- 12.1.12.2. Products
- 12.1.12.3. Company Financials
- 12.1.12.4. SWOT Analysis
- 12.1.13 Parasoft
- 12.1.13.1. Company Overview
- 12.1.13.2. Products
- 12.1.13.3. Company Financials
- 12.1.13.4. SWOT Analysis
- 12.1.14 Zimperium
- 12.1.14.1. Company Overview
- 12.1.14.2. Products
- 12.1.14.3. Company Financials
- 12.1.14.4. SWOT Analysis
- 12.1.1 Veracode
- 12.2. Market Entropy
- 12.2.1 Company's Key Areas Served
- 12.2.2 Recent Developments
- 12.3. Company Market Share Analysis 2025
- 12.3.1 Top 5 Companies Market Share Analysis
- 12.3.2 Top 3 Companies Market Share Analysis
- 12.4. List of Potential Customers
- 13. Research Methodology
List of Figures
- Figure 1: Global APP Security Assessment Revenue Breakdown (undefined, %) by Region 2025 & 2033
- Figure 2: North America APP Security Assessment Revenue (undefined), by Application 2025 & 2033
- Figure 3: North America APP Security Assessment Revenue Share (%), by Application 2025 & 2033
- Figure 4: North America APP Security Assessment Revenue (undefined), by Types 2025 & 2033
- Figure 5: North America APP Security Assessment Revenue Share (%), by Types 2025 & 2033
- Figure 6: North America APP Security Assessment Revenue (undefined), by Country 2025 & 2033
- Figure 7: North America APP Security Assessment Revenue Share (%), by Country 2025 & 2033
- Figure 8: South America APP Security Assessment Revenue (undefined), by Application 2025 & 2033
- Figure 9: South America APP Security Assessment Revenue Share (%), by Application 2025 & 2033
- Figure 10: South America APP Security Assessment Revenue (undefined), by Types 2025 & 2033
- Figure 11: South America APP Security Assessment Revenue Share (%), by Types 2025 & 2033
- Figure 12: South America APP Security Assessment Revenue (undefined), by Country 2025 & 2033
- Figure 13: South America APP Security Assessment Revenue Share (%), by Country 2025 & 2033
- Figure 14: Europe APP Security Assessment Revenue (undefined), by Application 2025 & 2033
- Figure 15: Europe APP Security Assessment Revenue Share (%), by Application 2025 & 2033
- Figure 16: Europe APP Security Assessment Revenue (undefined), by Types 2025 & 2033
- Figure 17: Europe APP Security Assessment Revenue Share (%), by Types 2025 & 2033
- Figure 18: Europe APP Security Assessment Revenue (undefined), by Country 2025 & 2033
- Figure 19: Europe APP Security Assessment Revenue Share (%), by Country 2025 & 2033
- Figure 20: Middle East & Africa APP Security Assessment Revenue (undefined), by Application 2025 & 2033
- Figure 21: Middle East & Africa APP Security Assessment Revenue Share (%), by Application 2025 & 2033
- Figure 22: Middle East & Africa APP Security Assessment Revenue (undefined), by Types 2025 & 2033
- Figure 23: Middle East & Africa APP Security Assessment Revenue Share (%), by Types 2025 & 2033
- Figure 24: Middle East & Africa APP Security Assessment Revenue (undefined), by Country 2025 & 2033
- Figure 25: Middle East & Africa APP Security Assessment Revenue Share (%), by Country 2025 & 2033
- Figure 26: Asia Pacific APP Security Assessment Revenue (undefined), by Application 2025 & 2033
- Figure 27: Asia Pacific APP Security Assessment Revenue Share (%), by Application 2025 & 2033
- Figure 28: Asia Pacific APP Security Assessment Revenue (undefined), by Types 2025 & 2033
- Figure 29: Asia Pacific APP Security Assessment Revenue Share (%), by Types 2025 & 2033
- Figure 30: Asia Pacific APP Security Assessment Revenue (undefined), by Country 2025 & 2033
- Figure 31: Asia Pacific APP Security Assessment Revenue Share (%), by Country 2025 & 2033
List of Tables
- Table 1: Global APP Security Assessment Revenue undefined Forecast, by Application 2020 & 2033
- Table 2: Global APP Security Assessment Revenue undefined Forecast, by Types 2020 & 2033
- Table 3: Global APP Security Assessment Revenue undefined Forecast, by Region 2020 & 2033
- Table 4: Global APP Security Assessment Revenue undefined Forecast, by Application 2020 & 2033
- Table 5: Global APP Security Assessment Revenue undefined Forecast, by Types 2020 & 2033
- Table 6: Global APP Security Assessment Revenue undefined Forecast, by Country 2020 & 2033
- Table 7: United States APP Security Assessment Revenue (undefined) Forecast, by Application 2020 & 2033
- Table 8: Canada APP Security Assessment Revenue (undefined) Forecast, by Application 2020 & 2033
- Table 9: Mexico APP Security Assessment Revenue (undefined) Forecast, by Application 2020 & 2033
- Table 10: Global APP Security Assessment Revenue undefined Forecast, by Application 2020 & 2033
- Table 11: Global APP Security Assessment Revenue undefined Forecast, by Types 2020 & 2033
- Table 12: Global APP Security Assessment Revenue undefined Forecast, by Country 2020 & 2033
- Table 13: Brazil APP Security Assessment Revenue (undefined) Forecast, by Application 2020 & 2033
- Table 14: Argentina APP Security Assessment Revenue (undefined) Forecast, by Application 2020 & 2033
- Table 15: Rest of South America APP Security Assessment Revenue (undefined) Forecast, by Application 2020 & 2033
- Table 16: Global APP Security Assessment Revenue undefined Forecast, by Application 2020 & 2033
- Table 17: Global APP Security Assessment Revenue undefined Forecast, by Types 2020 & 2033
- Table 18: Global APP Security Assessment Revenue undefined Forecast, by Country 2020 & 2033
- Table 19: United Kingdom APP Security Assessment Revenue (undefined) Forecast, by Application 2020 & 2033
- Table 20: Germany APP Security Assessment Revenue (undefined) Forecast, by Application 2020 & 2033
- Table 21: France APP Security Assessment Revenue (undefined) Forecast, by Application 2020 & 2033
- Table 22: Italy APP Security Assessment Revenue (undefined) Forecast, by Application 2020 & 2033
- Table 23: Spain APP Security Assessment Revenue (undefined) Forecast, by Application 2020 & 2033
- Table 24: Russia APP Security Assessment Revenue (undefined) Forecast, by Application 2020 & 2033
- Table 25: Benelux APP Security Assessment Revenue (undefined) Forecast, by Application 2020 & 2033
- Table 26: Nordics APP Security Assessment Revenue (undefined) Forecast, by Application 2020 & 2033
- Table 27: Rest of Europe APP Security Assessment Revenue (undefined) Forecast, by Application 2020 & 2033
- Table 28: Global APP Security Assessment Revenue undefined Forecast, by Application 2020 & 2033
- Table 29: Global APP Security Assessment Revenue undefined Forecast, by Types 2020 & 2033
- Table 30: Global APP Security Assessment Revenue undefined Forecast, by Country 2020 & 2033
- Table 31: Turkey APP Security Assessment Revenue (undefined) Forecast, by Application 2020 & 2033
- Table 32: Israel APP Security Assessment Revenue (undefined) Forecast, by Application 2020 & 2033
- Table 33: GCC APP Security Assessment Revenue (undefined) Forecast, by Application 2020 & 2033
- Table 34: North Africa APP Security Assessment Revenue (undefined) Forecast, by Application 2020 & 2033
- Table 35: South Africa APP Security Assessment Revenue (undefined) Forecast, by Application 2020 & 2033
- Table 36: Rest of Middle East & Africa APP Security Assessment Revenue (undefined) Forecast, by Application 2020 & 2033
- Table 37: Global APP Security Assessment Revenue undefined Forecast, by Application 2020 & 2033
- Table 38: Global APP Security Assessment Revenue undefined Forecast, by Types 2020 & 2033
- Table 39: Global APP Security Assessment Revenue undefined Forecast, by Country 2020 & 2033
- Table 40: China APP Security Assessment Revenue (undefined) Forecast, by Application 2020 & 2033
- Table 41: India APP Security Assessment Revenue (undefined) Forecast, by Application 2020 & 2033
- Table 42: Japan APP Security Assessment Revenue (undefined) Forecast, by Application 2020 & 2033
- Table 43: South Korea APP Security Assessment Revenue (undefined) Forecast, by Application 2020 & 2033
- Table 44: ASEAN APP Security Assessment Revenue (undefined) Forecast, by Application 2020 & 2033
- Table 45: Oceania APP Security Assessment Revenue (undefined) Forecast, by Application 2020 & 2033
- Table 46: Rest of Asia Pacific APP Security Assessment Revenue (undefined) Forecast, by Application 2020 & 2033
Frequently Asked Questions
1. What is the projected Compound Annual Growth Rate (CAGR) of the APP Security Assessment?
The projected CAGR is approximately 18.8%.
2. Which companies are prominent players in the APP Security Assessment?
Key companies in the market include Veracode, Checkmarx, PortSwigger, Micro Focus, NTT Application Security, Qualys, Invicti Security, CrowdStrike, Wonfone Technology, 360, GuidePoint Security, Data Theorem, Parasoft, Zimperium.
3. What are the main segments of the APP Security Assessment?
The market segments include Application, Types.
4. Can you provide details about the market size?
The market size is estimated to be USD XXX N/A as of 2022.
5. What are some drivers contributing to market growth?
N/A
6. What are the notable trends driving market growth?
N/A
7. Are there any restraints impacting market growth?
N/A
8. Can you provide examples of recent developments in the market?
N/A
9. What pricing options are available for accessing the report?
Pricing options include single-user, multi-user, and enterprise licenses priced at USD 3950.00, USD 5925.00, and USD 7900.00 respectively.
10. Is the market size provided in terms of value or volume?
The market size is provided in terms of value, measured in N/A.
11. Are there any specific market keywords associated with the report?
Yes, the market keyword associated with the report is "APP Security Assessment," which aids in identifying and referencing the specific market segment covered.
12. How do I determine which pricing option suits my needs best?
The pricing options vary based on user requirements and access needs. Individual users may opt for single-user licenses, while businesses requiring broader access may choose multi-user or enterprise licenses for cost-effective access to the report.
13. Are there any additional resources or data provided in the APP Security Assessment report?
While the report offers comprehensive insights, it's advisable to review the specific contents or supplementary materials provided to ascertain if additional resources or data are available.
14. How can I stay updated on further developments or reports in the APP Security Assessment?
To stay informed about further developments, trends, and reports in the APP Security Assessment, consider subscribing to industry newsletters, following relevant companies and organizations, or regularly checking reputable industry news sources and publications.
Methodology
Step 1 - Identification of Relevant Samples Size from Population Database


Step 2 - Approaches for Defining Global Market Size (Value, Volume* & Price*)

Note*: In applicable scenarios
Step 3 - Data Sources
Primary Research
- Web Analytics
- Survey Reports
- Research Institute
- Latest Research Reports
- Opinion Leaders
Secondary Research
- Annual Reports
- White Paper
- Latest Press Release
- Industry Association
- Paid Database
- Investor Presentations

Step 4 - Data Triangulation
Involves using different sources of information in order to increase the validity of a study
These sources are likely to be stakeholders in a program - participants, other researchers, program staff, other community members, and so on.
Then we put all data in single framework & apply various statistical tools to find out the dynamic on the market.
During the analysis stage, feedback from the stakeholder groups would be compared to determine areas of agreement as well as areas of divergence