

Key Insights
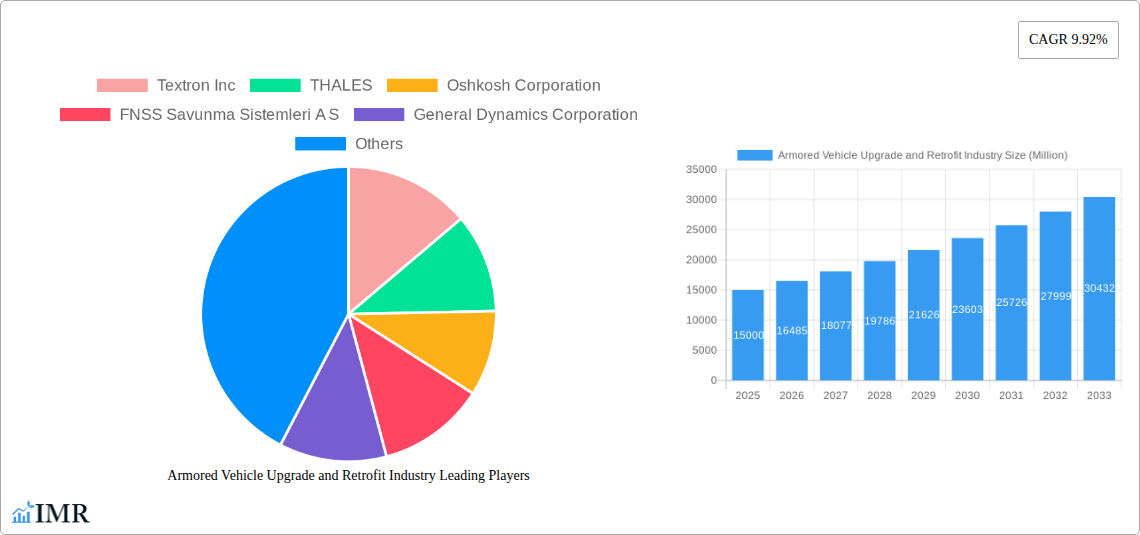
The Armored Vehicle Upgrade and Retrofit market is experiencing robust growth, driven by the increasing need for modernization and life extension of existing armored fleets globally. A compound annual growth rate (CAGR) of 9.92% from 2019 to 2024 suggests a significant market expansion, projected to continue into the forecast period (2025-2033). This growth is fueled by several factors, including geopolitical instability leading to increased defense spending, technological advancements in armor protection, communication systems, and fire control, and the demand for improved operational effectiveness and survivability of armored vehicles. The market is segmented by vehicle type, with Armored Personnel Carriers (APCs), Infantry Fighting Vehicles (IFVs), Mine-resistant Ambush Protected (MRAP) vehicles, and Main Battle Tanks (MBTs) representing significant segments. Key players like Textron, Thales, Oshkosh, and General Dynamics are actively investing in R&D and strategic partnerships to capture market share, fostering competition and innovation. Regional growth varies, with North America and Europe currently holding significant market shares due to established defense industries and ongoing modernization programs. However, the Asia-Pacific region is projected to witness substantial growth in the coming years due to increasing defense budgets and modernization efforts in countries like India and China.
The restraints on market growth primarily involve the high initial investment costs associated with upgrades and retrofits, the complexity of integrating new technologies into older platforms, and potential budgetary constraints in certain regions. However, the long-term benefits of extending the service life of existing vehicles, enhancing their capabilities, and reducing the need for new acquisitions are expected to outweigh these challenges. The market is further influenced by government regulations and policies regarding defense procurement, the ongoing development of advanced materials and technologies for enhanced protection, and the increasing emphasis on cybersecurity for armored vehicle systems. The strategic importance of maintaining a technologically advanced and well-equipped armored fleet will continue to drive investment in this crucial market segment for the foreseeable future.
This comprehensive report provides an in-depth analysis of the Armored Vehicle Upgrade and Retrofit industry, offering valuable insights for industry professionals, investors, and strategic decision-makers. The study covers the period from 2019 to 2033, with a focus on the forecast period from 2025 to 2033, using 2025 as the base year. The report segments the market by vehicle type, offering granular analysis across key regions and countries. The total market size in 2025 is estimated at xx Million units and is projected to reach xx Million units by 2033.
Armored Vehicle Upgrade and Retrofit Industry Market Dynamics & Structure
This section analyzes the market's competitive landscape, technological advancements, and regulatory influences shaping the industry. The market is characterized by a moderate level of concentration, with key players such as Textron Inc, Thales, Oshkosh Corporation, and General Dynamics Corporation holding significant market share. However, smaller, specialized firms also contribute significantly to innovation and niche market segments.
- Market Concentration: The top 5 players account for approximately xx% of the global market share in 2025.
- Technological Innovation: Continuous advancements in materials science, electronics integration, and autonomous systems drive product upgrades and retrofits. Key innovations include improved armor protection, advanced sensor technologies, and enhanced communication systems.
- Regulatory Frameworks: Government regulations concerning safety, export controls, and environmental standards significantly impact the industry. Compliance costs and changing regulations present both challenges and opportunities.
- Competitive Product Substitutes: Limited direct substitutes exist; however, alternative defense spending priorities and technological advancements in other sectors pose indirect competitive pressures.
- End-User Demographics: The primary end-users are government defense forces (national armies, special forces), law enforcement agencies, and paramilitary groups globally. Emerging markets contribute increasingly to demand.
- M&A Trends: The industry has witnessed xx M&A deals in the historical period (2019-2024), primarily driven by efforts to consolidate market share and access new technologies. The forecast period is expected to see continued M&A activity, with a projected xx deals.
Armored Vehicle Upgrade and Retrofit Industry Growth Trends & Insights
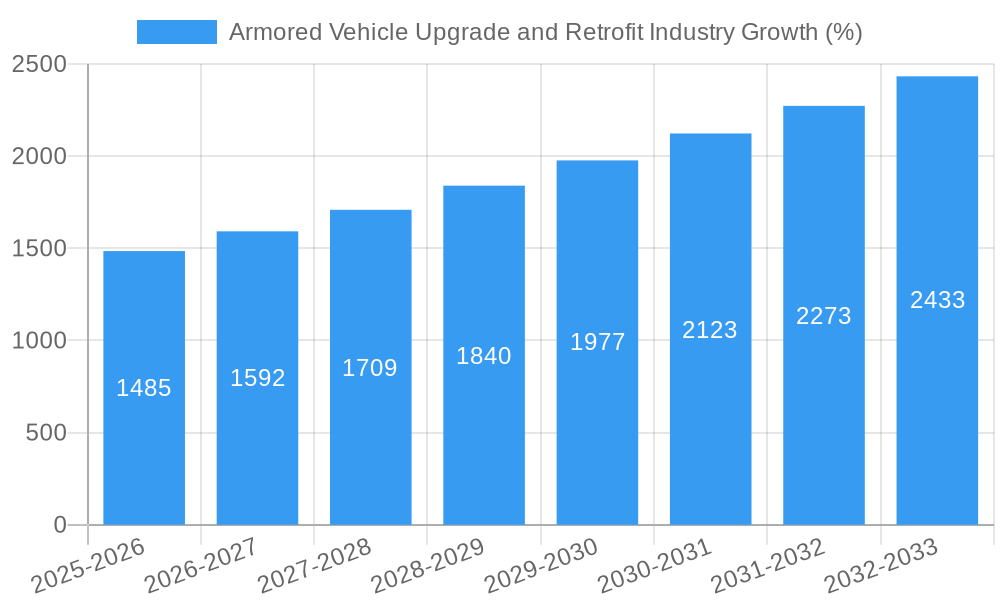
This section details the market's growth trajectory, analyzing historical data (2019-2024) and projecting future trends (2025-2033). The market has experienced a Compound Annual Growth Rate (CAGR) of xx% during the historical period, driven by increasing global defense spending, modernization of existing fleets, and the demand for enhanced protection and technological capabilities. The forecast period projects a CAGR of xx%, fueled by ongoing geopolitical instability, modernization programs in developing nations, and the growing adoption of advanced technologies in armored vehicle upgrades and retrofits. Technological disruptions, particularly in areas like autonomous systems and artificial intelligence, present both opportunities and challenges. Shifting consumer preferences towards enhanced survivability and improved situational awareness also contribute to market growth. Market penetration is expected to increase from xx% in 2025 to xx% by 2033.
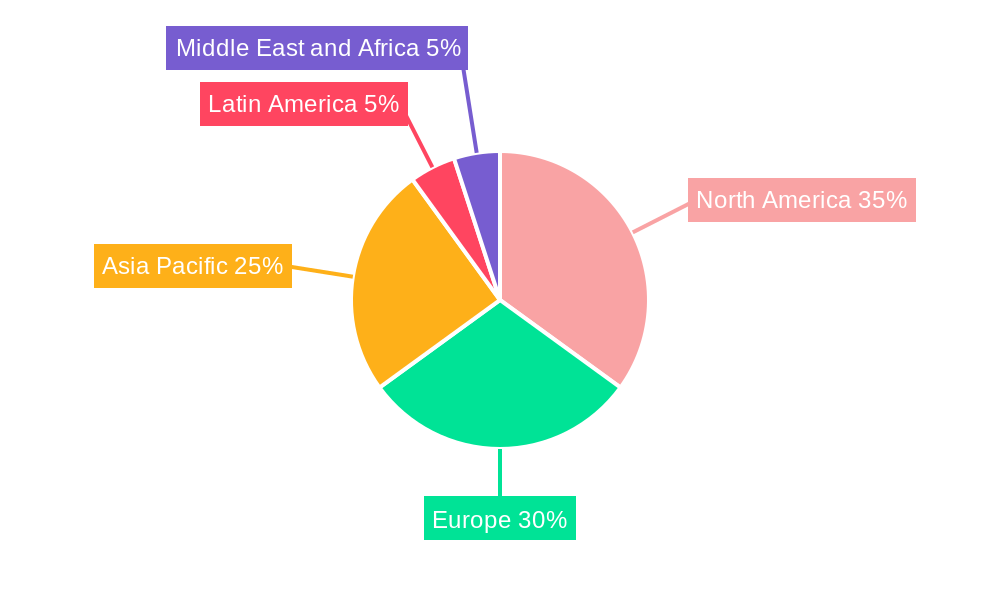
Dominant Regions, Countries, or Segments in Armored Vehicle Upgrade and Retrofit Industry
North America and Europe currently dominate the global armored vehicle upgrade and retrofit market, driven by substantial defense budgets and technologically advanced defense industries. However, Asia-Pacific is experiencing significant growth, particularly in countries such as India and China, due to increasing military modernization efforts and rising security concerns. Within the vehicle type segments, the Armored Personnel Carrier (APC) and Infantry Fighting Vehicle (IFV) segments currently hold the largest market share.
- Key Drivers:
- High defense expenditure: Significant government investments in defense modernization contribute significantly to market growth.
- Geopolitical instability: Ongoing conflicts and regional tensions fuel demand for armored vehicle upgrades and retrofits.
- Technological advancements: Continuous innovation in armor, sensors, and communication systems drives market growth.
- Dominance Factors:
- Established defense industries: Regions with robust defense manufacturing sectors are better positioned to meet the demand.
- Government policies: Supportive government policies and procurement programs influence market growth.
- Market access: Ease of access to supply chains and skilled workforce plays a crucial role.
- Growth Potential: Asia Pacific presents the highest growth potential owing to rising defense budgets and modernization efforts.
Armored Vehicle Upgrade and Retrofit Industry Product Landscape
The armored vehicle upgrade and retrofit market offers a wide range of products, including upgraded armor packages, advanced sensor systems, improved communication networks, and integrated weapon systems. These upgrades enhance vehicle survivability, situational awareness, and combat effectiveness. Recent innovations focus on lighter weight armor solutions, reducing fuel consumption and improving vehicle mobility. Unique selling propositions frequently center around enhanced protection capabilities, integration of advanced technologies, and reduced life cycle costs.
Key Drivers, Barriers & Challenges in Armored Vehicle Upgrade and Retrofit Industry
Key Drivers: Increased defense budgets globally, modernization of legacy armored vehicle fleets, technological advancements improving vehicle capabilities, and the need for enhanced protection against emerging threats such as IEDs and asymmetric warfare tactics.
Key Challenges: High costs associated with upgrades and retrofits, stringent regulatory approvals and compliance requirements, complex supply chains prone to disruptions, intense competition among existing and new entrants, and the need to balance cost-effectiveness with technological advancements. These challenges may result in a xx% reduction in market growth in specific regions experiencing supply chain bottlenecks.
Emerging Opportunities in Armored Vehicle Upgrade and Retrofit Industry
Emerging opportunities include the increasing demand for unmanned or autonomous capabilities for armored vehicles, development of lighter and more effective armor materials, the integration of advanced sensors and communication systems for enhanced situational awareness, and the expansion into new markets in developing countries with growing defense budgets. The integration of AI for enhanced threat detection and autonomous navigation presents a significant long-term opportunity.
Growth Accelerators in the Armored Vehicle Upgrade and Retrofit Industry Industry
Technological breakthroughs in materials science, leading to lighter and stronger armor; strategic partnerships between defense contractors and technology companies, fostering innovation; expansion into new geographic markets; and the development of cost-effective upgrade packages for legacy systems will accelerate market growth. Government initiatives promoting domestic defense manufacturing can also significantly impact market expansion.
Key Players Shaping the Armored Vehicle Upgrade and Retrofit Industry Market
- Textron Inc
- THALES
- Oshkosh Corporation
- FNSS Savunma Sistemleri A S
- General Dynamics Corporation
- Rheinmetall AG
- Elbit Systems Ltd
- Patria Group
- Nexter Group
- BAE Systems PLC
- Bharat Electronics Limited (BEL)
- Ruag International Holding AG
Notable Milestones in Armored Vehicle Upgrade and Retrofit Industry Sector
- 2020: Introduction of a new lightweight armor technology by Rheinmetall AG.
- 2021: Successful completion of a major upgrade program for APC fleets by Textron Inc. for a major Middle Eastern customer.
- 2022: Merger between two smaller armored vehicle upgrade companies, increasing market consolidation.
- 2023: Launch of a new autonomous turret system by Elbit Systems Ltd.
- 2024: Significant investment in R&D for next-generation armor materials by Oshkosh Corporation.
In-Depth Armored Vehicle Upgrade and Retrofit Industry Market Outlook
The future of the armored vehicle upgrade and retrofit market looks promising, driven by ongoing technological advancements, increasing defense budgets, and growing global security concerns. The industry is poised for significant growth, with opportunities for companies that can leverage technological innovation, establish strategic partnerships, and effectively navigate regulatory landscapes. Further expansion into emerging markets and focus on cost-effective solutions are crucial for long-term success. The continued development of autonomous capabilities and the integration of AI will revolutionize the industry.
Armored Vehicle Upgrade and Retrofit Industry Segmentation
-
1. Vehicle Type
- 1.1. Armored Personnel Carrier (APC)
- 1.2. Infantry Fighting Vehicle (IFV)
- 1.3. Mine-resistant Ambush Protected (MRAP)
- 1.4. Main Battle Tank (MBT)
- 1.5. Other Vehicle Types
Armored Vehicle Upgrade and Retrofit Industry Segmentation By Geography
-
1. North America
- 1.1. United States
- 1.2. Canada
-
2. Europe
- 2.1. United Kingdom
- 2.2. France
- 2.3. Germany
- 2.4. Russia
- 2.5. Rest of Europe
-
3. Asia Pacific
- 3.1. China
- 3.2. India
- 3.3. Japan
- 3.4. South Korea
- 3.5. Rest of Asia Pacific
-
4. Latin America
- 4.1. Brazil
- 4.2. Rest of Latin America
-
5. Middle East and Africa
- 5.1. United Arab Emirates
- 5.2. Saudi Arabia
- 5.3. Egypt
- 5.4. Turkey
- 5.5. Rest of Middle East and Africa
Armored Vehicle Upgrade and Retrofit Industry REPORT HIGHLIGHTS
| Aspects | Details |
|---|---|
| Study Period | 2019-2033 |
| Base Year | 2024 |
| Estimated Year | 2025 |
| Forecast Period | 2025-2033 |
| Historical Period | 2019-2024 |
| Growth Rate | CAGR of 9.92% from 2019-2033 |
| Segmentation |
|
Table of Contents
- 1. Introduction
- 1.1. Research Scope
- 1.2. Market Segmentation
- 1.3. Research Methodology
- 1.4. Definitions and Assumptions
- 2. Executive Summary
- 2.1. Introduction
- 3. Market Dynamics
- 3.1. Introduction
- 3.2. Market Drivers
- 3.3. Market Restrains
- 3.4. Market Trends
- 3.4.1. Infantry Fighting Vehicle (IFV) Segment Dominates the Market During the Forecast Period
- 4. Market Factor Analysis
- 4.1. Porters Five Forces
- 4.2. Supply/Value Chain
- 4.3. PESTEL analysis
- 4.4. Market Entropy
- 4.5. Patent/Trademark Analysis
- 5. Global Armored Vehicle Upgrade and Retrofit Industry Analysis, Insights and Forecast, 2019-2031
- 5.1. Market Analysis, Insights and Forecast - by Vehicle Type
- 5.1.1. Armored Personnel Carrier (APC)
- 5.1.2. Infantry Fighting Vehicle (IFV)
- 5.1.3. Mine-resistant Ambush Protected (MRAP)
- 5.1.4. Main Battle Tank (MBT)
- 5.1.5. Other Vehicle Types
- 5.2. Market Analysis, Insights and Forecast - by Region
- 5.2.1. North America
- 5.2.2. Europe
- 5.2.3. Asia Pacific
- 5.2.4. Latin America
- 5.2.5. Middle East and Africa
- 5.1. Market Analysis, Insights and Forecast - by Vehicle Type
- 6. North America Armored Vehicle Upgrade and Retrofit Industry Analysis, Insights and Forecast, 2019-2031
- 6.1. Market Analysis, Insights and Forecast - by Vehicle Type
- 6.1.1. Armored Personnel Carrier (APC)
- 6.1.2. Infantry Fighting Vehicle (IFV)
- 6.1.3. Mine-resistant Ambush Protected (MRAP)
- 6.1.4. Main Battle Tank (MBT)
- 6.1.5. Other Vehicle Types
- 6.1. Market Analysis, Insights and Forecast - by Vehicle Type
- 7. Europe Armored Vehicle Upgrade and Retrofit Industry Analysis, Insights and Forecast, 2019-2031
- 7.1. Market Analysis, Insights and Forecast - by Vehicle Type
- 7.1.1. Armored Personnel Carrier (APC)
- 7.1.2. Infantry Fighting Vehicle (IFV)
- 7.1.3. Mine-resistant Ambush Protected (MRAP)
- 7.1.4. Main Battle Tank (MBT)
- 7.1.5. Other Vehicle Types
- 7.1. Market Analysis, Insights and Forecast - by Vehicle Type
- 8. Asia Pacific Armored Vehicle Upgrade and Retrofit Industry Analysis, Insights and Forecast, 2019-2031
- 8.1. Market Analysis, Insights and Forecast - by Vehicle Type
- 8.1.1. Armored Personnel Carrier (APC)
- 8.1.2. Infantry Fighting Vehicle (IFV)
- 8.1.3. Mine-resistant Ambush Protected (MRAP)
- 8.1.4. Main Battle Tank (MBT)
- 8.1.5. Other Vehicle Types
- 8.1. Market Analysis, Insights and Forecast - by Vehicle Type
- 9. Latin America Armored Vehicle Upgrade and Retrofit Industry Analysis, Insights and Forecast, 2019-2031
- 9.1. Market Analysis, Insights and Forecast - by Vehicle Type
- 9.1.1. Armored Personnel Carrier (APC)
- 9.1.2. Infantry Fighting Vehicle (IFV)
- 9.1.3. Mine-resistant Ambush Protected (MRAP)
- 9.1.4. Main Battle Tank (MBT)
- 9.1.5. Other Vehicle Types
- 9.1. Market Analysis, Insights and Forecast - by Vehicle Type
- 10. Middle East and Africa Armored Vehicle Upgrade and Retrofit Industry Analysis, Insights and Forecast, 2019-2031
- 10.1. Market Analysis, Insights and Forecast - by Vehicle Type
- 10.1.1. Armored Personnel Carrier (APC)
- 10.1.2. Infantry Fighting Vehicle (IFV)
- 10.1.3. Mine-resistant Ambush Protected (MRAP)
- 10.1.4. Main Battle Tank (MBT)
- 10.1.5. Other Vehicle Types
- 10.1. Market Analysis, Insights and Forecast - by Vehicle Type
- 11. North America Armored Vehicle Upgrade and Retrofit Industry Analysis, Insights and Forecast, 2019-2031
- 11.1. Market Analysis, Insights and Forecast - By Country/Sub-region
- 11.1.1 United States
- 11.1.2 Canada
- 12. Europe Armored Vehicle Upgrade and Retrofit Industry Analysis, Insights and Forecast, 2019-2031
- 12.1. Market Analysis, Insights and Forecast - By Country/Sub-region
- 12.1.1 United Kingdom
- 12.1.2 France
- 12.1.3 Germany
- 12.1.4 Russia
- 12.1.5 Rest of Europe
- 13. Asia Pacific Armored Vehicle Upgrade and Retrofit Industry Analysis, Insights and Forecast, 2019-2031
- 13.1. Market Analysis, Insights and Forecast - By Country/Sub-region
- 13.1.1 China
- 13.1.2 India
- 13.1.3 Japan
- 13.1.4 South Korea
- 13.1.5 Rest of Asia Pacific
- 14. Latin America Armored Vehicle Upgrade and Retrofit Industry Analysis, Insights and Forecast, 2019-2031
- 14.1. Market Analysis, Insights and Forecast - By Country/Sub-region
- 14.1.1 Brazil
- 14.1.2 Rest of Latin America
- 15. Middle East and Africa Armored Vehicle Upgrade and Retrofit Industry Analysis, Insights and Forecast, 2019-2031
- 15.1. Market Analysis, Insights and Forecast - By Country/Sub-region
- 15.1.1 United Arab Emirates
- 15.1.2 Saudi Arabia
- 15.1.3 Egypt
- 15.1.4 Turkey
- 15.1.5 Rest of Middle East and Africa
- 16. Competitive Analysis
- 16.1. Global Market Share Analysis 2024
- 16.2. Company Profiles
- 16.2.1 Textron Inc
- 16.2.1.1. Overview
- 16.2.1.2. Products
- 16.2.1.3. SWOT Analysis
- 16.2.1.4. Recent Developments
- 16.2.1.5. Financials (Based on Availability)
- 16.2.2 THALES
- 16.2.2.1. Overview
- 16.2.2.2. Products
- 16.2.2.3. SWOT Analysis
- 16.2.2.4. Recent Developments
- 16.2.2.5. Financials (Based on Availability)
- 16.2.3 Oshkosh Corporation
- 16.2.3.1. Overview
- 16.2.3.2. Products
- 16.2.3.3. SWOT Analysis
- 16.2.3.4. Recent Developments
- 16.2.3.5. Financials (Based on Availability)
- 16.2.4 FNSS Savunma Sistemleri A S
- 16.2.4.1. Overview
- 16.2.4.2. Products
- 16.2.4.3. SWOT Analysis
- 16.2.4.4. Recent Developments
- 16.2.4.5. Financials (Based on Availability)
- 16.2.5 General Dynamics Corporation
- 16.2.5.1. Overview
- 16.2.5.2. Products
- 16.2.5.3. SWOT Analysis
- 16.2.5.4. Recent Developments
- 16.2.5.5. Financials (Based on Availability)
- 16.2.6 Rheinmetall AG
- 16.2.6.1. Overview
- 16.2.6.2. Products
- 16.2.6.3. SWOT Analysis
- 16.2.6.4. Recent Developments
- 16.2.6.5. Financials (Based on Availability)
- 16.2.7 Elbit Systems Ltd
- 16.2.7.1. Overview
- 16.2.7.2. Products
- 16.2.7.3. SWOT Analysis
- 16.2.7.4. Recent Developments
- 16.2.7.5. Financials (Based on Availability)
- 16.2.8 Patria Group
- 16.2.8.1. Overview
- 16.2.8.2. Products
- 16.2.8.3. SWOT Analysis
- 16.2.8.4. Recent Developments
- 16.2.8.5. Financials (Based on Availability)
- 16.2.9 Nexter Group
- 16.2.9.1. Overview
- 16.2.9.2. Products
- 16.2.9.3. SWOT Analysis
- 16.2.9.4. Recent Developments
- 16.2.9.5. Financials (Based on Availability)
- 16.2.10 BAE Systems PLC
- 16.2.10.1. Overview
- 16.2.10.2. Products
- 16.2.10.3. SWOT Analysis
- 16.2.10.4. Recent Developments
- 16.2.10.5. Financials (Based on Availability)
- 16.2.11 Bharat Electronics Limited (BEL
- 16.2.11.1. Overview
- 16.2.11.2. Products
- 16.2.11.3. SWOT Analysis
- 16.2.11.4. Recent Developments
- 16.2.11.5. Financials (Based on Availability)
- 16.2.12 Ruag International Holding AG
- 16.2.12.1. Overview
- 16.2.12.2. Products
- 16.2.12.3. SWOT Analysis
- 16.2.12.4. Recent Developments
- 16.2.12.5. Financials (Based on Availability)
- 16.2.1 Textron Inc
List of Figures
- Figure 1: Global Armored Vehicle Upgrade and Retrofit Industry Revenue Breakdown (Million, %) by Region 2024 & 2032
- Figure 2: North America Armored Vehicle Upgrade and Retrofit Industry Revenue (Million), by Country 2024 & 2032
- Figure 3: North America Armored Vehicle Upgrade and Retrofit Industry Revenue Share (%), by Country 2024 & 2032
- Figure 4: Europe Armored Vehicle Upgrade and Retrofit Industry Revenue (Million), by Country 2024 & 2032
- Figure 5: Europe Armored Vehicle Upgrade and Retrofit Industry Revenue Share (%), by Country 2024 & 2032
- Figure 6: Asia Pacific Armored Vehicle Upgrade and Retrofit Industry Revenue (Million), by Country 2024 & 2032
- Figure 7: Asia Pacific Armored Vehicle Upgrade and Retrofit Industry Revenue Share (%), by Country 2024 & 2032
- Figure 8: Latin America Armored Vehicle Upgrade and Retrofit Industry Revenue (Million), by Country 2024 & 2032
- Figure 9: Latin America Armored Vehicle Upgrade and Retrofit Industry Revenue Share (%), by Country 2024 & 2032
- Figure 10: Middle East and Africa Armored Vehicle Upgrade and Retrofit Industry Revenue (Million), by Country 2024 & 2032
- Figure 11: Middle East and Africa Armored Vehicle Upgrade and Retrofit Industry Revenue Share (%), by Country 2024 & 2032
- Figure 12: North America Armored Vehicle Upgrade and Retrofit Industry Revenue (Million), by Vehicle Type 2024 & 2032
- Figure 13: North America Armored Vehicle Upgrade and Retrofit Industry Revenue Share (%), by Vehicle Type 2024 & 2032
- Figure 14: North America Armored Vehicle Upgrade and Retrofit Industry Revenue (Million), by Country 2024 & 2032
- Figure 15: North America Armored Vehicle Upgrade and Retrofit Industry Revenue Share (%), by Country 2024 & 2032
- Figure 16: Europe Armored Vehicle Upgrade and Retrofit Industry Revenue (Million), by Vehicle Type 2024 & 2032
- Figure 17: Europe Armored Vehicle Upgrade and Retrofit Industry Revenue Share (%), by Vehicle Type 2024 & 2032
- Figure 18: Europe Armored Vehicle Upgrade and Retrofit Industry Revenue (Million), by Country 2024 & 2032
- Figure 19: Europe Armored Vehicle Upgrade and Retrofit Industry Revenue Share (%), by Country 2024 & 2032
- Figure 20: Asia Pacific Armored Vehicle Upgrade and Retrofit Industry Revenue (Million), by Vehicle Type 2024 & 2032
- Figure 21: Asia Pacific Armored Vehicle Upgrade and Retrofit Industry Revenue Share (%), by Vehicle Type 2024 & 2032
- Figure 22: Asia Pacific Armored Vehicle Upgrade and Retrofit Industry Revenue (Million), by Country 2024 & 2032
- Figure 23: Asia Pacific Armored Vehicle Upgrade and Retrofit Industry Revenue Share (%), by Country 2024 & 2032
- Figure 24: Latin America Armored Vehicle Upgrade and Retrofit Industry Revenue (Million), by Vehicle Type 2024 & 2032
- Figure 25: Latin America Armored Vehicle Upgrade and Retrofit Industry Revenue Share (%), by Vehicle Type 2024 & 2032
- Figure 26: Latin America Armored Vehicle Upgrade and Retrofit Industry Revenue (Million), by Country 2024 & 2032
- Figure 27: Latin America Armored Vehicle Upgrade and Retrofit Industry Revenue Share (%), by Country 2024 & 2032
- Figure 28: Middle East and Africa Armored Vehicle Upgrade and Retrofit Industry Revenue (Million), by Vehicle Type 2024 & 2032
- Figure 29: Middle East and Africa Armored Vehicle Upgrade and Retrofit Industry Revenue Share (%), by Vehicle Type 2024 & 2032
- Figure 30: Middle East and Africa Armored Vehicle Upgrade and Retrofit Industry Revenue (Million), by Country 2024 & 2032
- Figure 31: Middle East and Africa Armored Vehicle Upgrade and Retrofit Industry Revenue Share (%), by Country 2024 & 2032
List of Tables
- Table 1: Global Armored Vehicle Upgrade and Retrofit Industry Revenue Million Forecast, by Region 2019 & 2032
- Table 2: Global Armored Vehicle Upgrade and Retrofit Industry Revenue Million Forecast, by Vehicle Type 2019 & 2032
- Table 3: Global Armored Vehicle Upgrade and Retrofit Industry Revenue Million Forecast, by Region 2019 & 2032
- Table 4: Global Armored Vehicle Upgrade and Retrofit Industry Revenue Million Forecast, by Country 2019 & 2032
- Table 5: United States Armored Vehicle Upgrade and Retrofit Industry Revenue (Million) Forecast, by Application 2019 & 2032
- Table 6: Canada Armored Vehicle Upgrade and Retrofit Industry Revenue (Million) Forecast, by Application 2019 & 2032
- Table 7: Global Armored Vehicle Upgrade and Retrofit Industry Revenue Million Forecast, by Country 2019 & 2032
- Table 8: United Kingdom Armored Vehicle Upgrade and Retrofit Industry Revenue (Million) Forecast, by Application 2019 & 2032
- Table 9: France Armored Vehicle Upgrade and Retrofit Industry Revenue (Million) Forecast, by Application 2019 & 2032
- Table 10: Germany Armored Vehicle Upgrade and Retrofit Industry Revenue (Million) Forecast, by Application 2019 & 2032
- Table 11: Russia Armored Vehicle Upgrade and Retrofit Industry Revenue (Million) Forecast, by Application 2019 & 2032
- Table 12: Rest of Europe Armored Vehicle Upgrade and Retrofit Industry Revenue (Million) Forecast, by Application 2019 & 2032
- Table 13: Global Armored Vehicle Upgrade and Retrofit Industry Revenue Million Forecast, by Country 2019 & 2032
- Table 14: China Armored Vehicle Upgrade and Retrofit Industry Revenue (Million) Forecast, by Application 2019 & 2032
- Table 15: India Armored Vehicle Upgrade and Retrofit Industry Revenue (Million) Forecast, by Application 2019 & 2032
- Table 16: Japan Armored Vehicle Upgrade and Retrofit Industry Revenue (Million) Forecast, by Application 2019 & 2032
- Table 17: South Korea Armored Vehicle Upgrade and Retrofit Industry Revenue (Million) Forecast, by Application 2019 & 2032
- Table 18: Rest of Asia Pacific Armored Vehicle Upgrade and Retrofit Industry Revenue (Million) Forecast, by Application 2019 & 2032
- Table 19: Global Armored Vehicle Upgrade and Retrofit Industry Revenue Million Forecast, by Country 2019 & 2032
- Table 20: Brazil Armored Vehicle Upgrade and Retrofit Industry Revenue (Million) Forecast, by Application 2019 & 2032
- Table 21: Rest of Latin America Armored Vehicle Upgrade and Retrofit Industry Revenue (Million) Forecast, by Application 2019 & 2032
- Table 22: Global Armored Vehicle Upgrade and Retrofit Industry Revenue Million Forecast, by Country 2019 & 2032
- Table 23: United Arab Emirates Armored Vehicle Upgrade and Retrofit Industry Revenue (Million) Forecast, by Application 2019 & 2032
- Table 24: Saudi Arabia Armored Vehicle Upgrade and Retrofit Industry Revenue (Million) Forecast, by Application 2019 & 2032
- Table 25: Egypt Armored Vehicle Upgrade and Retrofit Industry Revenue (Million) Forecast, by Application 2019 & 2032
- Table 26: Turkey Armored Vehicle Upgrade and Retrofit Industry Revenue (Million) Forecast, by Application 2019 & 2032
- Table 27: Rest of Middle East and Africa Armored Vehicle Upgrade and Retrofit Industry Revenue (Million) Forecast, by Application 2019 & 2032
- Table 28: Global Armored Vehicle Upgrade and Retrofit Industry Revenue Million Forecast, by Vehicle Type 2019 & 2032
- Table 29: Global Armored Vehicle Upgrade and Retrofit Industry Revenue Million Forecast, by Country 2019 & 2032
- Table 30: United States Armored Vehicle Upgrade and Retrofit Industry Revenue (Million) Forecast, by Application 2019 & 2032
- Table 31: Canada Armored Vehicle Upgrade and Retrofit Industry Revenue (Million) Forecast, by Application 2019 & 2032
- Table 32: Global Armored Vehicle Upgrade and Retrofit Industry Revenue Million Forecast, by Vehicle Type 2019 & 2032
- Table 33: Global Armored Vehicle Upgrade and Retrofit Industry Revenue Million Forecast, by Country 2019 & 2032
- Table 34: United Kingdom Armored Vehicle Upgrade and Retrofit Industry Revenue (Million) Forecast, by Application 2019 & 2032
- Table 35: France Armored Vehicle Upgrade and Retrofit Industry Revenue (Million) Forecast, by Application 2019 & 2032
- Table 36: Germany Armored Vehicle Upgrade and Retrofit Industry Revenue (Million) Forecast, by Application 2019 & 2032
- Table 37: Russia Armored Vehicle Upgrade and Retrofit Industry Revenue (Million) Forecast, by Application 2019 & 2032
- Table 38: Rest of Europe Armored Vehicle Upgrade and Retrofit Industry Revenue (Million) Forecast, by Application 2019 & 2032
- Table 39: Global Armored Vehicle Upgrade and Retrofit Industry Revenue Million Forecast, by Vehicle Type 2019 & 2032
- Table 40: Global Armored Vehicle Upgrade and Retrofit Industry Revenue Million Forecast, by Country 2019 & 2032
- Table 41: China Armored Vehicle Upgrade and Retrofit Industry Revenue (Million) Forecast, by Application 2019 & 2032
- Table 42: India Armored Vehicle Upgrade and Retrofit Industry Revenue (Million) Forecast, by Application 2019 & 2032
- Table 43: Japan Armored Vehicle Upgrade and Retrofit Industry Revenue (Million) Forecast, by Application 2019 & 2032
- Table 44: South Korea Armored Vehicle Upgrade and Retrofit Industry Revenue (Million) Forecast, by Application 2019 & 2032
- Table 45: Rest of Asia Pacific Armored Vehicle Upgrade and Retrofit Industry Revenue (Million) Forecast, by Application 2019 & 2032
- Table 46: Global Armored Vehicle Upgrade and Retrofit Industry Revenue Million Forecast, by Vehicle Type 2019 & 2032
- Table 47: Global Armored Vehicle Upgrade and Retrofit Industry Revenue Million Forecast, by Country 2019 & 2032
- Table 48: Brazil Armored Vehicle Upgrade and Retrofit Industry Revenue (Million) Forecast, by Application 2019 & 2032
- Table 49: Rest of Latin America Armored Vehicle Upgrade and Retrofit Industry Revenue (Million) Forecast, by Application 2019 & 2032
- Table 50: Global Armored Vehicle Upgrade and Retrofit Industry Revenue Million Forecast, by Vehicle Type 2019 & 2032
- Table 51: Global Armored Vehicle Upgrade and Retrofit Industry Revenue Million Forecast, by Country 2019 & 2032
- Table 52: United Arab Emirates Armored Vehicle Upgrade and Retrofit Industry Revenue (Million) Forecast, by Application 2019 & 2032
- Table 53: Saudi Arabia Armored Vehicle Upgrade and Retrofit Industry Revenue (Million) Forecast, by Application 2019 & 2032
- Table 54: Egypt Armored Vehicle Upgrade and Retrofit Industry Revenue (Million) Forecast, by Application 2019 & 2032
- Table 55: Turkey Armored Vehicle Upgrade and Retrofit Industry Revenue (Million) Forecast, by Application 2019 & 2032
- Table 56: Rest of Middle East and Africa Armored Vehicle Upgrade and Retrofit Industry Revenue (Million) Forecast, by Application 2019 & 2032
Frequently Asked Questions
1. What is the projected Compound Annual Growth Rate (CAGR) of the Armored Vehicle Upgrade and Retrofit Industry?
The projected CAGR is approximately 9.92%.
2. Which companies are prominent players in the Armored Vehicle Upgrade and Retrofit Industry?
Key companies in the market include Textron Inc, THALES, Oshkosh Corporation, FNSS Savunma Sistemleri A S, General Dynamics Corporation, Rheinmetall AG, Elbit Systems Ltd, Patria Group, Nexter Group, BAE Systems PLC, Bharat Electronics Limited (BEL, Ruag International Holding AG.
3. What are the main segments of the Armored Vehicle Upgrade and Retrofit Industry?
The market segments include Vehicle Type.
4. Can you provide details about the market size?
The market size is estimated to be USD XX Million as of 2022.
5. What are some drivers contributing to market growth?
N/A
6. What are the notable trends driving market growth?
Infantry Fighting Vehicle (IFV) Segment Dominates the Market During the Forecast Period.
7. Are there any restraints impacting market growth?
N/A
8. Can you provide examples of recent developments in the market?
N/A
9. What pricing options are available for accessing the report?
Pricing options include single-user, multi-user, and enterprise licenses priced at USD 4750, USD 5250, and USD 8750 respectively.
10. Is the market size provided in terms of value or volume?
The market size is provided in terms of value, measured in Million.
11. Are there any specific market keywords associated with the report?
Yes, the market keyword associated with the report is "Armored Vehicle Upgrade and Retrofit Industry," which aids in identifying and referencing the specific market segment covered.
12. How do I determine which pricing option suits my needs best?
The pricing options vary based on user requirements and access needs. Individual users may opt for single-user licenses, while businesses requiring broader access may choose multi-user or enterprise licenses for cost-effective access to the report.
13. Are there any additional resources or data provided in the Armored Vehicle Upgrade and Retrofit Industry report?
While the report offers comprehensive insights, it's advisable to review the specific contents or supplementary materials provided to ascertain if additional resources or data are available.
14. How can I stay updated on further developments or reports in the Armored Vehicle Upgrade and Retrofit Industry?
To stay informed about further developments, trends, and reports in the Armored Vehicle Upgrade and Retrofit Industry, consider subscribing to industry newsletters, following relevant companies and organizations, or regularly checking reputable industry news sources and publications.
Methodology
Step 1 - Identification of Relevant Samples Size from Population Database


Step 2 - Approaches for Defining Global Market Size (Value, Volume* & Price*)

Note*: In applicable scenarios
Step 3 - Data Sources
Primary Research
- Web Analytics
- Survey Reports
- Research Institute
- Latest Research Reports
- Opinion Leaders
Secondary Research
- Annual Reports
- White Paper
- Latest Press Release
- Industry Association
- Paid Database
- Investor Presentations

Step 4 - Data Triangulation
Involves using different sources of information in order to increase the validity of a study
These sources are likely to be stakeholders in a program - participants, other researchers, program staff, other community members, and so on.
Then we put all data in single framework & apply various statistical tools to find out the dynamic on the market.
During the analysis stage, feedback from the stakeholder groups would be compared to determine areas of agreement as well as areas of divergence
