

Key Insights
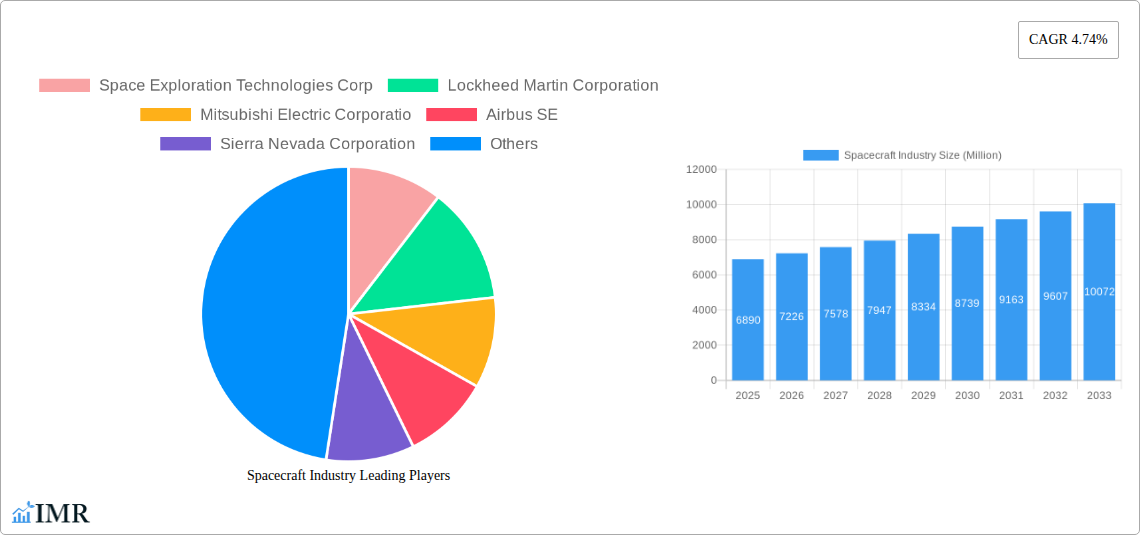
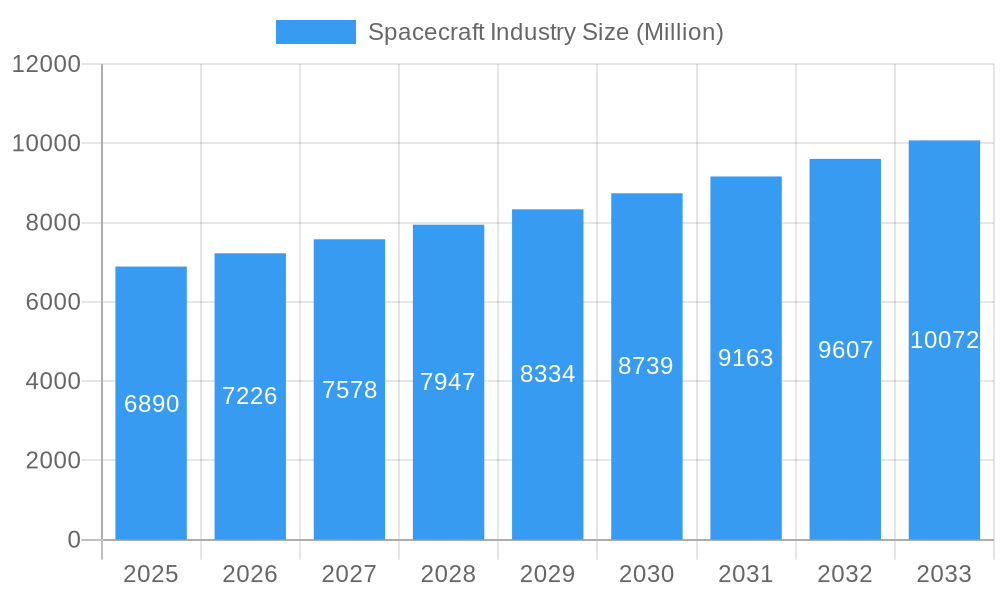
The global spacecraft market, valued at $6.89 billion in 2025, is projected to experience robust growth, driven by increasing government investments in space exploration, the burgeoning commercial space sector, and advancements in satellite technology. The Compound Annual Growth Rate (CAGR) of 4.74% from 2025 to 2033 indicates a significant expansion of the market over the forecast period. Key drivers include the rising demand for Earth observation satellites for various applications like agriculture, disaster management, and environmental monitoring; the increasing need for communication satellites for improved global connectivity; and the growing interest in space tourism and in-space manufacturing. The market is segmented by type into manned and unmanned spacecraft, with unmanned spacecraft currently dominating due to their lower operational costs and greater versatility for various missions. Leading companies like SpaceX, Lockheed Martin, and Airbus are at the forefront of innovation and competition, constantly developing advanced technologies to capture market share. Regional variations exist, with North America and Europe presently holding significant market shares, followed by the rapidly expanding Asia-Pacific region. However, emerging economies in regions like the Middle East and Africa are projected to contribute significantly to market growth in the coming years due to increasing space exploration initiatives.
Spacecraft Industry Market Size (In Billion)
The competitive landscape is characterized by both established aerospace giants and emerging private companies. The continued development of reusable launch vehicles and advancements in propulsion systems are expected to reduce launch costs and increase accessibility to space, fostering further market expansion. Potential restraints include the high initial investment costs associated with spacecraft development and launch, along with the challenges associated with maintaining and operating spacecraft in harsh space environments. However, continuous technological innovation and governmental support are expected to mitigate these challenges and drive sustained growth in the spacecraft industry throughout the forecast period. The development of smaller, more affordable satellites, often termed "small sats," represents a particularly significant trend, opening up space-based services to a wider range of users and applications.
Spacecraft Industry Company Market Share
Spacecraft Industry Market Report: 2019-2033
This comprehensive report provides an in-depth analysis of the Spacecraft Industry, encompassing both the parent market (Aerospace & Defense) and the child market (Spacecraft Manufacturing & Operations). The report covers the period from 2019 to 2033, with a focus on the forecast period from 2025 to 2033, and includes detailed market sizing, segmentation, and competitive landscape analysis. The base year for this report is 2025. This report projects a xx Million units market size in 2033.
Spacecraft Industry Market Dynamics & Structure
The global spacecraft industry is characterized by a moderately concentrated market structure, with key players like SpaceX, Lockheed Martin, and Boeing holding significant market share. Technological innovation, driven by advancements in propulsion systems, materials science, and autonomous navigation, is a primary growth driver. Stringent regulatory frameworks, including international space laws and national licensing requirements, significantly impact market dynamics. Competitive substitutes, such as ground-based observation technologies, exert pressure on certain spacecraft applications. The end-user demographics are diverse, encompassing government agencies (e.g., NASA, ESA, JAXA), commercial satellite operators, and emerging private space companies. M&A activity in the sector has been notable, with an estimated xx deals in the period 2019-2024, driving consolidation and expansion of capabilities.
- Market Concentration: Highly concentrated with top 5 players holding approximately xx% of market share in 2025.
- Technological Innovation: Focus on reusable launch vehicles, miniaturization, and advanced sensor technologies.
- Regulatory Landscape: Stringent international and national regulations impacting launch permits and operational safety.
- Competitive Substitutes: Ground-based observation systems and alternative communication technologies.
- End-User Demographics: Government agencies, commercial operators, and private space companies.
- M&A Activity: Significant consolidation through mergers and acquisitions; xx deals recorded between 2019 and 2024.
Spacecraft Industry Growth Trends & Insights
The global spacecraft market experienced significant growth during the historical period (2019-2024), driven by increasing demand for satellite-based services, government investment in space exploration, and the rise of the NewSpace industry. The market is projected to maintain a strong growth trajectory during the forecast period (2025-2033), with a projected Compound Annual Growth Rate (CAGR) of xx%. This growth is fueled by technological advancements leading to cost reductions in launch services and increased accessibility of space-based technologies. Consumer behavior shifts, particularly the growing reliance on satellite-based communication and navigation, further contribute to market expansion. Market penetration for various spacecraft applications, such as Earth observation, telecommunications, and navigation, continues to grow, indicating substantial future potential.
Dominant Regions, Countries, or Segments in Spacecraft Industry
The North American region, particularly the United States, holds a dominant position in the global spacecraft market, driven by strong government support for space exploration and a robust private sector presence. The dominance stems from substantial investments in research and development, a well-established aerospace manufacturing base, and a highly skilled workforce. Within the segment breakdown, the Unmanned Spacecraft segment currently holds a larger market share, fueled by increasing demand for Earth observation satellites, communication satellites, and other specialized spacecraft applications. However, the Manned Spacecraft segment is projected to exhibit significant growth in the coming years, propelled by increased human spaceflight activities and private sector initiatives.
- Key Drivers in North America: Robust government funding, advanced technological capabilities, and a strong private sector.
- Unmanned Spacecraft Dominance: High demand for Earth observation, communication, and scientific research missions.
- Manned Spacecraft Growth Potential: Increased interest in human spaceflight and private space tourism.
Spacecraft Industry Product Landscape
The spacecraft industry showcases a diverse range of products, including launch vehicles (reusable and expendable), satellites (communication, Earth observation, navigation), and human-rated spacecraft (crewed capsules, space stations). Recent innovations focus on improving fuel efficiency, enhancing payload capacity, and incorporating advanced technologies like AI and machine learning for autonomous operation. Key performance metrics include payload capacity, launch cost, lifespan, and operational reliability. Unique selling propositions often revolve around cost-effectiveness, advanced features, and reliability.
Key Drivers, Barriers & Challenges in Spacecraft Industry
Key Drivers:
- Increased demand for satellite-based services (communication, navigation, Earth observation).
- Government investments in space exploration and national security.
- Technological advancements reducing launch costs and improving spacecraft capabilities.
- Emergence of private sector companies fostering innovation and competition.
Key Barriers & Challenges:
- High development and launch costs.
- Stringent regulatory requirements and safety standards.
- Space debris mitigation and orbital congestion.
- Supply chain disruptions and reliance on specialized materials and components. This accounts for approximately xx% of total production costs.
Emerging Opportunities in Spacecraft Industry
- NewSpace Industry Expansion: Continued growth of private space companies and commercial space activities.
- Small Satellite Constellations: Increased demand for small, cost-effective satellites for various applications.
- Space Tourism: Growing market for space tourism, requiring the development of specialized spacecraft and infrastructure.
- In-Space Servicing and Manufacturing: Emergence of on-orbit spacecraft repair and construction capabilities.
Growth Accelerators in the Spacecraft Industry
Technological advancements, notably reusable launch vehicles and advanced propulsion systems, are significantly accelerating growth. Strategic partnerships between government agencies and private companies are fostering collaboration and innovation. Expanding into new markets, such as in-space resource utilization and space-based solar power, presents substantial long-term opportunities.
Key Players Shaping the Spacecraft Industry Market
Notable Milestones in Spacecraft Industry Sector
- November 2023: Sierra Space unveils the "Dream Chaser" space shuttle, securing a NASA contract for cargo delivery missions to the ISS.
- January 2024: Japan's SLIM lunar lander successfully achieves a precision landing, advancing lunar exploration technology.
In-Depth Spacecraft Industry Market Outlook
The future of the spacecraft industry is bright, with continued growth driven by technological advancements, increased private sector investment, and expanding applications of space-based technologies. Strategic partnerships and innovative business models will play a crucial role in unlocking the vast potential of this dynamic market, particularly in areas like space-based solar power and in-space manufacturing. The market is poised for sustained growth, with significant opportunities for both established players and new entrants.
Spacecraft Industry Segmentation
- 1. Production Analysis
- 2. Consumption Analysis
- 3. Import Market Analysis (Value & Volume)
- 4. Export Market Analysis (Value & Volume)
- 5. Price Trend Analysis
Spacecraft Industry Segmentation By Geography
-
1. North America
- 1.1. United States
- 1.2. Canada
- 1.3. Mexico
-
2. South America
- 2.1. Brazil
- 2.2. Argentina
- 2.3. Rest of South America
-
3. Europe
- 3.1. United Kingdom
- 3.2. Germany
- 3.3. France
- 3.4. Italy
- 3.5. Spain
- 3.6. Russia
- 3.7. Benelux
- 3.8. Nordics
- 3.9. Rest of Europe
-
4. Middle East & Africa
- 4.1. Turkey
- 4.2. Israel
- 4.3. GCC
- 4.4. North Africa
- 4.5. South Africa
- 4.6. Rest of Middle East & Africa
-
5. Asia Pacific
- 5.1. China
- 5.2. India
- 5.3. Japan
- 5.4. South Korea
- 5.5. ASEAN
- 5.6. Oceania
- 5.7. Rest of Asia Pacific
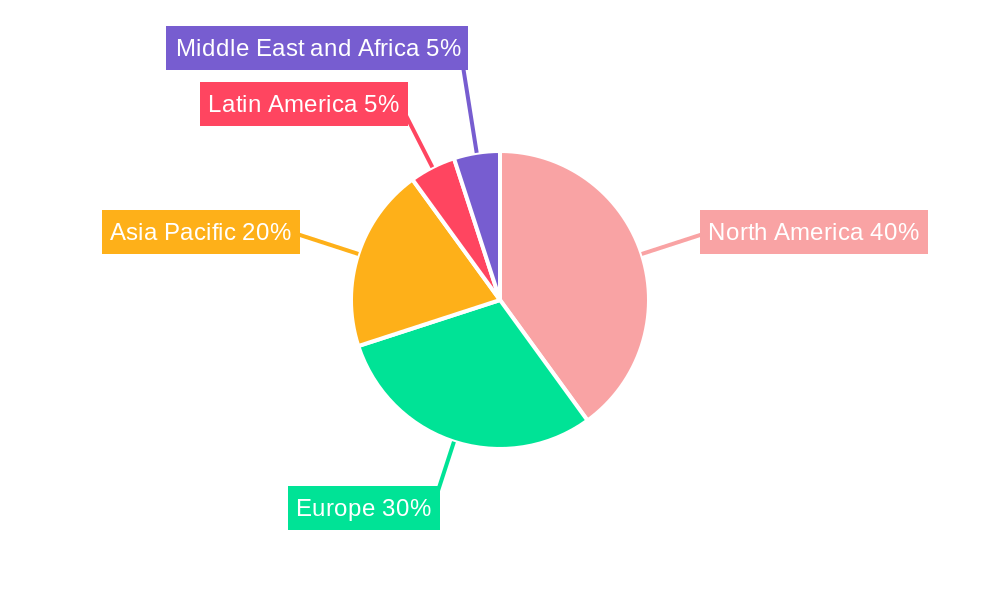
Spacecraft Industry Regional Market Share
Geographic Coverage of Spacecraft Industry
Spacecraft Industry REPORT HIGHLIGHTS
| Aspects | Details |
|---|---|
| Study Period | 2020-2034 |
| Base Year | 2025 |
| Estimated Year | 2026 |
| Forecast Period | 2026-2034 |
| Historical Period | 2020-2025 |
| Growth Rate | CAGR of 4.74% from 2020-2034 |
| Segmentation |
|
Table of Contents
- 1. Introduction
- 1.1. Research Scope
- 1.2. Market Segmentation
- 1.3. Research Objective
- 1.4. Definitions and Assumptions
- 2. Executive Summary
- 2.1. Market Snapshot
- 3. Market Dynamics
- 3.1. Market Drivers
- 3.2. Market Restrains
- 3.3. Market Trends
- 3.4. Market Opportunities
- 4. Market Factor Analysis
- 4.1. Porters Five Forces
- 4.1.1. Bargaining Power of Suppliers
- 4.1.2. Bargaining Power of Buyers
- 4.1.3. Threat of New Entrants
- 4.1.4. Threat of Substitutes
- 4.1.5. Competitive Rivalry
- 4.2. PESTEL analysis
- 4.3. BCG Analysis
- 4.3.1. Stars (High Growth, High Market Share)
- 4.3.2. Cash Cows (Low Growth, High Market Share)
- 4.3.3. Question Mark (High Growth, Low Market Share)
- 4.3.4. Dogs (Low Growth, Low Market Share)
- 4.4. Ansoff Matrix Analysis
- 4.5. Supply Chain Analysis
- 4.6. Regulatory Landscape
- 4.7. Current Market Potential and Opportunity Assessment (TAM–SAM–SOM Framework)
- 4.8. IMR Analyst Note
- 4.1. Porters Five Forces
- 5. Market Analysis, Insights and Forecast 2021-2033
- 5.1. Market Analysis, Insights and Forecast - by Production Analysis
- 5.2. Market Analysis, Insights and Forecast - by Consumption Analysis
- 5.3. Market Analysis, Insights and Forecast - by Import Market Analysis (Value & Volume)
- 5.4. Market Analysis, Insights and Forecast - by Export Market Analysis (Value & Volume)
- 5.5. Market Analysis, Insights and Forecast - by Price Trend Analysis
- 5.6. Market Analysis, Insights and Forecast - by Region
- 5.6.1. North America
- 5.6.2. South America
- 5.6.3. Europe
- 5.6.4. Middle East & Africa
- 5.6.5. Asia Pacific
- 6. Global Spacecraft Industry Analysis, Insights and Forecast, 2021-2033
- 6.1. Market Analysis, Insights and Forecast - by Production Analysis
- 6.2. Market Analysis, Insights and Forecast - by Consumption Analysis
- 6.3. Market Analysis, Insights and Forecast - by Import Market Analysis (Value & Volume)
- 6.4. Market Analysis, Insights and Forecast - by Export Market Analysis (Value & Volume)
- 6.5. Market Analysis, Insights and Forecast - by Price Trend Analysis
- 7. North America Spacecraft Industry Analysis, Insights and Forecast, 2020-2032
- 7.1. Market Analysis, Insights and Forecast - by Production Analysis
- 7.2. Market Analysis, Insights and Forecast - by Consumption Analysis
- 7.3. Market Analysis, Insights and Forecast - by Import Market Analysis (Value & Volume)
- 7.4. Market Analysis, Insights and Forecast - by Export Market Analysis (Value & Volume)
- 7.5. Market Analysis, Insights and Forecast - by Price Trend Analysis
- 8. South America Spacecraft Industry Analysis, Insights and Forecast, 2020-2032
- 8.1. Market Analysis, Insights and Forecast - by Production Analysis
- 8.2. Market Analysis, Insights and Forecast - by Consumption Analysis
- 8.3. Market Analysis, Insights and Forecast - by Import Market Analysis (Value & Volume)
- 8.4. Market Analysis, Insights and Forecast - by Export Market Analysis (Value & Volume)
- 8.5. Market Analysis, Insights and Forecast - by Price Trend Analysis
- 9. Europe Spacecraft Industry Analysis, Insights and Forecast, 2020-2032
- 9.1. Market Analysis, Insights and Forecast - by Production Analysis
- 9.2. Market Analysis, Insights and Forecast - by Consumption Analysis
- 9.3. Market Analysis, Insights and Forecast - by Import Market Analysis (Value & Volume)
- 9.4. Market Analysis, Insights and Forecast - by Export Market Analysis (Value & Volume)
- 9.5. Market Analysis, Insights and Forecast - by Price Trend Analysis
- 10. Middle East & Africa Spacecraft Industry Analysis, Insights and Forecast, 2020-2032
- 10.1. Market Analysis, Insights and Forecast - by Production Analysis
- 10.2. Market Analysis, Insights and Forecast - by Consumption Analysis
- 10.3. Market Analysis, Insights and Forecast - by Import Market Analysis (Value & Volume)
- 10.4. Market Analysis, Insights and Forecast - by Export Market Analysis (Value & Volume)
- 10.5. Market Analysis, Insights and Forecast - by Price Trend Analysis
- 11. Asia Pacific Spacecraft Industry Analysis, Insights and Forecast, 2020-2032
- 11.1. Market Analysis, Insights and Forecast - by Production Analysis
- 11.2. Market Analysis, Insights and Forecast - by Consumption Analysis
- 11.3. Market Analysis, Insights and Forecast - by Import Market Analysis (Value & Volume)
- 11.4. Market Analysis, Insights and Forecast - by Export Market Analysis (Value & Volume)
- 11.5. Market Analysis, Insights and Forecast - by Price Trend Analysis
- 12. Competitive Analysis
- 12.1. Company Profiles
- 12.1.1 Space Exploration Technologies Corp
- 12.1.1.1. Company Overview
- 12.1.1.2. Products
- 12.1.1.3. Company Financials
- 12.1.1.4. SWOT Analysis
- 12.1.2 Lockheed Martin Corporation
- 12.1.2.1. Company Overview
- 12.1.2.2. Products
- 12.1.2.3. Company Financials
- 12.1.2.4. SWOT Analysis
- 12.1.3 Mitsubishi Electric Corporatio
- 12.1.3.1. Company Overview
- 12.1.3.2. Products
- 12.1.3.3. Company Financials
- 12.1.3.4. SWOT Analysis
- 12.1.4 Airbus SE
- 12.1.4.1. Company Overview
- 12.1.4.2. Products
- 12.1.4.3. Company Financials
- 12.1.4.4. SWOT Analysis
- 12.1.5 Sierra Nevada Corporation
- 12.1.5.1. Company Overview
- 12.1.5.2. Products
- 12.1.5.3. Company Financials
- 12.1.5.4. SWOT Analysis
- 12.1.6 QinetiQ Group
- 12.1.6.1. Company Overview
- 12.1.6.2. Products
- 12.1.6.3. Company Financials
- 12.1.6.4. SWOT Analysis
- 12.1.7 OHB SE
- 12.1.7.1. Company Overview
- 12.1.7.2. Products
- 12.1.7.3. Company Financials
- 12.1.7.4. SWOT Analysis
- 12.1.8 Maxar Technologies Inc
- 12.1.8.1. Company Overview
- 12.1.8.2. Products
- 12.1.8.3. Company Financials
- 12.1.8.4. SWOT Analysis
- 12.1.9 Blue Origin LLC
- 12.1.9.1. Company Overview
- 12.1.9.2. Products
- 12.1.9.3. Company Financials
- 12.1.9.4. SWOT Analysis
- 12.1.10 Berlin Space Technologies GmbH
- 12.1.10.1. Company Overview
- 12.1.10.2. Products
- 12.1.10.3. Company Financials
- 12.1.10.4. SWOT Analysis
- 12.1.11 Northrop Grumman Corporation
- 12.1.11.1. Company Overview
- 12.1.11.2. Products
- 12.1.11.3. Company Financials
- 12.1.11.4. SWOT Analysis
- 12.1.12 The Boeing Company
- 12.1.12.1. Company Overview
- 12.1.12.2. Products
- 12.1.12.3. Company Financials
- 12.1.12.4. SWOT Analysis
- 12.1.1 Space Exploration Technologies Corp
- 12.2. Market Entropy
- 12.2.1 Company's Key Areas Served
- 12.2.2 Recent Developments
- 12.3. Company Market Share Analysis 2025
- 12.3.1 Top 5 Companies Market Share Analysis
- 12.3.2 Top 3 Companies Market Share Analysis
- 12.4. List of Potential Customers
- 13. Research Methodology
List of Figures
- Figure 1: Global Spacecraft Industry Revenue Breakdown (Million, %) by Region 2025 & 2033
- Figure 2: North America Spacecraft Industry Revenue (Million), by Production Analysis 2025 & 2033
- Figure 3: North America Spacecraft Industry Revenue Share (%), by Production Analysis 2025 & 2033
- Figure 4: North America Spacecraft Industry Revenue (Million), by Consumption Analysis 2025 & 2033
- Figure 5: North America Spacecraft Industry Revenue Share (%), by Consumption Analysis 2025 & 2033
- Figure 6: North America Spacecraft Industry Revenue (Million), by Import Market Analysis (Value & Volume) 2025 & 2033
- Figure 7: North America Spacecraft Industry Revenue Share (%), by Import Market Analysis (Value & Volume) 2025 & 2033
- Figure 8: North America Spacecraft Industry Revenue (Million), by Export Market Analysis (Value & Volume) 2025 & 2033
- Figure 9: North America Spacecraft Industry Revenue Share (%), by Export Market Analysis (Value & Volume) 2025 & 2033
- Figure 10: North America Spacecraft Industry Revenue (Million), by Price Trend Analysis 2025 & 2033
- Figure 11: North America Spacecraft Industry Revenue Share (%), by Price Trend Analysis 2025 & 2033
- Figure 12: North America Spacecraft Industry Revenue (Million), by Country 2025 & 2033
- Figure 13: North America Spacecraft Industry Revenue Share (%), by Country 2025 & 2033
- Figure 14: South America Spacecraft Industry Revenue (Million), by Production Analysis 2025 & 2033
- Figure 15: South America Spacecraft Industry Revenue Share (%), by Production Analysis 2025 & 2033
- Figure 16: South America Spacecraft Industry Revenue (Million), by Consumption Analysis 2025 & 2033
- Figure 17: South America Spacecraft Industry Revenue Share (%), by Consumption Analysis 2025 & 2033
- Figure 18: South America Spacecraft Industry Revenue (Million), by Import Market Analysis (Value & Volume) 2025 & 2033
- Figure 19: South America Spacecraft Industry Revenue Share (%), by Import Market Analysis (Value & Volume) 2025 & 2033
- Figure 20: South America Spacecraft Industry Revenue (Million), by Export Market Analysis (Value & Volume) 2025 & 2033
- Figure 21: South America Spacecraft Industry Revenue Share (%), by Export Market Analysis (Value & Volume) 2025 & 2033
- Figure 22: South America Spacecraft Industry Revenue (Million), by Price Trend Analysis 2025 & 2033
- Figure 23: South America Spacecraft Industry Revenue Share (%), by Price Trend Analysis 2025 & 2033
- Figure 24: South America Spacecraft Industry Revenue (Million), by Country 2025 & 2033
- Figure 25: South America Spacecraft Industry Revenue Share (%), by Country 2025 & 2033
- Figure 26: Europe Spacecraft Industry Revenue (Million), by Production Analysis 2025 & 2033
- Figure 27: Europe Spacecraft Industry Revenue Share (%), by Production Analysis 2025 & 2033
- Figure 28: Europe Spacecraft Industry Revenue (Million), by Consumption Analysis 2025 & 2033
- Figure 29: Europe Spacecraft Industry Revenue Share (%), by Consumption Analysis 2025 & 2033
- Figure 30: Europe Spacecraft Industry Revenue (Million), by Import Market Analysis (Value & Volume) 2025 & 2033
- Figure 31: Europe Spacecraft Industry Revenue Share (%), by Import Market Analysis (Value & Volume) 2025 & 2033
- Figure 32: Europe Spacecraft Industry Revenue (Million), by Export Market Analysis (Value & Volume) 2025 & 2033
- Figure 33: Europe Spacecraft Industry Revenue Share (%), by Export Market Analysis (Value & Volume) 2025 & 2033
- Figure 34: Europe Spacecraft Industry Revenue (Million), by Price Trend Analysis 2025 & 2033
- Figure 35: Europe Spacecraft Industry Revenue Share (%), by Price Trend Analysis 2025 & 2033
- Figure 36: Europe Spacecraft Industry Revenue (Million), by Country 2025 & 2033
- Figure 37: Europe Spacecraft Industry Revenue Share (%), by Country 2025 & 2033
- Figure 38: Middle East & Africa Spacecraft Industry Revenue (Million), by Production Analysis 2025 & 2033
- Figure 39: Middle East & Africa Spacecraft Industry Revenue Share (%), by Production Analysis 2025 & 2033
- Figure 40: Middle East & Africa Spacecraft Industry Revenue (Million), by Consumption Analysis 2025 & 2033
- Figure 41: Middle East & Africa Spacecraft Industry Revenue Share (%), by Consumption Analysis 2025 & 2033
- Figure 42: Middle East & Africa Spacecraft Industry Revenue (Million), by Import Market Analysis (Value & Volume) 2025 & 2033
- Figure 43: Middle East & Africa Spacecraft Industry Revenue Share (%), by Import Market Analysis (Value & Volume) 2025 & 2033
- Figure 44: Middle East & Africa Spacecraft Industry Revenue (Million), by Export Market Analysis (Value & Volume) 2025 & 2033
- Figure 45: Middle East & Africa Spacecraft Industry Revenue Share (%), by Export Market Analysis (Value & Volume) 2025 & 2033
- Figure 46: Middle East & Africa Spacecraft Industry Revenue (Million), by Price Trend Analysis 2025 & 2033
- Figure 47: Middle East & Africa Spacecraft Industry Revenue Share (%), by Price Trend Analysis 2025 & 2033
- Figure 48: Middle East & Africa Spacecraft Industry Revenue (Million), by Country 2025 & 2033
- Figure 49: Middle East & Africa Spacecraft Industry Revenue Share (%), by Country 2025 & 2033
- Figure 50: Asia Pacific Spacecraft Industry Revenue (Million), by Production Analysis 2025 & 2033
- Figure 51: Asia Pacific Spacecraft Industry Revenue Share (%), by Production Analysis 2025 & 2033
- Figure 52: Asia Pacific Spacecraft Industry Revenue (Million), by Consumption Analysis 2025 & 2033
- Figure 53: Asia Pacific Spacecraft Industry Revenue Share (%), by Consumption Analysis 2025 & 2033
- Figure 54: Asia Pacific Spacecraft Industry Revenue (Million), by Import Market Analysis (Value & Volume) 2025 & 2033
- Figure 55: Asia Pacific Spacecraft Industry Revenue Share (%), by Import Market Analysis (Value & Volume) 2025 & 2033
- Figure 56: Asia Pacific Spacecraft Industry Revenue (Million), by Export Market Analysis (Value & Volume) 2025 & 2033
- Figure 57: Asia Pacific Spacecraft Industry Revenue Share (%), by Export Market Analysis (Value & Volume) 2025 & 2033
- Figure 58: Asia Pacific Spacecraft Industry Revenue (Million), by Price Trend Analysis 2025 & 2033
- Figure 59: Asia Pacific Spacecraft Industry Revenue Share (%), by Price Trend Analysis 2025 & 2033
- Figure 60: Asia Pacific Spacecraft Industry Revenue (Million), by Country 2025 & 2033
- Figure 61: Asia Pacific Spacecraft Industry Revenue Share (%), by Country 2025 & 2033
List of Tables
- Table 1: Global Spacecraft Industry Revenue Million Forecast, by Production Analysis 2020 & 2033
- Table 2: Global Spacecraft Industry Revenue Million Forecast, by Consumption Analysis 2020 & 2033
- Table 3: Global Spacecraft Industry Revenue Million Forecast, by Import Market Analysis (Value & Volume) 2020 & 2033
- Table 4: Global Spacecraft Industry Revenue Million Forecast, by Export Market Analysis (Value & Volume) 2020 & 2033
- Table 5: Global Spacecraft Industry Revenue Million Forecast, by Price Trend Analysis 2020 & 2033
- Table 6: Global Spacecraft Industry Revenue Million Forecast, by Region 2020 & 2033
- Table 7: Global Spacecraft Industry Revenue Million Forecast, by Production Analysis 2020 & 2033
- Table 8: Global Spacecraft Industry Revenue Million Forecast, by Consumption Analysis 2020 & 2033
- Table 9: Global Spacecraft Industry Revenue Million Forecast, by Import Market Analysis (Value & Volume) 2020 & 2033
- Table 10: Global Spacecraft Industry Revenue Million Forecast, by Export Market Analysis (Value & Volume) 2020 & 2033
- Table 11: Global Spacecraft Industry Revenue Million Forecast, by Price Trend Analysis 2020 & 2033
- Table 12: Global Spacecraft Industry Revenue Million Forecast, by Country 2020 & 2033
- Table 13: United States Spacecraft Industry Revenue (Million) Forecast, by Application 2020 & 2033
- Table 14: Canada Spacecraft Industry Revenue (Million) Forecast, by Application 2020 & 2033
- Table 15: Mexico Spacecraft Industry Revenue (Million) Forecast, by Application 2020 & 2033
- Table 16: Global Spacecraft Industry Revenue Million Forecast, by Production Analysis 2020 & 2033
- Table 17: Global Spacecraft Industry Revenue Million Forecast, by Consumption Analysis 2020 & 2033
- Table 18: Global Spacecraft Industry Revenue Million Forecast, by Import Market Analysis (Value & Volume) 2020 & 2033
- Table 19: Global Spacecraft Industry Revenue Million Forecast, by Export Market Analysis (Value & Volume) 2020 & 2033
- Table 20: Global Spacecraft Industry Revenue Million Forecast, by Price Trend Analysis 2020 & 2033
- Table 21: Global Spacecraft Industry Revenue Million Forecast, by Country 2020 & 2033
- Table 22: Brazil Spacecraft Industry Revenue (Million) Forecast, by Application 2020 & 2033
- Table 23: Argentina Spacecraft Industry Revenue (Million) Forecast, by Application 2020 & 2033
- Table 24: Rest of South America Spacecraft Industry Revenue (Million) Forecast, by Application 2020 & 2033
- Table 25: Global Spacecraft Industry Revenue Million Forecast, by Production Analysis 2020 & 2033
- Table 26: Global Spacecraft Industry Revenue Million Forecast, by Consumption Analysis 2020 & 2033
- Table 27: Global Spacecraft Industry Revenue Million Forecast, by Import Market Analysis (Value & Volume) 2020 & 2033
- Table 28: Global Spacecraft Industry Revenue Million Forecast, by Export Market Analysis (Value & Volume) 2020 & 2033
- Table 29: Global Spacecraft Industry Revenue Million Forecast, by Price Trend Analysis 2020 & 2033
- Table 30: Global Spacecraft Industry Revenue Million Forecast, by Country 2020 & 2033
- Table 31: United Kingdom Spacecraft Industry Revenue (Million) Forecast, by Application 2020 & 2033
- Table 32: Germany Spacecraft Industry Revenue (Million) Forecast, by Application 2020 & 2033
- Table 33: France Spacecraft Industry Revenue (Million) Forecast, by Application 2020 & 2033
- Table 34: Italy Spacecraft Industry Revenue (Million) Forecast, by Application 2020 & 2033
- Table 35: Spain Spacecraft Industry Revenue (Million) Forecast, by Application 2020 & 2033
- Table 36: Russia Spacecraft Industry Revenue (Million) Forecast, by Application 2020 & 2033
- Table 37: Benelux Spacecraft Industry Revenue (Million) Forecast, by Application 2020 & 2033
- Table 38: Nordics Spacecraft Industry Revenue (Million) Forecast, by Application 2020 & 2033
- Table 39: Rest of Europe Spacecraft Industry Revenue (Million) Forecast, by Application 2020 & 2033
- Table 40: Global Spacecraft Industry Revenue Million Forecast, by Production Analysis 2020 & 2033
- Table 41: Global Spacecraft Industry Revenue Million Forecast, by Consumption Analysis 2020 & 2033
- Table 42: Global Spacecraft Industry Revenue Million Forecast, by Import Market Analysis (Value & Volume) 2020 & 2033
- Table 43: Global Spacecraft Industry Revenue Million Forecast, by Export Market Analysis (Value & Volume) 2020 & 2033
- Table 44: Global Spacecraft Industry Revenue Million Forecast, by Price Trend Analysis 2020 & 2033
- Table 45: Global Spacecraft Industry Revenue Million Forecast, by Country 2020 & 2033
- Table 46: Turkey Spacecraft Industry Revenue (Million) Forecast, by Application 2020 & 2033
- Table 47: Israel Spacecraft Industry Revenue (Million) Forecast, by Application 2020 & 2033
- Table 48: GCC Spacecraft Industry Revenue (Million) Forecast, by Application 2020 & 2033
- Table 49: North Africa Spacecraft Industry Revenue (Million) Forecast, by Application 2020 & 2033
- Table 50: South Africa Spacecraft Industry Revenue (Million) Forecast, by Application 2020 & 2033
- Table 51: Rest of Middle East & Africa Spacecraft Industry Revenue (Million) Forecast, by Application 2020 & 2033
- Table 52: Global Spacecraft Industry Revenue Million Forecast, by Production Analysis 2020 & 2033
- Table 53: Global Spacecraft Industry Revenue Million Forecast, by Consumption Analysis 2020 & 2033
- Table 54: Global Spacecraft Industry Revenue Million Forecast, by Import Market Analysis (Value & Volume) 2020 & 2033
- Table 55: Global Spacecraft Industry Revenue Million Forecast, by Export Market Analysis (Value & Volume) 2020 & 2033
- Table 56: Global Spacecraft Industry Revenue Million Forecast, by Price Trend Analysis 2020 & 2033
- Table 57: Global Spacecraft Industry Revenue Million Forecast, by Country 2020 & 2033
- Table 58: China Spacecraft Industry Revenue (Million) Forecast, by Application 2020 & 2033
- Table 59: India Spacecraft Industry Revenue (Million) Forecast, by Application 2020 & 2033
- Table 60: Japan Spacecraft Industry Revenue (Million) Forecast, by Application 2020 & 2033
- Table 61: South Korea Spacecraft Industry Revenue (Million) Forecast, by Application 2020 & 2033
- Table 62: ASEAN Spacecraft Industry Revenue (Million) Forecast, by Application 2020 & 2033
- Table 63: Oceania Spacecraft Industry Revenue (Million) Forecast, by Application 2020 & 2033
- Table 64: Rest of Asia Pacific Spacecraft Industry Revenue (Million) Forecast, by Application 2020 & 2033
Frequently Asked Questions
1. What is the projected Compound Annual Growth Rate (CAGR) of the Spacecraft Industry?
The projected CAGR is approximately 4.74%.
2. Which companies are prominent players in the Spacecraft Industry?
Key companies in the market include Space Exploration Technologies Corp, Lockheed Martin Corporation, Mitsubishi Electric Corporatio, Airbus SE, Sierra Nevada Corporation, QinetiQ Group, OHB SE, Maxar Technologies Inc, Blue Origin LLC, Berlin Space Technologies GmbH, Northrop Grumman Corporation, The Boeing Company.
3. What are the main segments of the Spacecraft Industry?
The market segments include Production Analysis, Consumption Analysis, Import Market Analysis (Value & Volume), Export Market Analysis (Value & Volume), Price Trend Analysis.
4. Can you provide details about the market size?
The market size is estimated to be USD 6.89 Million as of 2022.
5. What are some drivers contributing to market growth?
Increase in Internet of Things (IoT) and Autonomous Systems; Rise in Demand for Military and Defense Satellite Communication Solutions.
6. What are the notable trends driving market growth?
Unmanned Spacecraft to Dominate Market Share During the Forecast Period.
7. Are there any restraints impacting market growth?
Cybersecurity Threats to Satellite Communication; Interference in Transmission of Data.
8. Can you provide examples of recent developments in the market?
January 2024: Japan launched a spacecraft on the Moon to demonstrate precision landing technology and reinvigorate its space program. The Japan Aerospace Exploration Agency's (JAXA) Smart Lander for Investigating Moon (SLIM) landed on the Moon's surface and re-established communication with Earth. By reducing the cost of launching, Japan aims to carry out more frequent missions in the future.
9. What pricing options are available for accessing the report?
Pricing options include single-user, multi-user, and enterprise licenses priced at USD 4750, USD 5250, and USD 8750 respectively.
10. Is the market size provided in terms of value or volume?
The market size is provided in terms of value, measured in Million.
11. Are there any specific market keywords associated with the report?
Yes, the market keyword associated with the report is "Spacecraft Industry," which aids in identifying and referencing the specific market segment covered.
12. How do I determine which pricing option suits my needs best?
The pricing options vary based on user requirements and access needs. Individual users may opt for single-user licenses, while businesses requiring broader access may choose multi-user or enterprise licenses for cost-effective access to the report.
13. Are there any additional resources or data provided in the Spacecraft Industry report?
While the report offers comprehensive insights, it's advisable to review the specific contents or supplementary materials provided to ascertain if additional resources or data are available.
14. How can I stay updated on further developments or reports in the Spacecraft Industry?
To stay informed about further developments, trends, and reports in the Spacecraft Industry, consider subscribing to industry newsletters, following relevant companies and organizations, or regularly checking reputable industry news sources and publications.
Methodology
Step 1 - Identification of Relevant Samples Size from Population Database


Step 2 - Approaches for Defining Global Market Size (Value, Volume* & Price*)

Note*: In applicable scenarios
Step 3 - Data Sources
Primary Research
- Web Analytics
- Survey Reports
- Research Institute
- Latest Research Reports
- Opinion Leaders
Secondary Research
- Annual Reports
- White Paper
- Latest Press Release
- Industry Association
- Paid Database
- Investor Presentations

Step 4 - Data Triangulation
Involves using different sources of information in order to increase the validity of a study
These sources are likely to be stakeholders in a program - participants, other researchers, program staff, other community members, and so on.
Then we put all data in single framework & apply various statistical tools to find out the dynamic on the market.
During the analysis stage, feedback from the stakeholder groups would be compared to determine areas of agreement as well as areas of divergence