

Key Insights
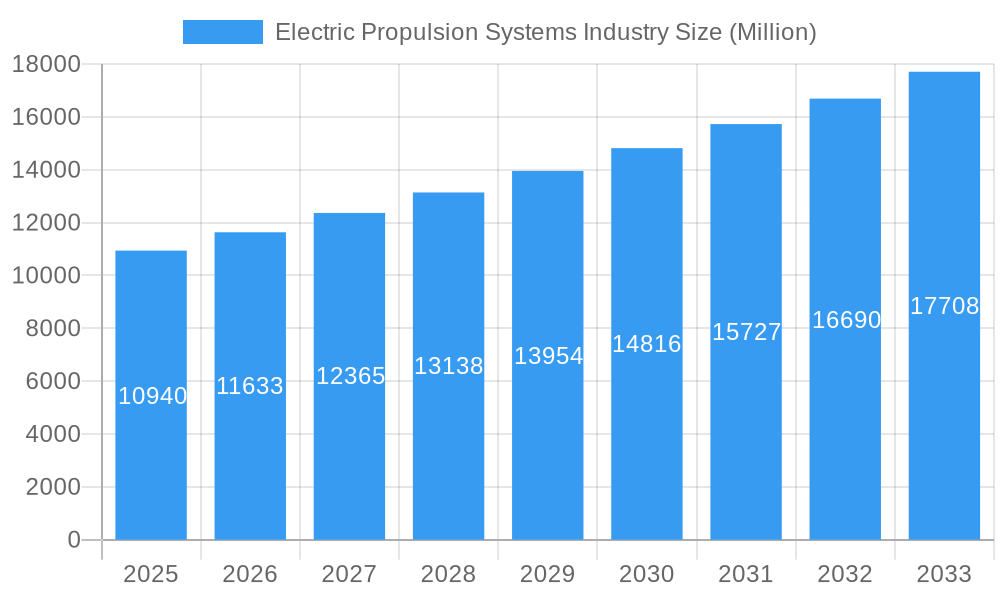
The Electric Propulsion Systems (EPS) market is experiencing robust growth, projected to reach \$10.94 billion in 2025 and exhibiting a Compound Annual Growth Rate (CAGR) of 6.09% from 2025 to 2033. This expansion is fueled by several key drivers. The increasing demand for fuel-efficient and environmentally friendly transportation solutions across airborne, terrestrial, marine, and space applications is a significant catalyst. Government regulations aimed at reducing carbon emissions are further incentivizing the adoption of EPS technology. Technological advancements leading to higher efficiency, improved power density, and reduced costs are also contributing to market growth. The market is segmented by type (hybrid and full-electric) and application (airborne, terrestrial, marine, and space), with the airborne and space segments expected to witness particularly strong growth due to the rising need for efficient and reliable propulsion systems in these sectors. Competitive landscape analysis reveals a mix of established aerospace and defense companies alongside emerging innovative players, leading to intense R&D activity and continuous product improvement.
Electric Propulsion Systems Industry Market Size (In Billion)
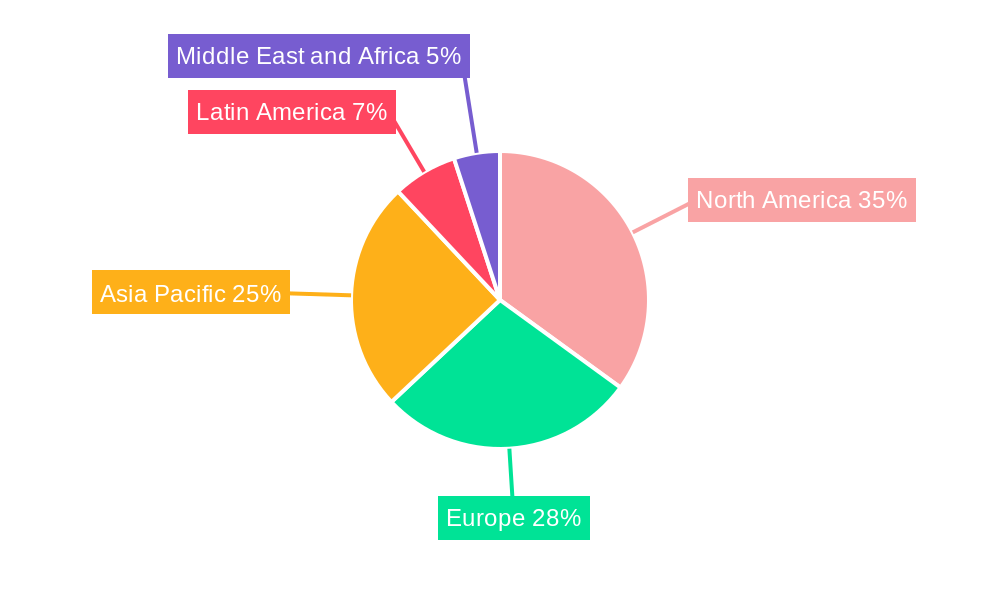
The market's growth trajectory is expected to be influenced by several factors. Continued investment in research and development will be crucial for improving battery technology, power electronics, and motor designs. The integration of EPS into various transportation modes will be a key area of focus. Challenges such as the high initial cost of EPS systems and the need for robust infrastructure to support widespread adoption remain. However, ongoing technological advancements and increasing government support are expected to mitigate these challenges over the forecast period. Regional variations in market growth are anticipated, with North America and Asia Pacific likely to dominate due to the strong presence of key players and substantial government investments in electric mobility initiatives. The European market is also expected to contribute significantly due to its focus on sustainable transportation policies.
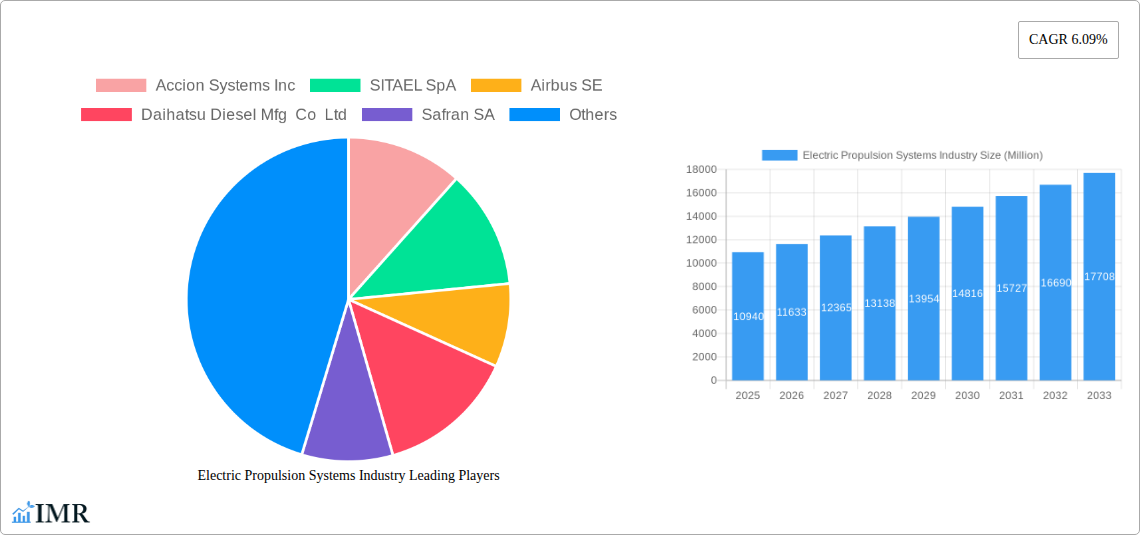
Electric Propulsion Systems Industry Company Market Share
Electric Propulsion Systems Industry: A Comprehensive Market Report (2019-2033)
This comprehensive report provides an in-depth analysis of the Electric Propulsion Systems (EPS) industry, encompassing market dynamics, growth trends, regional analysis, competitive landscape, and future outlook. The study covers the period from 2019 to 2033, with a focus on the base year 2025 and a forecast period of 2025-2033. The report segments the market by type (Hybrid, Full-electric) and application (Airborne, Terrestrial, Marine, Space), offering granular insights into each segment's performance and growth trajectory. The global market is expected to reach xx Million units by 2033.
Electric Propulsion Systems Industry Market Dynamics & Structure
This section analyzes the market structure, highlighting key players, market concentration, technological innovation, regulatory landscapes, and competitive dynamics. We explore the influence of mergers and acquisitions (M&A) activity, examining deal volumes and their impact on the market landscape. The analysis delves into end-user demographics and their evolving needs, shaping the demand for EPS.
- Market Concentration: The EPS market is characterized by a mix of established players and emerging companies. Market share analysis reveals the dominance of certain players, with xx% market share held by the top 5 companies in 2025.
- Technological Innovation: Continuous advancements in power electronics, battery technology, and motor design are key drivers of innovation within the industry. The development of more efficient and powerful EPS is crucial for expanding market penetration.
- Regulatory Frameworks: Stringent emission regulations and government incentives for electric vehicles (EVs) are significantly impacting the adoption of EPS across various applications. These regulations vary across regions, creating diverse market opportunities.
- Competitive Substitutes: Internal combustion engines (ICE) remain a primary competitor, although their market share is declining due to environmental concerns and technological advancements. The development of alternative energy sources also presents a challenge to the growth of EPS.
- End-User Demographics: The growth of EPS is driven by various sectors, including the automotive, aerospace, and marine industries. Shifting consumer preferences towards sustainable solutions further fuels this growth.
- M&A Trends: The past five years have seen xx M&A deals within the EPS industry, with key players consolidating their market positions through strategic acquisitions. This consolidation is expected to continue in the forecast period.
Electric Propulsion Systems Industry Growth Trends & Insights
This section utilizes extensive data analysis to project market size evolution, adoption rates, and technological disruptions influencing the EPS market. We examine the impact of consumer behavior shifts and evolving preferences on market growth.
The global electric propulsion systems market is projected to witness significant growth, with a Compound Annual Growth Rate (CAGR) of xx% during the forecast period (2025-2033). This growth is primarily driven by increasing demand for electric vehicles across various sectors, coupled with stringent environmental regulations and the continuous advancement of electric propulsion technologies. The market penetration rate is expected to rise from xx% in 2025 to xx% by 2033. This rapid adoption can be attributed to several factors including decreasing battery costs, improved efficiency, and ongoing technological innovations that enhance the performance and reliability of electric propulsion systems. However, challenges such as infrastructure limitations, high initial costs, and range anxiety may hinder growth in certain segments. The increasing adoption of hybrid electric vehicles (HEVs) and battery electric vehicles (BEVs) is a key driver in the airborne and terrestrial sectors. The marine and space sectors are experiencing moderate growth, driven by advancements in battery technology and reduced weight and size of electric propulsion units.
Dominant Regions, Countries, or Segments in Electric Propulsion Systems Industry
This section identifies the leading regions, countries, and segments driving market growth. It provides a detailed analysis of the factors contributing to their dominance, including market share, growth potential, and supporting economic policies.
- By Type: The full-electric segment is expected to dominate the market, driven by advancements in battery technology and increasing demand for zero-emission vehicles. The hybrid segment will also experience significant growth, particularly in applications where range and payload capacity are crucial considerations.
- By Application: The airborne and terrestrial segments are expected to lead the market due to the high adoption of electric and hybrid vehicles in these sectors. The space segment is experiencing moderate growth driven by increasing demand for electric propulsion systems in satellites and spacecraft. Marine applications are also seeing increasing demand for electric propulsion due to environmental regulations.
- Leading Regions/Countries: North America and Europe are currently leading the market, driven by supportive government policies, robust infrastructure, and high consumer adoption of electric vehicles. Asia-Pacific is expected to witness significant growth in the forecast period, fueled by increasing demand from China and India. Specific country-level analysis reveals xx as the leading nation in xx segment. This dominance stems from factors such as xx (economic policies, government incentives, favorable regulatory frameworks).
Electric Propulsion Systems Industry Product Landscape
The electric propulsion systems market is witnessing continuous innovation, with manufacturers focusing on developing more efficient, reliable, and cost-effective products. Advancements in motor technology, power electronics, and battery management systems are driving improvements in system performance, including higher power density, improved efficiency, and extended lifespan. Key features such as compact design, reduced weight, and high torque output are crucial selling propositions for EPS manufacturers. The integration of advanced control algorithms and sophisticated diagnostic systems is enhancing the overall usability and operational efficiency of the products.
Key Drivers, Barriers & Challenges in Electric Propulsion Systems Industry
Key Drivers:
- Government Regulations: Stringent emission regulations are pushing the adoption of cleaner transportation solutions.
- Technological Advancements: Improvements in battery technology and power electronics are enhancing EPS performance.
- Cost Reduction: Decreasing battery costs are making EPS more affordable for wider applications.
Challenges and Restraints:
- High Initial Costs: The high upfront investment in EPS remains a barrier for some applications.
- Infrastructure Limitations: Lack of charging infrastructure can hinder the wider adoption of electric vehicles.
- Range Anxiety: Concerns about limited driving range in electric vehicles persist among consumers. Current technologies result in a xx% reduction in range compared to ICE counterparts, impacting adoption rates.
Emerging Opportunities in Electric Propulsion Systems Industry
Emerging opportunities lie in the expansion into untapped markets such as developing economies and the exploration of innovative applications in drones, robotics, and micro-mobility. The growth of electric aviation and the rising demand for sustainable shipping are further catalysts for growth. Consumer preferences are increasingly shifting toward environmentally friendly products, providing a strong impetus for the market's expansion.
Growth Accelerators in the Electric Propulsion Systems Industry
Long-term growth will be fueled by continued technological advancements, particularly in battery technology and power electronics. Strategic partnerships between manufacturers and technology providers will play a crucial role in accelerating innovation and market penetration. Government support through incentives and subsidies remains vital to fostering market growth and overcoming existing challenges. Expanding market penetration in developing nations presents a significant long-term opportunity for EPS providers.
Key Players Shaping the Electric Propulsion Systems Industry Market
- Accion Systems Inc
- SITAEL SpA
- Airbus SE
- Daihatsu Diesel Mfg Co Ltd
- Safran SA
- Aerojet Rocketdyne Holdings Inc
- Orbital ATK (Northrop Grumman Corporation)
- Efficient Drivetrains Inc (Cummins Inc)
- Collins Aerospace (RTX Corporation)
- Busek Co Inc
- Thales Alenia Space
- General Electric Company
- The Boeing Company
Notable Milestones in Electric Propulsion Systems Industry Sector
- 2020-03: Accion Systems launched its next-generation micro-propulsion system.
- 2021-11: Airbus announced a significant investment in electric aircraft propulsion technology.
- 2022-05: Safran SA acquired a key electric motor manufacturer, expanding its portfolio.
- 2023-02: Significant advancements in battery technology were announced by several key players. (Specific examples to be added based on actual data)
In-Depth Electric Propulsion Systems Industry Market Outlook
The future of the electric propulsion systems market is promising, with significant growth potential driven by technological innovations, expanding applications, and supportive government policies. The market will continue to evolve with the emergence of new materials, improved manufacturing processes, and breakthroughs in energy storage technologies. The integration of artificial intelligence (AI) and machine learning (ML) for enhanced system optimization and predictive maintenance will further drive market growth. Strategic collaborations and partnerships will become increasingly important for manufacturers to stay competitive and meet the growing demand. The expansion into emerging markets, particularly in the developing world, represents a substantial opportunity for future market growth.
Electric Propulsion Systems Industry Segmentation
- 1. Production Analysis
- 2. Consumption Analysis
- 3. Import Market Analysis (Value & Volume)
- 4. Export Market Analysis (Value & Volume)
- 5. Price Trend Analysis
Electric Propulsion Systems Industry Segmentation By Geography
-
1. North America
- 1.1. United States
- 1.2. Canada
- 1.3. Mexico
-
2. South America
- 2.1. Brazil
- 2.2. Argentina
- 2.3. Rest of South America
-
3. Europe
- 3.1. United Kingdom
- 3.2. Germany
- 3.3. France
- 3.4. Italy
- 3.5. Spain
- 3.6. Russia
- 3.7. Benelux
- 3.8. Nordics
- 3.9. Rest of Europe
-
4. Middle East & Africa
- 4.1. Turkey
- 4.2. Israel
- 4.3. GCC
- 4.4. North Africa
- 4.5. South Africa
- 4.6. Rest of Middle East & Africa
-
5. Asia Pacific
- 5.1. China
- 5.2. India
- 5.3. Japan
- 5.4. South Korea
- 5.5. ASEAN
- 5.6. Oceania
- 5.7. Rest of Asia Pacific
Electric Propulsion Systems Industry Regional Market Share
Geographic Coverage of Electric Propulsion Systems Industry
Electric Propulsion Systems Industry REPORT HIGHLIGHTS
| Aspects | Details |
|---|---|
| Study Period | 2020-2034 |
| Base Year | 2025 |
| Estimated Year | 2026 |
| Forecast Period | 2026-2034 |
| Historical Period | 2020-2025 |
| Growth Rate | CAGR of 6.09% from 2020-2034 |
| Segmentation |
|
Table of Contents
- 1. Introduction
- 1.1. Research Scope
- 1.2. Market Segmentation
- 1.3. Research Objective
- 1.4. Definitions and Assumptions
- 2. Executive Summary
- 2.1. Market Snapshot
- 3. Market Dynamics
- 3.1. Market Drivers
- 3.2. Market Restrains
- 3.3. Market Trends
- 3.4. Market Opportunities
- 4. Market Factor Analysis
- 4.1. Porters Five Forces
- 4.1.1. Bargaining Power of Suppliers
- 4.1.2. Bargaining Power of Buyers
- 4.1.3. Threat of New Entrants
- 4.1.4. Threat of Substitutes
- 4.1.5. Competitive Rivalry
- 4.2. PESTEL analysis
- 4.3. BCG Analysis
- 4.3.1. Stars (High Growth, High Market Share)
- 4.3.2. Cash Cows (Low Growth, High Market Share)
- 4.3.3. Question Mark (High Growth, Low Market Share)
- 4.3.4. Dogs (Low Growth, Low Market Share)
- 4.4. Ansoff Matrix Analysis
- 4.5. Supply Chain Analysis
- 4.6. Regulatory Landscape
- 4.7. Current Market Potential and Opportunity Assessment (TAM–SAM–SOM Framework)
- 4.8. IMR Analyst Note
- 4.1. Porters Five Forces
- 5. Market Analysis, Insights and Forecast 2021-2033
- 5.1. Market Analysis, Insights and Forecast - by Production Analysis
- 5.2. Market Analysis, Insights and Forecast - by Consumption Analysis
- 5.3. Market Analysis, Insights and Forecast - by Import Market Analysis (Value & Volume)
- 5.4. Market Analysis, Insights and Forecast - by Export Market Analysis (Value & Volume)
- 5.5. Market Analysis, Insights and Forecast - by Price Trend Analysis
- 5.6. Market Analysis, Insights and Forecast - by Region
- 5.6.1. North America
- 5.6.2. South America
- 5.6.3. Europe
- 5.6.4. Middle East & Africa
- 5.6.5. Asia Pacific
- 6. Global Electric Propulsion Systems Industry Analysis, Insights and Forecast, 2021-2033
- 6.1. Market Analysis, Insights and Forecast - by Production Analysis
- 6.2. Market Analysis, Insights and Forecast - by Consumption Analysis
- 6.3. Market Analysis, Insights and Forecast - by Import Market Analysis (Value & Volume)
- 6.4. Market Analysis, Insights and Forecast - by Export Market Analysis (Value & Volume)
- 6.5. Market Analysis, Insights and Forecast - by Price Trend Analysis
- 7. North America Electric Propulsion Systems Industry Analysis, Insights and Forecast, 2020-2032
- 7.1. Market Analysis, Insights and Forecast - by Production Analysis
- 7.2. Market Analysis, Insights and Forecast - by Consumption Analysis
- 7.3. Market Analysis, Insights and Forecast - by Import Market Analysis (Value & Volume)
- 7.4. Market Analysis, Insights and Forecast - by Export Market Analysis (Value & Volume)
- 7.5. Market Analysis, Insights and Forecast - by Price Trend Analysis
- 8. South America Electric Propulsion Systems Industry Analysis, Insights and Forecast, 2020-2032
- 8.1. Market Analysis, Insights and Forecast - by Production Analysis
- 8.2. Market Analysis, Insights and Forecast - by Consumption Analysis
- 8.3. Market Analysis, Insights and Forecast - by Import Market Analysis (Value & Volume)
- 8.4. Market Analysis, Insights and Forecast - by Export Market Analysis (Value & Volume)
- 8.5. Market Analysis, Insights and Forecast - by Price Trend Analysis
- 9. Europe Electric Propulsion Systems Industry Analysis, Insights and Forecast, 2020-2032
- 9.1. Market Analysis, Insights and Forecast - by Production Analysis
- 9.2. Market Analysis, Insights and Forecast - by Consumption Analysis
- 9.3. Market Analysis, Insights and Forecast - by Import Market Analysis (Value & Volume)
- 9.4. Market Analysis, Insights and Forecast - by Export Market Analysis (Value & Volume)
- 9.5. Market Analysis, Insights and Forecast - by Price Trend Analysis
- 10. Middle East & Africa Electric Propulsion Systems Industry Analysis, Insights and Forecast, 2020-2032
- 10.1. Market Analysis, Insights and Forecast - by Production Analysis
- 10.2. Market Analysis, Insights and Forecast - by Consumption Analysis
- 10.3. Market Analysis, Insights and Forecast - by Import Market Analysis (Value & Volume)
- 10.4. Market Analysis, Insights and Forecast - by Export Market Analysis (Value & Volume)
- 10.5. Market Analysis, Insights and Forecast - by Price Trend Analysis
- 11. Asia Pacific Electric Propulsion Systems Industry Analysis, Insights and Forecast, 2020-2032
- 11.1. Market Analysis, Insights and Forecast - by Production Analysis
- 11.2. Market Analysis, Insights and Forecast - by Consumption Analysis
- 11.3. Market Analysis, Insights and Forecast - by Import Market Analysis (Value & Volume)
- 11.4. Market Analysis, Insights and Forecast - by Export Market Analysis (Value & Volume)
- 11.5. Market Analysis, Insights and Forecast - by Price Trend Analysis
- 12. Competitive Analysis
- 12.1. Company Profiles
- 12.1.1 Accion Systems Inc
- 12.1.1.1. Company Overview
- 12.1.1.2. Products
- 12.1.1.3. Company Financials
- 12.1.1.4. SWOT Analysis
- 12.1.2 SITAEL SpA
- 12.1.2.1. Company Overview
- 12.1.2.2. Products
- 12.1.2.3. Company Financials
- 12.1.2.4. SWOT Analysis
- 12.1.3 Airbus SE
- 12.1.3.1. Company Overview
- 12.1.3.2. Products
- 12.1.3.3. Company Financials
- 12.1.3.4. SWOT Analysis
- 12.1.4 Daihatsu Diesel Mfg Co Ltd
- 12.1.4.1. Company Overview
- 12.1.4.2. Products
- 12.1.4.3. Company Financials
- 12.1.4.4. SWOT Analysis
- 12.1.5 Safran SA
- 12.1.5.1. Company Overview
- 12.1.5.2. Products
- 12.1.5.3. Company Financials
- 12.1.5.4. SWOT Analysis
- 12.1.6 Aerojet Rocketdyne Holdings Inc
- 12.1.6.1. Company Overview
- 12.1.6.2. Products
- 12.1.6.3. Company Financials
- 12.1.6.4. SWOT Analysis
- 12.1.7 Orbital ATK (Northrop Grumman Corporation)
- 12.1.7.1. Company Overview
- 12.1.7.2. Products
- 12.1.7.3. Company Financials
- 12.1.7.4. SWOT Analysis
- 12.1.8 Efficient Drivetrains Inc (Cummins Inc )
- 12.1.8.1. Company Overview
- 12.1.8.2. Products
- 12.1.8.3. Company Financials
- 12.1.8.4. SWOT Analysis
- 12.1.9 Collins Aerospace (RTX Corporation
- 12.1.9.1. Company Overview
- 12.1.9.2. Products
- 12.1.9.3. Company Financials
- 12.1.9.4. SWOT Analysis
- 12.1.10 Busek Co Inc
- 12.1.10.1. Company Overview
- 12.1.10.2. Products
- 12.1.10.3. Company Financials
- 12.1.10.4. SWOT Analysis
- 12.1.11 Thales Alenia Space
- 12.1.11.1. Company Overview
- 12.1.11.2. Products
- 12.1.11.3. Company Financials
- 12.1.11.4. SWOT Analysis
- 12.1.12 General Electric Company
- 12.1.12.1. Company Overview
- 12.1.12.2. Products
- 12.1.12.3. Company Financials
- 12.1.12.4. SWOT Analysis
- 12.1.13 The Boeing Company
- 12.1.13.1. Company Overview
- 12.1.13.2. Products
- 12.1.13.3. Company Financials
- 12.1.13.4. SWOT Analysis
- 12.1.1 Accion Systems Inc
- 12.2. Market Entropy
- 12.2.1 Company's Key Areas Served
- 12.2.2 Recent Developments
- 12.3. Company Market Share Analysis 2025
- 12.3.1 Top 5 Companies Market Share Analysis
- 12.3.2 Top 3 Companies Market Share Analysis
- 12.4. List of Potential Customers
- 13. Research Methodology
List of Figures
- Figure 1: Global Electric Propulsion Systems Industry Revenue Breakdown (Million, %) by Region 2025 & 2033
- Figure 2: North America Electric Propulsion Systems Industry Revenue (Million), by Production Analysis 2025 & 2033
- Figure 3: North America Electric Propulsion Systems Industry Revenue Share (%), by Production Analysis 2025 & 2033
- Figure 4: North America Electric Propulsion Systems Industry Revenue (Million), by Consumption Analysis 2025 & 2033
- Figure 5: North America Electric Propulsion Systems Industry Revenue Share (%), by Consumption Analysis 2025 & 2033
- Figure 6: North America Electric Propulsion Systems Industry Revenue (Million), by Import Market Analysis (Value & Volume) 2025 & 2033
- Figure 7: North America Electric Propulsion Systems Industry Revenue Share (%), by Import Market Analysis (Value & Volume) 2025 & 2033
- Figure 8: North America Electric Propulsion Systems Industry Revenue (Million), by Export Market Analysis (Value & Volume) 2025 & 2033
- Figure 9: North America Electric Propulsion Systems Industry Revenue Share (%), by Export Market Analysis (Value & Volume) 2025 & 2033
- Figure 10: North America Electric Propulsion Systems Industry Revenue (Million), by Price Trend Analysis 2025 & 2033
- Figure 11: North America Electric Propulsion Systems Industry Revenue Share (%), by Price Trend Analysis 2025 & 2033
- Figure 12: North America Electric Propulsion Systems Industry Revenue (Million), by Country 2025 & 2033
- Figure 13: North America Electric Propulsion Systems Industry Revenue Share (%), by Country 2025 & 2033
- Figure 14: South America Electric Propulsion Systems Industry Revenue (Million), by Production Analysis 2025 & 2033
- Figure 15: South America Electric Propulsion Systems Industry Revenue Share (%), by Production Analysis 2025 & 2033
- Figure 16: South America Electric Propulsion Systems Industry Revenue (Million), by Consumption Analysis 2025 & 2033
- Figure 17: South America Electric Propulsion Systems Industry Revenue Share (%), by Consumption Analysis 2025 & 2033
- Figure 18: South America Electric Propulsion Systems Industry Revenue (Million), by Import Market Analysis (Value & Volume) 2025 & 2033
- Figure 19: South America Electric Propulsion Systems Industry Revenue Share (%), by Import Market Analysis (Value & Volume) 2025 & 2033
- Figure 20: South America Electric Propulsion Systems Industry Revenue (Million), by Export Market Analysis (Value & Volume) 2025 & 2033
- Figure 21: South America Electric Propulsion Systems Industry Revenue Share (%), by Export Market Analysis (Value & Volume) 2025 & 2033
- Figure 22: South America Electric Propulsion Systems Industry Revenue (Million), by Price Trend Analysis 2025 & 2033
- Figure 23: South America Electric Propulsion Systems Industry Revenue Share (%), by Price Trend Analysis 2025 & 2033
- Figure 24: South America Electric Propulsion Systems Industry Revenue (Million), by Country 2025 & 2033
- Figure 25: South America Electric Propulsion Systems Industry Revenue Share (%), by Country 2025 & 2033
- Figure 26: Europe Electric Propulsion Systems Industry Revenue (Million), by Production Analysis 2025 & 2033
- Figure 27: Europe Electric Propulsion Systems Industry Revenue Share (%), by Production Analysis 2025 & 2033
- Figure 28: Europe Electric Propulsion Systems Industry Revenue (Million), by Consumption Analysis 2025 & 2033
- Figure 29: Europe Electric Propulsion Systems Industry Revenue Share (%), by Consumption Analysis 2025 & 2033
- Figure 30: Europe Electric Propulsion Systems Industry Revenue (Million), by Import Market Analysis (Value & Volume) 2025 & 2033
- Figure 31: Europe Electric Propulsion Systems Industry Revenue Share (%), by Import Market Analysis (Value & Volume) 2025 & 2033
- Figure 32: Europe Electric Propulsion Systems Industry Revenue (Million), by Export Market Analysis (Value & Volume) 2025 & 2033
- Figure 33: Europe Electric Propulsion Systems Industry Revenue Share (%), by Export Market Analysis (Value & Volume) 2025 & 2033
- Figure 34: Europe Electric Propulsion Systems Industry Revenue (Million), by Price Trend Analysis 2025 & 2033
- Figure 35: Europe Electric Propulsion Systems Industry Revenue Share (%), by Price Trend Analysis 2025 & 2033
- Figure 36: Europe Electric Propulsion Systems Industry Revenue (Million), by Country 2025 & 2033
- Figure 37: Europe Electric Propulsion Systems Industry Revenue Share (%), by Country 2025 & 2033
- Figure 38: Middle East & Africa Electric Propulsion Systems Industry Revenue (Million), by Production Analysis 2025 & 2033
- Figure 39: Middle East & Africa Electric Propulsion Systems Industry Revenue Share (%), by Production Analysis 2025 & 2033
- Figure 40: Middle East & Africa Electric Propulsion Systems Industry Revenue (Million), by Consumption Analysis 2025 & 2033
- Figure 41: Middle East & Africa Electric Propulsion Systems Industry Revenue Share (%), by Consumption Analysis 2025 & 2033
- Figure 42: Middle East & Africa Electric Propulsion Systems Industry Revenue (Million), by Import Market Analysis (Value & Volume) 2025 & 2033
- Figure 43: Middle East & Africa Electric Propulsion Systems Industry Revenue Share (%), by Import Market Analysis (Value & Volume) 2025 & 2033
- Figure 44: Middle East & Africa Electric Propulsion Systems Industry Revenue (Million), by Export Market Analysis (Value & Volume) 2025 & 2033
- Figure 45: Middle East & Africa Electric Propulsion Systems Industry Revenue Share (%), by Export Market Analysis (Value & Volume) 2025 & 2033
- Figure 46: Middle East & Africa Electric Propulsion Systems Industry Revenue (Million), by Price Trend Analysis 2025 & 2033
- Figure 47: Middle East & Africa Electric Propulsion Systems Industry Revenue Share (%), by Price Trend Analysis 2025 & 2033
- Figure 48: Middle East & Africa Electric Propulsion Systems Industry Revenue (Million), by Country 2025 & 2033
- Figure 49: Middle East & Africa Electric Propulsion Systems Industry Revenue Share (%), by Country 2025 & 2033
- Figure 50: Asia Pacific Electric Propulsion Systems Industry Revenue (Million), by Production Analysis 2025 & 2033
- Figure 51: Asia Pacific Electric Propulsion Systems Industry Revenue Share (%), by Production Analysis 2025 & 2033
- Figure 52: Asia Pacific Electric Propulsion Systems Industry Revenue (Million), by Consumption Analysis 2025 & 2033
- Figure 53: Asia Pacific Electric Propulsion Systems Industry Revenue Share (%), by Consumption Analysis 2025 & 2033
- Figure 54: Asia Pacific Electric Propulsion Systems Industry Revenue (Million), by Import Market Analysis (Value & Volume) 2025 & 2033
- Figure 55: Asia Pacific Electric Propulsion Systems Industry Revenue Share (%), by Import Market Analysis (Value & Volume) 2025 & 2033
- Figure 56: Asia Pacific Electric Propulsion Systems Industry Revenue (Million), by Export Market Analysis (Value & Volume) 2025 & 2033
- Figure 57: Asia Pacific Electric Propulsion Systems Industry Revenue Share (%), by Export Market Analysis (Value & Volume) 2025 & 2033
- Figure 58: Asia Pacific Electric Propulsion Systems Industry Revenue (Million), by Price Trend Analysis 2025 & 2033
- Figure 59: Asia Pacific Electric Propulsion Systems Industry Revenue Share (%), by Price Trend Analysis 2025 & 2033
- Figure 60: Asia Pacific Electric Propulsion Systems Industry Revenue (Million), by Country 2025 & 2033
- Figure 61: Asia Pacific Electric Propulsion Systems Industry Revenue Share (%), by Country 2025 & 2033
List of Tables
- Table 1: Global Electric Propulsion Systems Industry Revenue Million Forecast, by Production Analysis 2020 & 2033
- Table 2: Global Electric Propulsion Systems Industry Revenue Million Forecast, by Consumption Analysis 2020 & 2033
- Table 3: Global Electric Propulsion Systems Industry Revenue Million Forecast, by Import Market Analysis (Value & Volume) 2020 & 2033
- Table 4: Global Electric Propulsion Systems Industry Revenue Million Forecast, by Export Market Analysis (Value & Volume) 2020 & 2033
- Table 5: Global Electric Propulsion Systems Industry Revenue Million Forecast, by Price Trend Analysis 2020 & 2033
- Table 6: Global Electric Propulsion Systems Industry Revenue Million Forecast, by Region 2020 & 2033
- Table 7: Global Electric Propulsion Systems Industry Revenue Million Forecast, by Production Analysis 2020 & 2033
- Table 8: Global Electric Propulsion Systems Industry Revenue Million Forecast, by Consumption Analysis 2020 & 2033
- Table 9: Global Electric Propulsion Systems Industry Revenue Million Forecast, by Import Market Analysis (Value & Volume) 2020 & 2033
- Table 10: Global Electric Propulsion Systems Industry Revenue Million Forecast, by Export Market Analysis (Value & Volume) 2020 & 2033
- Table 11: Global Electric Propulsion Systems Industry Revenue Million Forecast, by Price Trend Analysis 2020 & 2033
- Table 12: Global Electric Propulsion Systems Industry Revenue Million Forecast, by Country 2020 & 2033
- Table 13: United States Electric Propulsion Systems Industry Revenue (Million) Forecast, by Application 2020 & 2033
- Table 14: Canada Electric Propulsion Systems Industry Revenue (Million) Forecast, by Application 2020 & 2033
- Table 15: Mexico Electric Propulsion Systems Industry Revenue (Million) Forecast, by Application 2020 & 2033
- Table 16: Global Electric Propulsion Systems Industry Revenue Million Forecast, by Production Analysis 2020 & 2033
- Table 17: Global Electric Propulsion Systems Industry Revenue Million Forecast, by Consumption Analysis 2020 & 2033
- Table 18: Global Electric Propulsion Systems Industry Revenue Million Forecast, by Import Market Analysis (Value & Volume) 2020 & 2033
- Table 19: Global Electric Propulsion Systems Industry Revenue Million Forecast, by Export Market Analysis (Value & Volume) 2020 & 2033
- Table 20: Global Electric Propulsion Systems Industry Revenue Million Forecast, by Price Trend Analysis 2020 & 2033
- Table 21: Global Electric Propulsion Systems Industry Revenue Million Forecast, by Country 2020 & 2033
- Table 22: Brazil Electric Propulsion Systems Industry Revenue (Million) Forecast, by Application 2020 & 2033
- Table 23: Argentina Electric Propulsion Systems Industry Revenue (Million) Forecast, by Application 2020 & 2033
- Table 24: Rest of South America Electric Propulsion Systems Industry Revenue (Million) Forecast, by Application 2020 & 2033
- Table 25: Global Electric Propulsion Systems Industry Revenue Million Forecast, by Production Analysis 2020 & 2033
- Table 26: Global Electric Propulsion Systems Industry Revenue Million Forecast, by Consumption Analysis 2020 & 2033
- Table 27: Global Electric Propulsion Systems Industry Revenue Million Forecast, by Import Market Analysis (Value & Volume) 2020 & 2033
- Table 28: Global Electric Propulsion Systems Industry Revenue Million Forecast, by Export Market Analysis (Value & Volume) 2020 & 2033
- Table 29: Global Electric Propulsion Systems Industry Revenue Million Forecast, by Price Trend Analysis 2020 & 2033
- Table 30: Global Electric Propulsion Systems Industry Revenue Million Forecast, by Country 2020 & 2033
- Table 31: United Kingdom Electric Propulsion Systems Industry Revenue (Million) Forecast, by Application 2020 & 2033
- Table 32: Germany Electric Propulsion Systems Industry Revenue (Million) Forecast, by Application 2020 & 2033
- Table 33: France Electric Propulsion Systems Industry Revenue (Million) Forecast, by Application 2020 & 2033
- Table 34: Italy Electric Propulsion Systems Industry Revenue (Million) Forecast, by Application 2020 & 2033
- Table 35: Spain Electric Propulsion Systems Industry Revenue (Million) Forecast, by Application 2020 & 2033
- Table 36: Russia Electric Propulsion Systems Industry Revenue (Million) Forecast, by Application 2020 & 2033
- Table 37: Benelux Electric Propulsion Systems Industry Revenue (Million) Forecast, by Application 2020 & 2033
- Table 38: Nordics Electric Propulsion Systems Industry Revenue (Million) Forecast, by Application 2020 & 2033
- Table 39: Rest of Europe Electric Propulsion Systems Industry Revenue (Million) Forecast, by Application 2020 & 2033
- Table 40: Global Electric Propulsion Systems Industry Revenue Million Forecast, by Production Analysis 2020 & 2033
- Table 41: Global Electric Propulsion Systems Industry Revenue Million Forecast, by Consumption Analysis 2020 & 2033
- Table 42: Global Electric Propulsion Systems Industry Revenue Million Forecast, by Import Market Analysis (Value & Volume) 2020 & 2033
- Table 43: Global Electric Propulsion Systems Industry Revenue Million Forecast, by Export Market Analysis (Value & Volume) 2020 & 2033
- Table 44: Global Electric Propulsion Systems Industry Revenue Million Forecast, by Price Trend Analysis 2020 & 2033
- Table 45: Global Electric Propulsion Systems Industry Revenue Million Forecast, by Country 2020 & 2033
- Table 46: Turkey Electric Propulsion Systems Industry Revenue (Million) Forecast, by Application 2020 & 2033
- Table 47: Israel Electric Propulsion Systems Industry Revenue (Million) Forecast, by Application 2020 & 2033
- Table 48: GCC Electric Propulsion Systems Industry Revenue (Million) Forecast, by Application 2020 & 2033
- Table 49: North Africa Electric Propulsion Systems Industry Revenue (Million) Forecast, by Application 2020 & 2033
- Table 50: South Africa Electric Propulsion Systems Industry Revenue (Million) Forecast, by Application 2020 & 2033
- Table 51: Rest of Middle East & Africa Electric Propulsion Systems Industry Revenue (Million) Forecast, by Application 2020 & 2033
- Table 52: Global Electric Propulsion Systems Industry Revenue Million Forecast, by Production Analysis 2020 & 2033
- Table 53: Global Electric Propulsion Systems Industry Revenue Million Forecast, by Consumption Analysis 2020 & 2033
- Table 54: Global Electric Propulsion Systems Industry Revenue Million Forecast, by Import Market Analysis (Value & Volume) 2020 & 2033
- Table 55: Global Electric Propulsion Systems Industry Revenue Million Forecast, by Export Market Analysis (Value & Volume) 2020 & 2033
- Table 56: Global Electric Propulsion Systems Industry Revenue Million Forecast, by Price Trend Analysis 2020 & 2033
- Table 57: Global Electric Propulsion Systems Industry Revenue Million Forecast, by Country 2020 & 2033
- Table 58: China Electric Propulsion Systems Industry Revenue (Million) Forecast, by Application 2020 & 2033
- Table 59: India Electric Propulsion Systems Industry Revenue (Million) Forecast, by Application 2020 & 2033
- Table 60: Japan Electric Propulsion Systems Industry Revenue (Million) Forecast, by Application 2020 & 2033
- Table 61: South Korea Electric Propulsion Systems Industry Revenue (Million) Forecast, by Application 2020 & 2033
- Table 62: ASEAN Electric Propulsion Systems Industry Revenue (Million) Forecast, by Application 2020 & 2033
- Table 63: Oceania Electric Propulsion Systems Industry Revenue (Million) Forecast, by Application 2020 & 2033
- Table 64: Rest of Asia Pacific Electric Propulsion Systems Industry Revenue (Million) Forecast, by Application 2020 & 2033
Frequently Asked Questions
1. What is the projected Compound Annual Growth Rate (CAGR) of the Electric Propulsion Systems Industry?
The projected CAGR is approximately 6.09%.
2. Which companies are prominent players in the Electric Propulsion Systems Industry?
Key companies in the market include Accion Systems Inc, SITAEL SpA, Airbus SE, Daihatsu Diesel Mfg Co Ltd, Safran SA, Aerojet Rocketdyne Holdings Inc, Orbital ATK (Northrop Grumman Corporation), Efficient Drivetrains Inc (Cummins Inc ), Collins Aerospace (RTX Corporation, Busek Co Inc, Thales Alenia Space, General Electric Company, The Boeing Company.
3. What are the main segments of the Electric Propulsion Systems Industry?
The market segments include Production Analysis, Consumption Analysis, Import Market Analysis (Value & Volume), Export Market Analysis (Value & Volume), Price Trend Analysis.
4. Can you provide details about the market size?
The market size is estimated to be USD 10.94 Million as of 2022.
5. What are some drivers contributing to market growth?
; Increased Seaborne Threats And Ambiguous Maritime Security Policies; Increasing Adoption Of Security Technologies In Bric Countries.
6. What are the notable trends driving market growth?
Space Segment Envisioned to Experience Highest Growth During the Forecast Period.
7. Are there any restraints impacting market growth?
; High Risk Rate In Ungoverned Zones; Unstructured Security Standards And Technologies.
8. Can you provide examples of recent developments in the market?
N/A
9. What pricing options are available for accessing the report?
Pricing options include single-user, multi-user, and enterprise licenses priced at USD 4750, USD 5250, and USD 8750 respectively.
10. Is the market size provided in terms of value or volume?
The market size is provided in terms of value, measured in Million.
11. Are there any specific market keywords associated with the report?
Yes, the market keyword associated with the report is "Electric Propulsion Systems Industry," which aids in identifying and referencing the specific market segment covered.
12. How do I determine which pricing option suits my needs best?
The pricing options vary based on user requirements and access needs. Individual users may opt for single-user licenses, while businesses requiring broader access may choose multi-user or enterprise licenses for cost-effective access to the report.
13. Are there any additional resources or data provided in the Electric Propulsion Systems Industry report?
While the report offers comprehensive insights, it's advisable to review the specific contents or supplementary materials provided to ascertain if additional resources or data are available.
14. How can I stay updated on further developments or reports in the Electric Propulsion Systems Industry?
To stay informed about further developments, trends, and reports in the Electric Propulsion Systems Industry, consider subscribing to industry newsletters, following relevant companies and organizations, or regularly checking reputable industry news sources and publications.
Methodology
Step 1 - Identification of Relevant Samples Size from Population Database


Step 2 - Approaches for Defining Global Market Size (Value, Volume* & Price*)

Note*: In applicable scenarios
Step 3 - Data Sources
Primary Research
- Web Analytics
- Survey Reports
- Research Institute
- Latest Research Reports
- Opinion Leaders
Secondary Research
- Annual Reports
- White Paper
- Latest Press Release
- Industry Association
- Paid Database
- Investor Presentations

Step 4 - Data Triangulation
Involves using different sources of information in order to increase the validity of a study
These sources are likely to be stakeholders in a program - participants, other researchers, program staff, other community members, and so on.
Then we put all data in single framework & apply various statistical tools to find out the dynamic on the market.
During the analysis stage, feedback from the stakeholder groups would be compared to determine areas of agreement as well as areas of divergence