

Key Insights
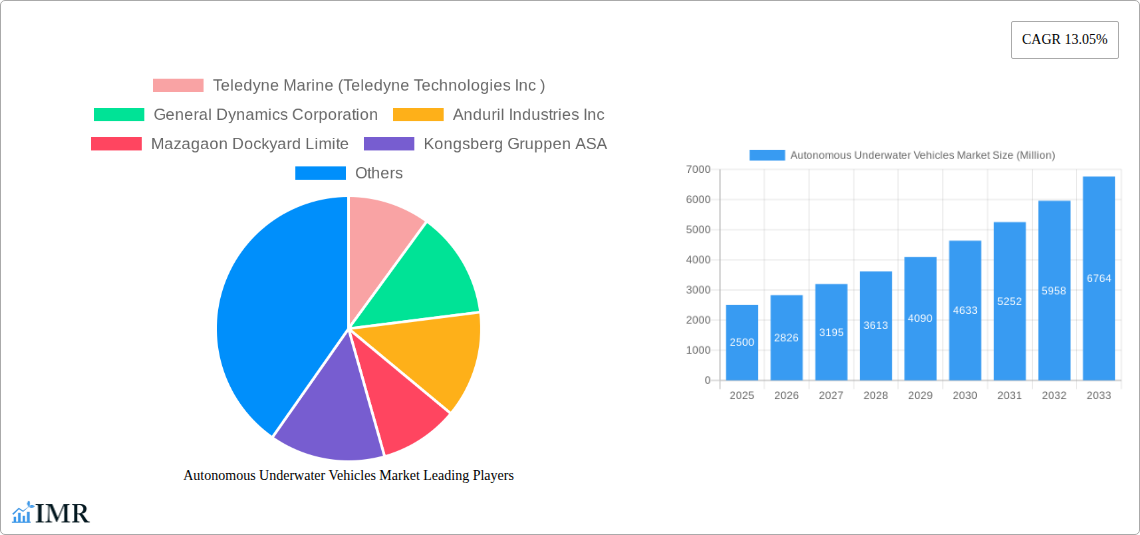
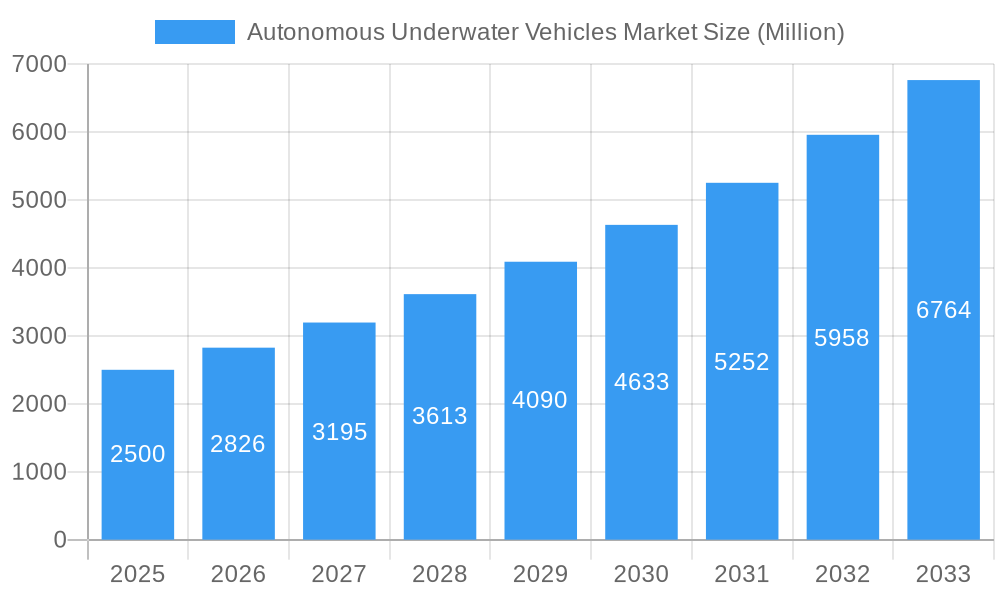
The Autonomous Underwater Vehicles (AUV) market is poised for significant expansion, driven by escalating demand across critical industries. With an estimated market size of 3830.7 million in the base year 2025, the sector is projected to achieve a robust compound annual growth rate (CAGR) of 21.7% from 2025 to 2033. Key growth catalysts include advancements in sensor technology, artificial intelligence (AI), and enhanced battery life, which are expanding AUV applications in underwater infrastructure inspection, oceanographic research, and defense surveillance. The burgeoning offshore renewable energy sector, encompassing wind farms and seabed mineral exploration, requires efficient underwater surveying, further stimulating AUV adoption. Government investments in autonomous systems for both civilian and defense initiatives also contribute to this accelerated market growth. Primary application segments fueling this expansion are civil engineering (pipeline inspection, dam surveys), oceanography (seabed mapping, environmental monitoring), and military operations (mine countermeasures, anti-submarine warfare). Key industry leaders, including Teledyne Marine, General Dynamics, and Kongsberg Gruppen, are actively pursuing R&D and strategic acquisitions to fortify their competitive positions.
Autonomous Underwater Vehicles Market Market Size (In Billion)
Geographically, North America and Europe currently dominate the AUV market, underpinned by mature defense and research sectors. The Asia-Pacific region is emerging as a high-growth market, propelled by extensive infrastructure development and increasing government investment in marine technology. While challenges such as substantial initial investment and the requirement for skilled professionals persist, continuous technological innovation and pervasive demand are anticipated to overcome these barriers, ensuring sustained strong growth in the AUV market. The adoption of hybrid propulsion systems represents a significant trend, promising enhanced efficiency and operational endurance for AUVs.
Autonomous Underwater Vehicles Market Company Market Share
Autonomous Underwater Vehicles (AUV) Market: A Comprehensive Report (2019-2033)
This comprehensive report provides an in-depth analysis of the Autonomous Underwater Vehicles (AUV) market, encompassing market dynamics, growth trends, regional dominance, product landscape, key players, and future outlook. The study period covers 2019-2033, with 2025 as the base and estimated year. The report segments the market by application (Civil, Military, Oceanography), propulsion system (Electrical, Mechanical, Hybrid), and geographic regions, offering a granular view of this rapidly evolving sector. The total market size is predicted to reach xx Million units by 2033.
Autonomous Underwater Vehicles Market Dynamics & Structure
The AUV market is characterized by moderate concentration, with key players like Teledyne Marine, Kongsberg Gruppen, and Lockheed Martin holding significant market share. However, the emergence of smaller, innovative companies is increasing competition. Technological advancements, particularly in AI, sensor technology, and energy storage, are driving market growth. Stringent regulatory frameworks concerning underwater operations and data security influence market dynamics. The market also sees increasing activity in mergers and acquisitions (M&A), with xx deals recorded in the last 5 years, indicating industry consolidation. Substitutes, such as remotely operated vehicles (ROVs), exist but AUVs offer unique advantages in terms of autonomy and operational range. End-user demographics are diverse, spanning government agencies (military and research), oil & gas companies, and academic institutions.
- Market Concentration: Moderately concentrated, with top 5 players holding approximately xx% market share.
- Technological Innovation: Significant advancements in AI, sensor technology, and energy-efficient propulsion systems.
- Regulatory Framework: Stringent regulations related to data security and environmental impact.
- Competitive Substitutes: ROVs represent a primary substitute, but with limited autonomy compared to AUVs.
- M&A Activity: xx M&A deals in the last 5 years, demonstrating industry consolidation.
- End-User Demographics: Government agencies, oil & gas companies, academic institutions, and commercial entities.
Autonomous Underwater Vehicles Market Growth Trends & Insights
The AUV market witnessed robust growth from 2019 to 2024, driven by increasing demand for oceanographic research, seabed mapping, and defense applications. The market is projected to exhibit a CAGR of xx% during the forecast period (2025-2033), reaching xx Million units by 2033. Technological disruptions, such as the adoption of AI-powered navigation and advanced sensor integration, are accelerating market adoption. Consumer behavior shifts towards automation and data-driven decision-making further fuel market expansion. Market penetration is currently at xx% in key regions and expected to reach xx% by 2033.
Dominant Regions, Countries, or Segments in Autonomous Underwater Vehicles Market
The North American region currently holds the largest market share due to significant investments in defense and research activities. However, the Asia-Pacific region is experiencing the fastest growth, driven by rising infrastructure development and increasing government spending on maritime security. Within applications, the military segment dominates, accounting for xx% of the total market, due to its strategic importance in underwater surveillance and defense. The civil sector, particularly oceanography and commercial applications, is also growing rapidly, fueled by technological advancements and increasing awareness of ocean exploration. The Electrical propulsion systems segment leads due to advancements in battery technology and greater energy efficiency.
- North America: High market share driven by substantial investments in defense and research.
- Asia-Pacific: Fastest-growing region due to rising infrastructure development and maritime security concerns.
- Military Applications: Dominant segment due to strategic importance in underwater surveillance and defense (xx% Market Share).
- Civil Applications: Rapid growth fueled by oceanography research, underwater infrastructure inspection, and commercial applications.
- Electrical Propulsion Systems: Leading segment due to improved battery technologies and energy efficiency.
Autonomous Underwater Vehicles Market Product Landscape
AUV product innovation focuses on enhancing autonomy, endurance, payload capacity, and data processing capabilities. Advanced sensor integration, AI-powered navigation, and improved communication systems are key features driving product differentiation. High-resolution imaging, improved maneuverability, and increased operational depths are other notable advancements. The unique selling propositions of AUVs include their ability to perform complex underwater tasks autonomously, reducing the need for human intervention in hazardous environments.
Key Drivers, Barriers & Challenges in Autonomous Underwater Vehicles Market
Key Drivers:
- Increasing demand for underwater surveillance and defense applications.
- Rising need for oceanographic research and seabed mapping.
- Advancements in AI, sensor technology, and energy storage solutions.
- Government initiatives and funding programs promoting AUV development.
Key Challenges:
- High initial investment costs associated with AUV development and deployment.
- Technological limitations related to communication, navigation, and endurance in deep-sea environments.
- Regulatory hurdles and environmental concerns surrounding AUV operations.
- Intense competition from established and emerging players in the market. The resulting price pressure limits profit margins.
Emerging Opportunities in Autonomous Underwater Vehicles Market
- Expansion into untapped markets such as aquaculture monitoring and underwater infrastructure inspection.
- Development of smaller, more affordable AUVs for wider adoption.
- Integration of advanced AI and machine learning algorithms for enhanced autonomy and decision-making.
- Focus on sustainable and environmentally friendly AUV designs.
Growth Accelerators in the Autonomous Underwater Vehicles Market Industry
Technological breakthroughs in areas such as AI, sensor technology, and energy storage are crucial growth drivers. Strategic partnerships between technology providers, system integrators, and end-users facilitate market expansion. Targeted marketing strategies focusing on specific applications and end-user needs are also essential for accelerating market growth.
Key Players Shaping the Autonomous Underwater Vehicles Market Market
- Teledyne Marine (Teledyne Technologies Inc)
- General Dynamics Corporation
- Anduril Industries Inc
- Mazagaon Dockyard Limited
- Kongsberg Gruppen ASA
- Lockheed Martin Corporation
- Exail Technologies
- Huntington Ingalls Industries Inc
- The Boeing Company
Notable Milestones in Autonomous Underwater Vehicles Market Sector
- July 2023: Launch of Neerakshi AUV by GRSE Ltd and AEPL in India, signifying a major step towards indigenous AUV development.
- December 2022: UK Royal Navy awarded a GBP 15.5 million (USD 18.86 million) contract to Marlin Submarines Ltd for AUV manufacturing and supply.
- November 2022: Exail Technologies secured a USD 3.72 million contract from the French Defence Procurement Agency for an A18D AUV.
- June 2022: Jaia Robotics secured over USD 1 million in funding for its micro-sized, high-speed AUV development.
In-Depth Autonomous Underwater Vehicles Market Market Outlook
The AUV market is poised for significant growth over the next decade. Continued advancements in technology, coupled with increasing demand across various sectors, will create substantial opportunities for market players. Strategic partnerships, geographic expansion, and a focus on innovation will be critical for companies seeking to capitalize on this expanding market. The potential for AUVs in new applications, such as environmental monitoring and deep-sea mining, presents exciting possibilities for long-term growth.
Autonomous Underwater Vehicles Market Segmentation
- 1. Production Analysis
- 2. Consumption Analysis
- 3. Import Market Analysis (Value & Volume)
- 4. Export Market Analysis (Value & Volume)
- 5. Price Trend Analysis
Autonomous Underwater Vehicles Market Segmentation By Geography
-
1. North America
- 1.1. United States
- 1.2. Canada
- 1.3. Mexico
-
2. South America
- 2.1. Brazil
- 2.2. Argentina
- 2.3. Rest of South America
-
3. Europe
- 3.1. United Kingdom
- 3.2. Germany
- 3.3. France
- 3.4. Italy
- 3.5. Spain
- 3.6. Russia
- 3.7. Benelux
- 3.8. Nordics
- 3.9. Rest of Europe
-
4. Middle East & Africa
- 4.1. Turkey
- 4.2. Israel
- 4.3. GCC
- 4.4. North Africa
- 4.5. South Africa
- 4.6. Rest of Middle East & Africa
-
5. Asia Pacific
- 5.1. China
- 5.2. India
- 5.3. Japan
- 5.4. South Korea
- 5.5. ASEAN
- 5.6. Oceania
- 5.7. Rest of Asia Pacific
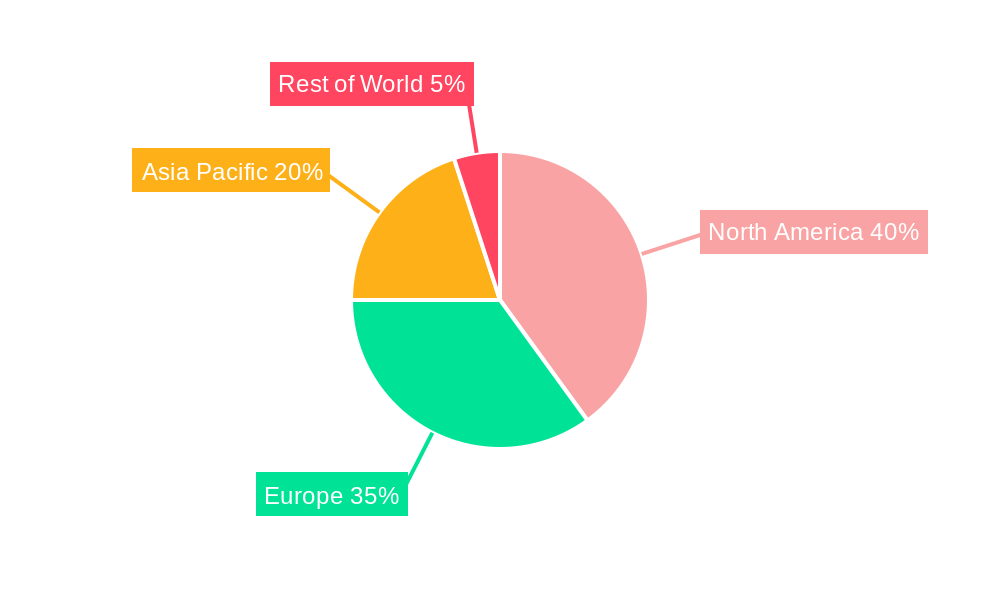
Autonomous Underwater Vehicles Market Regional Market Share
Geographic Coverage of Autonomous Underwater Vehicles Market
Autonomous Underwater Vehicles Market REPORT HIGHLIGHTS
| Aspects | Details |
|---|---|
| Study Period | 2020-2034 |
| Base Year | 2025 |
| Estimated Year | 2026 |
| Forecast Period | 2026-2034 |
| Historical Period | 2020-2025 |
| Growth Rate | CAGR of 21.7% from 2020-2034 |
| Segmentation |
|
Table of Contents
- 1. Introduction
- 1.1. Research Scope
- 1.2. Market Segmentation
- 1.3. Research Objective
- 1.4. Definitions and Assumptions
- 2. Executive Summary
- 2.1. Market Snapshot
- 3. Market Dynamics
- 3.1. Market Drivers
- 3.2. Market Restrains
- 3.3. Market Trends
- 3.4. Market Opportunities
- 4. Market Factor Analysis
- 4.1. Porters Five Forces
- 4.1.1. Bargaining Power of Suppliers
- 4.1.2. Bargaining Power of Buyers
- 4.1.3. Threat of New Entrants
- 4.1.4. Threat of Substitutes
- 4.1.5. Competitive Rivalry
- 4.2. PESTEL analysis
- 4.3. BCG Analysis
- 4.3.1. Stars (High Growth, High Market Share)
- 4.3.2. Cash Cows (Low Growth, High Market Share)
- 4.3.3. Question Mark (High Growth, Low Market Share)
- 4.3.4. Dogs (Low Growth, Low Market Share)
- 4.4. Ansoff Matrix Analysis
- 4.5. Supply Chain Analysis
- 4.6. Regulatory Landscape
- 4.7. Current Market Potential and Opportunity Assessment (TAM–SAM–SOM Framework)
- 4.8. IMR Analyst Note
- 4.1. Porters Five Forces
- 5. Market Analysis, Insights and Forecast 2021-2033
- 5.1. Market Analysis, Insights and Forecast - by Production Analysis
- 5.2. Market Analysis, Insights and Forecast - by Consumption Analysis
- 5.3. Market Analysis, Insights and Forecast - by Import Market Analysis (Value & Volume)
- 5.4. Market Analysis, Insights and Forecast - by Export Market Analysis (Value & Volume)
- 5.5. Market Analysis, Insights and Forecast - by Price Trend Analysis
- 5.6. Market Analysis, Insights and Forecast - by Region
- 5.6.1. North America
- 5.6.2. South America
- 5.6.3. Europe
- 5.6.4. Middle East & Africa
- 5.6.5. Asia Pacific
- 6. Global Autonomous Underwater Vehicles Market Analysis, Insights and Forecast, 2021-2033
- 6.1. Market Analysis, Insights and Forecast - by Production Analysis
- 6.2. Market Analysis, Insights and Forecast - by Consumption Analysis
- 6.3. Market Analysis, Insights and Forecast - by Import Market Analysis (Value & Volume)
- 6.4. Market Analysis, Insights and Forecast - by Export Market Analysis (Value & Volume)
- 6.5. Market Analysis, Insights and Forecast - by Price Trend Analysis
- 7. North America Autonomous Underwater Vehicles Market Analysis, Insights and Forecast, 2020-2032
- 7.1. Market Analysis, Insights and Forecast - by Production Analysis
- 7.2. Market Analysis, Insights and Forecast - by Consumption Analysis
- 7.3. Market Analysis, Insights and Forecast - by Import Market Analysis (Value & Volume)
- 7.4. Market Analysis, Insights and Forecast - by Export Market Analysis (Value & Volume)
- 7.5. Market Analysis, Insights and Forecast - by Price Trend Analysis
- 8. South America Autonomous Underwater Vehicles Market Analysis, Insights and Forecast, 2020-2032
- 8.1. Market Analysis, Insights and Forecast - by Production Analysis
- 8.2. Market Analysis, Insights and Forecast - by Consumption Analysis
- 8.3. Market Analysis, Insights and Forecast - by Import Market Analysis (Value & Volume)
- 8.4. Market Analysis, Insights and Forecast - by Export Market Analysis (Value & Volume)
- 8.5. Market Analysis, Insights and Forecast - by Price Trend Analysis
- 9. Europe Autonomous Underwater Vehicles Market Analysis, Insights and Forecast, 2020-2032
- 9.1. Market Analysis, Insights and Forecast - by Production Analysis
- 9.2. Market Analysis, Insights and Forecast - by Consumption Analysis
- 9.3. Market Analysis, Insights and Forecast - by Import Market Analysis (Value & Volume)
- 9.4. Market Analysis, Insights and Forecast - by Export Market Analysis (Value & Volume)
- 9.5. Market Analysis, Insights and Forecast - by Price Trend Analysis
- 10. Middle East & Africa Autonomous Underwater Vehicles Market Analysis, Insights and Forecast, 2020-2032
- 10.1. Market Analysis, Insights and Forecast - by Production Analysis
- 10.2. Market Analysis, Insights and Forecast - by Consumption Analysis
- 10.3. Market Analysis, Insights and Forecast - by Import Market Analysis (Value & Volume)
- 10.4. Market Analysis, Insights and Forecast - by Export Market Analysis (Value & Volume)
- 10.5. Market Analysis, Insights and Forecast - by Price Trend Analysis
- 11. Asia Pacific Autonomous Underwater Vehicles Market Analysis, Insights and Forecast, 2020-2032
- 11.1. Market Analysis, Insights and Forecast - by Production Analysis
- 11.2. Market Analysis, Insights and Forecast - by Consumption Analysis
- 11.3. Market Analysis, Insights and Forecast - by Import Market Analysis (Value & Volume)
- 11.4. Market Analysis, Insights and Forecast - by Export Market Analysis (Value & Volume)
- 11.5. Market Analysis, Insights and Forecast - by Price Trend Analysis
- 12. Competitive Analysis
- 12.1. Company Profiles
- 12.1.1 Teledyne Marine (Teledyne Technologies Inc )
- 12.1.1.1. Company Overview
- 12.1.1.2. Products
- 12.1.1.3. Company Financials
- 12.1.1.4. SWOT Analysis
- 12.1.2 General Dynamics Corporation
- 12.1.2.1. Company Overview
- 12.1.2.2. Products
- 12.1.2.3. Company Financials
- 12.1.2.4. SWOT Analysis
- 12.1.3 Anduril Industries Inc
- 12.1.3.1. Company Overview
- 12.1.3.2. Products
- 12.1.3.3. Company Financials
- 12.1.3.4. SWOT Analysis
- 12.1.4 Mazagaon Dockyard Limite
- 12.1.4.1. Company Overview
- 12.1.4.2. Products
- 12.1.4.3. Company Financials
- 12.1.4.4. SWOT Analysis
- 12.1.5 Kongsberg Gruppen ASA
- 12.1.5.1. Company Overview
- 12.1.5.2. Products
- 12.1.5.3. Company Financials
- 12.1.5.4. SWOT Analysis
- 12.1.6 Lockheed Martin Corporation
- 12.1.6.1. Company Overview
- 12.1.6.2. Products
- 12.1.6.3. Company Financials
- 12.1.6.4. SWOT Analysis
- 12.1.7 Exail Technologies
- 12.1.7.1. Company Overview
- 12.1.7.2. Products
- 12.1.7.3. Company Financials
- 12.1.7.4. SWOT Analysis
- 12.1.8 Huntington Ingalls Industries Inc
- 12.1.8.1. Company Overview
- 12.1.8.2. Products
- 12.1.8.3. Company Financials
- 12.1.8.4. SWOT Analysis
- 12.1.9 The Boeing Company
- 12.1.9.1. Company Overview
- 12.1.9.2. Products
- 12.1.9.3. Company Financials
- 12.1.9.4. SWOT Analysis
- 12.1.1 Teledyne Marine (Teledyne Technologies Inc )
- 12.2. Market Entropy
- 12.2.1 Company's Key Areas Served
- 12.2.2 Recent Developments
- 12.3. Company Market Share Analysis 2025
- 12.3.1 Top 5 Companies Market Share Analysis
- 12.3.2 Top 3 Companies Market Share Analysis
- 12.4. List of Potential Customers
- 13. Research Methodology
List of Figures
- Figure 1: Global Autonomous Underwater Vehicles Market Revenue Breakdown (million, %) by Region 2025 & 2033
- Figure 2: North America Autonomous Underwater Vehicles Market Revenue (million), by Production Analysis 2025 & 2033
- Figure 3: North America Autonomous Underwater Vehicles Market Revenue Share (%), by Production Analysis 2025 & 2033
- Figure 4: North America Autonomous Underwater Vehicles Market Revenue (million), by Consumption Analysis 2025 & 2033
- Figure 5: North America Autonomous Underwater Vehicles Market Revenue Share (%), by Consumption Analysis 2025 & 2033
- Figure 6: North America Autonomous Underwater Vehicles Market Revenue (million), by Import Market Analysis (Value & Volume) 2025 & 2033
- Figure 7: North America Autonomous Underwater Vehicles Market Revenue Share (%), by Import Market Analysis (Value & Volume) 2025 & 2033
- Figure 8: North America Autonomous Underwater Vehicles Market Revenue (million), by Export Market Analysis (Value & Volume) 2025 & 2033
- Figure 9: North America Autonomous Underwater Vehicles Market Revenue Share (%), by Export Market Analysis (Value & Volume) 2025 & 2033
- Figure 10: North America Autonomous Underwater Vehicles Market Revenue (million), by Price Trend Analysis 2025 & 2033
- Figure 11: North America Autonomous Underwater Vehicles Market Revenue Share (%), by Price Trend Analysis 2025 & 2033
- Figure 12: North America Autonomous Underwater Vehicles Market Revenue (million), by Country 2025 & 2033
- Figure 13: North America Autonomous Underwater Vehicles Market Revenue Share (%), by Country 2025 & 2033
- Figure 14: South America Autonomous Underwater Vehicles Market Revenue (million), by Production Analysis 2025 & 2033
- Figure 15: South America Autonomous Underwater Vehicles Market Revenue Share (%), by Production Analysis 2025 & 2033
- Figure 16: South America Autonomous Underwater Vehicles Market Revenue (million), by Consumption Analysis 2025 & 2033
- Figure 17: South America Autonomous Underwater Vehicles Market Revenue Share (%), by Consumption Analysis 2025 & 2033
- Figure 18: South America Autonomous Underwater Vehicles Market Revenue (million), by Import Market Analysis (Value & Volume) 2025 & 2033
- Figure 19: South America Autonomous Underwater Vehicles Market Revenue Share (%), by Import Market Analysis (Value & Volume) 2025 & 2033
- Figure 20: South America Autonomous Underwater Vehicles Market Revenue (million), by Export Market Analysis (Value & Volume) 2025 & 2033
- Figure 21: South America Autonomous Underwater Vehicles Market Revenue Share (%), by Export Market Analysis (Value & Volume) 2025 & 2033
- Figure 22: South America Autonomous Underwater Vehicles Market Revenue (million), by Price Trend Analysis 2025 & 2033
- Figure 23: South America Autonomous Underwater Vehicles Market Revenue Share (%), by Price Trend Analysis 2025 & 2033
- Figure 24: South America Autonomous Underwater Vehicles Market Revenue (million), by Country 2025 & 2033
- Figure 25: South America Autonomous Underwater Vehicles Market Revenue Share (%), by Country 2025 & 2033
- Figure 26: Europe Autonomous Underwater Vehicles Market Revenue (million), by Production Analysis 2025 & 2033
- Figure 27: Europe Autonomous Underwater Vehicles Market Revenue Share (%), by Production Analysis 2025 & 2033
- Figure 28: Europe Autonomous Underwater Vehicles Market Revenue (million), by Consumption Analysis 2025 & 2033
- Figure 29: Europe Autonomous Underwater Vehicles Market Revenue Share (%), by Consumption Analysis 2025 & 2033
- Figure 30: Europe Autonomous Underwater Vehicles Market Revenue (million), by Import Market Analysis (Value & Volume) 2025 & 2033
- Figure 31: Europe Autonomous Underwater Vehicles Market Revenue Share (%), by Import Market Analysis (Value & Volume) 2025 & 2033
- Figure 32: Europe Autonomous Underwater Vehicles Market Revenue (million), by Export Market Analysis (Value & Volume) 2025 & 2033
- Figure 33: Europe Autonomous Underwater Vehicles Market Revenue Share (%), by Export Market Analysis (Value & Volume) 2025 & 2033
- Figure 34: Europe Autonomous Underwater Vehicles Market Revenue (million), by Price Trend Analysis 2025 & 2033
- Figure 35: Europe Autonomous Underwater Vehicles Market Revenue Share (%), by Price Trend Analysis 2025 & 2033
- Figure 36: Europe Autonomous Underwater Vehicles Market Revenue (million), by Country 2025 & 2033
- Figure 37: Europe Autonomous Underwater Vehicles Market Revenue Share (%), by Country 2025 & 2033
- Figure 38: Middle East & Africa Autonomous Underwater Vehicles Market Revenue (million), by Production Analysis 2025 & 2033
- Figure 39: Middle East & Africa Autonomous Underwater Vehicles Market Revenue Share (%), by Production Analysis 2025 & 2033
- Figure 40: Middle East & Africa Autonomous Underwater Vehicles Market Revenue (million), by Consumption Analysis 2025 & 2033
- Figure 41: Middle East & Africa Autonomous Underwater Vehicles Market Revenue Share (%), by Consumption Analysis 2025 & 2033
- Figure 42: Middle East & Africa Autonomous Underwater Vehicles Market Revenue (million), by Import Market Analysis (Value & Volume) 2025 & 2033
- Figure 43: Middle East & Africa Autonomous Underwater Vehicles Market Revenue Share (%), by Import Market Analysis (Value & Volume) 2025 & 2033
- Figure 44: Middle East & Africa Autonomous Underwater Vehicles Market Revenue (million), by Export Market Analysis (Value & Volume) 2025 & 2033
- Figure 45: Middle East & Africa Autonomous Underwater Vehicles Market Revenue Share (%), by Export Market Analysis (Value & Volume) 2025 & 2033
- Figure 46: Middle East & Africa Autonomous Underwater Vehicles Market Revenue (million), by Price Trend Analysis 2025 & 2033
- Figure 47: Middle East & Africa Autonomous Underwater Vehicles Market Revenue Share (%), by Price Trend Analysis 2025 & 2033
- Figure 48: Middle East & Africa Autonomous Underwater Vehicles Market Revenue (million), by Country 2025 & 2033
- Figure 49: Middle East & Africa Autonomous Underwater Vehicles Market Revenue Share (%), by Country 2025 & 2033
- Figure 50: Asia Pacific Autonomous Underwater Vehicles Market Revenue (million), by Production Analysis 2025 & 2033
- Figure 51: Asia Pacific Autonomous Underwater Vehicles Market Revenue Share (%), by Production Analysis 2025 & 2033
- Figure 52: Asia Pacific Autonomous Underwater Vehicles Market Revenue (million), by Consumption Analysis 2025 & 2033
- Figure 53: Asia Pacific Autonomous Underwater Vehicles Market Revenue Share (%), by Consumption Analysis 2025 & 2033
- Figure 54: Asia Pacific Autonomous Underwater Vehicles Market Revenue (million), by Import Market Analysis (Value & Volume) 2025 & 2033
- Figure 55: Asia Pacific Autonomous Underwater Vehicles Market Revenue Share (%), by Import Market Analysis (Value & Volume) 2025 & 2033
- Figure 56: Asia Pacific Autonomous Underwater Vehicles Market Revenue (million), by Export Market Analysis (Value & Volume) 2025 & 2033
- Figure 57: Asia Pacific Autonomous Underwater Vehicles Market Revenue Share (%), by Export Market Analysis (Value & Volume) 2025 & 2033
- Figure 58: Asia Pacific Autonomous Underwater Vehicles Market Revenue (million), by Price Trend Analysis 2025 & 2033
- Figure 59: Asia Pacific Autonomous Underwater Vehicles Market Revenue Share (%), by Price Trend Analysis 2025 & 2033
- Figure 60: Asia Pacific Autonomous Underwater Vehicles Market Revenue (million), by Country 2025 & 2033
- Figure 61: Asia Pacific Autonomous Underwater Vehicles Market Revenue Share (%), by Country 2025 & 2033
List of Tables
- Table 1: Global Autonomous Underwater Vehicles Market Revenue million Forecast, by Production Analysis 2020 & 2033
- Table 2: Global Autonomous Underwater Vehicles Market Revenue million Forecast, by Consumption Analysis 2020 & 2033
- Table 3: Global Autonomous Underwater Vehicles Market Revenue million Forecast, by Import Market Analysis (Value & Volume) 2020 & 2033
- Table 4: Global Autonomous Underwater Vehicles Market Revenue million Forecast, by Export Market Analysis (Value & Volume) 2020 & 2033
- Table 5: Global Autonomous Underwater Vehicles Market Revenue million Forecast, by Price Trend Analysis 2020 & 2033
- Table 6: Global Autonomous Underwater Vehicles Market Revenue million Forecast, by Region 2020 & 2033
- Table 7: Global Autonomous Underwater Vehicles Market Revenue million Forecast, by Production Analysis 2020 & 2033
- Table 8: Global Autonomous Underwater Vehicles Market Revenue million Forecast, by Consumption Analysis 2020 & 2033
- Table 9: Global Autonomous Underwater Vehicles Market Revenue million Forecast, by Import Market Analysis (Value & Volume) 2020 & 2033
- Table 10: Global Autonomous Underwater Vehicles Market Revenue million Forecast, by Export Market Analysis (Value & Volume) 2020 & 2033
- Table 11: Global Autonomous Underwater Vehicles Market Revenue million Forecast, by Price Trend Analysis 2020 & 2033
- Table 12: Global Autonomous Underwater Vehicles Market Revenue million Forecast, by Country 2020 & 2033
- Table 13: United States Autonomous Underwater Vehicles Market Revenue (million) Forecast, by Application 2020 & 2033
- Table 14: Canada Autonomous Underwater Vehicles Market Revenue (million) Forecast, by Application 2020 & 2033
- Table 15: Mexico Autonomous Underwater Vehicles Market Revenue (million) Forecast, by Application 2020 & 2033
- Table 16: Global Autonomous Underwater Vehicles Market Revenue million Forecast, by Production Analysis 2020 & 2033
- Table 17: Global Autonomous Underwater Vehicles Market Revenue million Forecast, by Consumption Analysis 2020 & 2033
- Table 18: Global Autonomous Underwater Vehicles Market Revenue million Forecast, by Import Market Analysis (Value & Volume) 2020 & 2033
- Table 19: Global Autonomous Underwater Vehicles Market Revenue million Forecast, by Export Market Analysis (Value & Volume) 2020 & 2033
- Table 20: Global Autonomous Underwater Vehicles Market Revenue million Forecast, by Price Trend Analysis 2020 & 2033
- Table 21: Global Autonomous Underwater Vehicles Market Revenue million Forecast, by Country 2020 & 2033
- Table 22: Brazil Autonomous Underwater Vehicles Market Revenue (million) Forecast, by Application 2020 & 2033
- Table 23: Argentina Autonomous Underwater Vehicles Market Revenue (million) Forecast, by Application 2020 & 2033
- Table 24: Rest of South America Autonomous Underwater Vehicles Market Revenue (million) Forecast, by Application 2020 & 2033
- Table 25: Global Autonomous Underwater Vehicles Market Revenue million Forecast, by Production Analysis 2020 & 2033
- Table 26: Global Autonomous Underwater Vehicles Market Revenue million Forecast, by Consumption Analysis 2020 & 2033
- Table 27: Global Autonomous Underwater Vehicles Market Revenue million Forecast, by Import Market Analysis (Value & Volume) 2020 & 2033
- Table 28: Global Autonomous Underwater Vehicles Market Revenue million Forecast, by Export Market Analysis (Value & Volume) 2020 & 2033
- Table 29: Global Autonomous Underwater Vehicles Market Revenue million Forecast, by Price Trend Analysis 2020 & 2033
- Table 30: Global Autonomous Underwater Vehicles Market Revenue million Forecast, by Country 2020 & 2033
- Table 31: United Kingdom Autonomous Underwater Vehicles Market Revenue (million) Forecast, by Application 2020 & 2033
- Table 32: Germany Autonomous Underwater Vehicles Market Revenue (million) Forecast, by Application 2020 & 2033
- Table 33: France Autonomous Underwater Vehicles Market Revenue (million) Forecast, by Application 2020 & 2033
- Table 34: Italy Autonomous Underwater Vehicles Market Revenue (million) Forecast, by Application 2020 & 2033
- Table 35: Spain Autonomous Underwater Vehicles Market Revenue (million) Forecast, by Application 2020 & 2033
- Table 36: Russia Autonomous Underwater Vehicles Market Revenue (million) Forecast, by Application 2020 & 2033
- Table 37: Benelux Autonomous Underwater Vehicles Market Revenue (million) Forecast, by Application 2020 & 2033
- Table 38: Nordics Autonomous Underwater Vehicles Market Revenue (million) Forecast, by Application 2020 & 2033
- Table 39: Rest of Europe Autonomous Underwater Vehicles Market Revenue (million) Forecast, by Application 2020 & 2033
- Table 40: Global Autonomous Underwater Vehicles Market Revenue million Forecast, by Production Analysis 2020 & 2033
- Table 41: Global Autonomous Underwater Vehicles Market Revenue million Forecast, by Consumption Analysis 2020 & 2033
- Table 42: Global Autonomous Underwater Vehicles Market Revenue million Forecast, by Import Market Analysis (Value & Volume) 2020 & 2033
- Table 43: Global Autonomous Underwater Vehicles Market Revenue million Forecast, by Export Market Analysis (Value & Volume) 2020 & 2033
- Table 44: Global Autonomous Underwater Vehicles Market Revenue million Forecast, by Price Trend Analysis 2020 & 2033
- Table 45: Global Autonomous Underwater Vehicles Market Revenue million Forecast, by Country 2020 & 2033
- Table 46: Turkey Autonomous Underwater Vehicles Market Revenue (million) Forecast, by Application 2020 & 2033
- Table 47: Israel Autonomous Underwater Vehicles Market Revenue (million) Forecast, by Application 2020 & 2033
- Table 48: GCC Autonomous Underwater Vehicles Market Revenue (million) Forecast, by Application 2020 & 2033
- Table 49: North Africa Autonomous Underwater Vehicles Market Revenue (million) Forecast, by Application 2020 & 2033
- Table 50: South Africa Autonomous Underwater Vehicles Market Revenue (million) Forecast, by Application 2020 & 2033
- Table 51: Rest of Middle East & Africa Autonomous Underwater Vehicles Market Revenue (million) Forecast, by Application 2020 & 2033
- Table 52: Global Autonomous Underwater Vehicles Market Revenue million Forecast, by Production Analysis 2020 & 2033
- Table 53: Global Autonomous Underwater Vehicles Market Revenue million Forecast, by Consumption Analysis 2020 & 2033
- Table 54: Global Autonomous Underwater Vehicles Market Revenue million Forecast, by Import Market Analysis (Value & Volume) 2020 & 2033
- Table 55: Global Autonomous Underwater Vehicles Market Revenue million Forecast, by Export Market Analysis (Value & Volume) 2020 & 2033
- Table 56: Global Autonomous Underwater Vehicles Market Revenue million Forecast, by Price Trend Analysis 2020 & 2033
- Table 57: Global Autonomous Underwater Vehicles Market Revenue million Forecast, by Country 2020 & 2033
- Table 58: China Autonomous Underwater Vehicles Market Revenue (million) Forecast, by Application 2020 & 2033
- Table 59: India Autonomous Underwater Vehicles Market Revenue (million) Forecast, by Application 2020 & 2033
- Table 60: Japan Autonomous Underwater Vehicles Market Revenue (million) Forecast, by Application 2020 & 2033
- Table 61: South Korea Autonomous Underwater Vehicles Market Revenue (million) Forecast, by Application 2020 & 2033
- Table 62: ASEAN Autonomous Underwater Vehicles Market Revenue (million) Forecast, by Application 2020 & 2033
- Table 63: Oceania Autonomous Underwater Vehicles Market Revenue (million) Forecast, by Application 2020 & 2033
- Table 64: Rest of Asia Pacific Autonomous Underwater Vehicles Market Revenue (million) Forecast, by Application 2020 & 2033
Frequently Asked Questions
1. What is the projected Compound Annual Growth Rate (CAGR) of the Autonomous Underwater Vehicles Market?
The projected CAGR is approximately 21.7%.
2. Which companies are prominent players in the Autonomous Underwater Vehicles Market?
Key companies in the market include Teledyne Marine (Teledyne Technologies Inc ), General Dynamics Corporation, Anduril Industries Inc, Mazagaon Dockyard Limite, Kongsberg Gruppen ASA, Lockheed Martin Corporation, Exail Technologies, Huntington Ingalls Industries Inc, The Boeing Company.
3. What are the main segments of the Autonomous Underwater Vehicles Market?
The market segments include Production Analysis, Consumption Analysis, Import Market Analysis (Value & Volume), Export Market Analysis (Value & Volume), Price Trend Analysis.
4. Can you provide details about the market size?
The market size is estimated to be USD 3830.7 million as of 2022.
5. What are some drivers contributing to market growth?
Increase in Internet of Things (IoT) and Autonomous Systems; Rise in Demand for Military and Defense Satellite Communication Solutions.
6. What are the notable trends driving market growth?
Civil Segment is Expected to Experience Substantial Growth During the Forecast Period.
7. Are there any restraints impacting market growth?
Cybersecurity Threats to Satellite Communication; Interference in Transmission of Data.
8. Can you provide examples of recent developments in the market?
July 2023: An AUV named Neerakshi, built by India-based Defence PSU Garden Reach Shipbuilders and Engineers (GRSE) Ltd in collaboration with MSME entity Aerospace Engineering Private Ltd (AEPL), was launched. It is a lightweight and man-portable AUV with a length of 2.15 m and an endurance of nearly 4 hours. It is designed to operate completely autonomously, and its modular design enables it to carry out a variety of roles depending on the payload. The development of this AUV is regarded as a major step towards indigenous capability development in keeping with India's Atmanirbharta policy.
9. What pricing options are available for accessing the report?
Pricing options include single-user, multi-user, and enterprise licenses priced at USD 4750, USD 5250, and USD 8750 respectively.
10. Is the market size provided in terms of value or volume?
The market size is provided in terms of value, measured in million.
11. Are there any specific market keywords associated with the report?
Yes, the market keyword associated with the report is "Autonomous Underwater Vehicles Market," which aids in identifying and referencing the specific market segment covered.
12. How do I determine which pricing option suits my needs best?
The pricing options vary based on user requirements and access needs. Individual users may opt for single-user licenses, while businesses requiring broader access may choose multi-user or enterprise licenses for cost-effective access to the report.
13. Are there any additional resources or data provided in the Autonomous Underwater Vehicles Market report?
While the report offers comprehensive insights, it's advisable to review the specific contents or supplementary materials provided to ascertain if additional resources or data are available.
14. How can I stay updated on further developments or reports in the Autonomous Underwater Vehicles Market?
To stay informed about further developments, trends, and reports in the Autonomous Underwater Vehicles Market, consider subscribing to industry newsletters, following relevant companies and organizations, or regularly checking reputable industry news sources and publications.
Methodology
Step 1 - Identification of Relevant Samples Size from Population Database


Step 2 - Approaches for Defining Global Market Size (Value, Volume* & Price*)

Note*: In applicable scenarios
Step 3 - Data Sources
Primary Research
- Web Analytics
- Survey Reports
- Research Institute
- Latest Research Reports
- Opinion Leaders
Secondary Research
- Annual Reports
- White Paper
- Latest Press Release
- Industry Association
- Paid Database
- Investor Presentations

Step 4 - Data Triangulation
Involves using different sources of information in order to increase the validity of a study
These sources are likely to be stakeholders in a program - participants, other researchers, program staff, other community members, and so on.
Then we put all data in single framework & apply various statistical tools to find out the dynamic on the market.
During the analysis stage, feedback from the stakeholder groups would be compared to determine areas of agreement as well as areas of divergence