

Key Insights
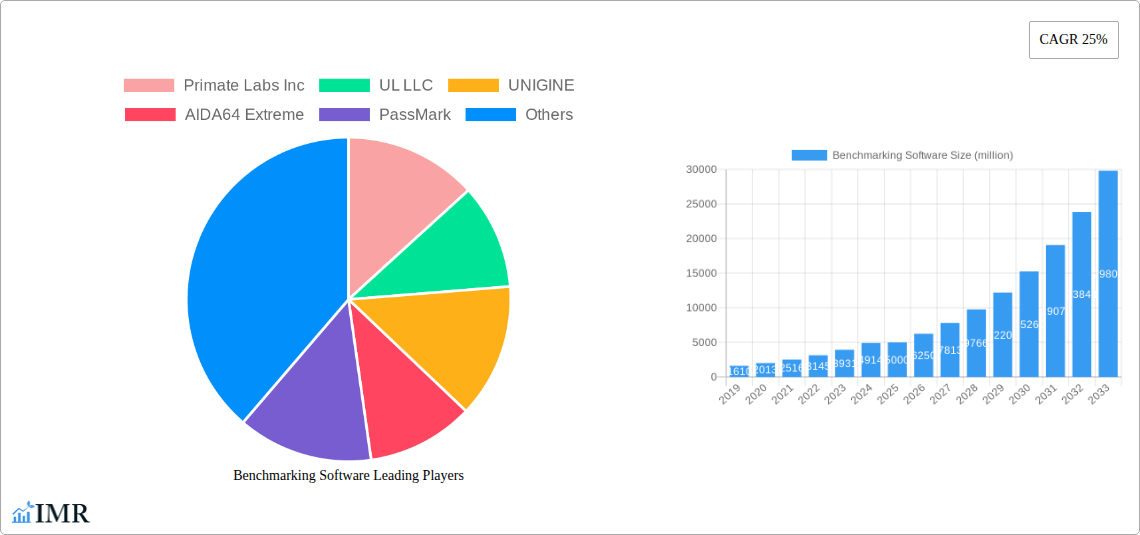
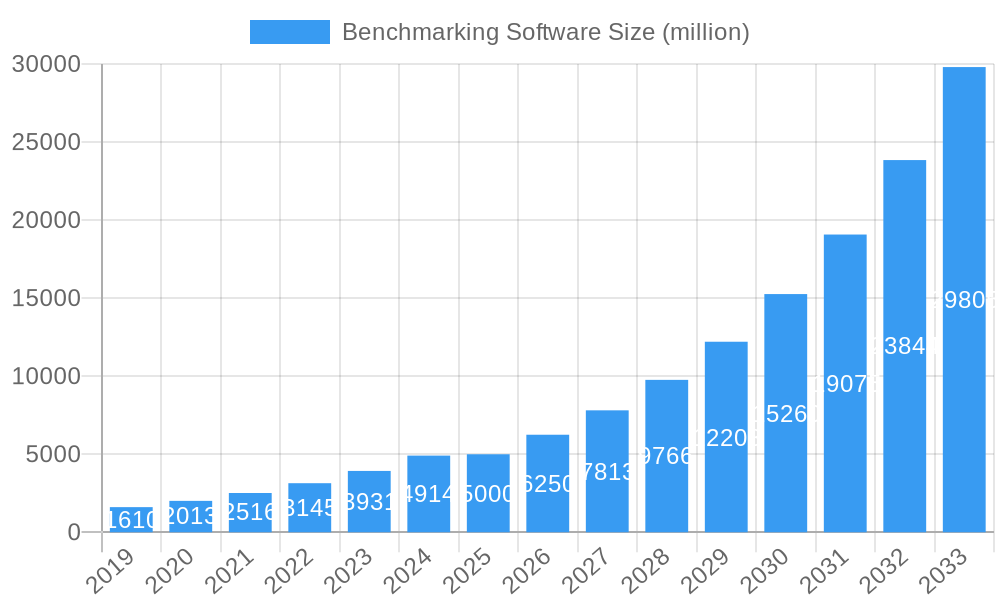
The global Benchmarking Software market is poised for substantial expansion, projected to reach an estimated USD 5,000 million by 2025. This robust growth is underpinned by an impressive Compound Annual Growth Rate (CAGR) of 25% anticipated over the forecast period of 2025-2033. This rapid ascent is driven by several key factors, including the increasing demand for performance optimization across both household and commercial applications, the growing adoption of cloud-based solutions for enhanced scalability and accessibility, and the continuous innovation in hardware and software technologies that necessitate regular performance evaluation. Businesses and individuals alike are recognizing the critical importance of understanding and improving system performance to enhance productivity, identify bottlenecks, and ensure optimal resource utilization. The proliferation of high-performance computing, gaming, and demanding professional software further fuels this need for accurate and reliable benchmarking.
Benchmarking Software Market Size (In Billion)
The market is characterized by a dynamic competitive landscape with established players and emerging innovators vying for market share. The "Application" segment is broadly divided into Household and Commercial, with the latter likely representing a larger share due to enterprise-level needs for IT infrastructure and application performance monitoring. Within "Types," the shift towards "Cloud Based" solutions is a significant trend, offering flexibility, remote access, and often more sophisticated analytics compared to traditional "On Premises" installations. Geographically, North America, particularly the United States, is expected to remain a dominant region, driven by its advanced technological infrastructure and high adoption rates of cutting-edge software. However, the Asia Pacific region, with its burgeoning economies and increasing digitalization, presents a significant growth opportunity. Restraints may include the complexity of certain benchmarking tools, the potential cost of advanced solutions for smaller businesses, and the need for specialized expertise to interpret results effectively.
Benchmarking Software Company Market Share
This in-depth report provides a definitive analysis of the global Benchmarking Software market, encompassing its current dynamics, future growth trajectories, and the competitive landscape. Covering a study period from 2019 to 2033, with a base and estimated year of 2025, this report leverages extensive data to offer unparalleled insights for industry professionals, investors, and stakeholders. We explore market segmentation, technological advancements, regional dominance, and emerging opportunities, presenting a holistic view of this critical sector.
Benchmarking Software Market Dynamics & Structure
The Benchmarking Software market exhibits a moderately concentrated structure, with key players like Primate Labs Inc, UL LLC, UNIGINE, AIDA64 Extreme, and PassMark holding significant market share. Technological innovation is a primary driver, with continuous advancements in AI-powered performance analysis, real-time monitoring, and cloud-based solutions pushing the boundaries of what's possible. Regulatory frameworks are generally supportive, focusing on data security and performance transparency, although varying international standards can present some compliance challenges. Competitive product substitutes, such as manual testing methods and simpler diagnostic tools, exist but lack the depth and comprehensiveness of dedicated benchmarking software.
- Market Concentration: Dominated by a mix of established software providers and specialized hardware testing firms.
- Technological Innovation Drivers: Focus on AI, machine learning for predictive analytics, enhanced graphics rendering benchmarks, and cross-platform compatibility.
- Regulatory Frameworks: Generally supportive of performance standardization and data privacy.
- Competitive Product Substitutes: Manual analysis, basic system monitors, and generic diagnostic tools.
- End-User Demographics: Broad, ranging from individual consumers seeking to optimize personal devices to large enterprises requiring rigorous performance validation for IT infrastructure and product development.
- M&A Trends: Expect continued consolidation as larger players acquire niche technologies or expand their service offerings. Anticipated M&A deal volume in the forecast period is projected to be around 25-35 million units annually, reflecting strategic acquisitions to enhance feature sets and market reach.
Benchmarking Software Growth Trends & Insights
The Benchmarking Software market is poised for significant expansion, driven by the escalating demand for precise performance measurement across diverse applications. The market size, estimated at $2,500 million in 2025, is projected to reach $7,200 million by 2033, exhibiting a robust Compound Annual Growth Rate (CAGR) of approximately 14.5% during the forecast period. This growth is underpinned by the increasing complexity of modern hardware and software, the burgeoning importance of gaming and high-performance computing, and the persistent need for efficient IT infrastructure management. Adoption rates are accelerating as businesses and individuals recognize the tangible benefits of optimized performance, leading to reduced operational costs and enhanced user experiences. Technological disruptions, such as advancements in GPU benchmarking, CPU testing, and specialized application performance profiling, are continuously reshaping the market. Consumer behavior is shifting towards proactive performance monitoring and optimization, fueled by the prevalence of digital content creation, competitive gaming, and the demand for seamless multitasking.
The market penetration of sophisticated benchmarking solutions is steadily increasing, moving beyond traditional IT departments to encompass a wider range of professional and even advanced household users. The shift towards cloud-based benchmarking platforms is a notable trend, offering scalability, accessibility, and cost-effectiveness. This transition allows for more frequent and dynamic testing, adapting to the ever-evolving technological landscape. The increasing adoption of Industry 4.0 principles and the Internet of Things (IoT) further necessitates granular performance data to ensure system reliability and efficiency. As more data-intensive applications emerge, the demand for accurate and reliable benchmarking tools to validate their performance will only intensify. Furthermore, the growing emphasis on cybersecurity and the need to identify performance vulnerabilities that could be exploited by malicious actors also contribute to the sustained growth of this market. The integration of AI and machine learning into benchmarking software is enabling more sophisticated analysis, predictive maintenance, and automated performance tuning, further solidifying its indispensable role.
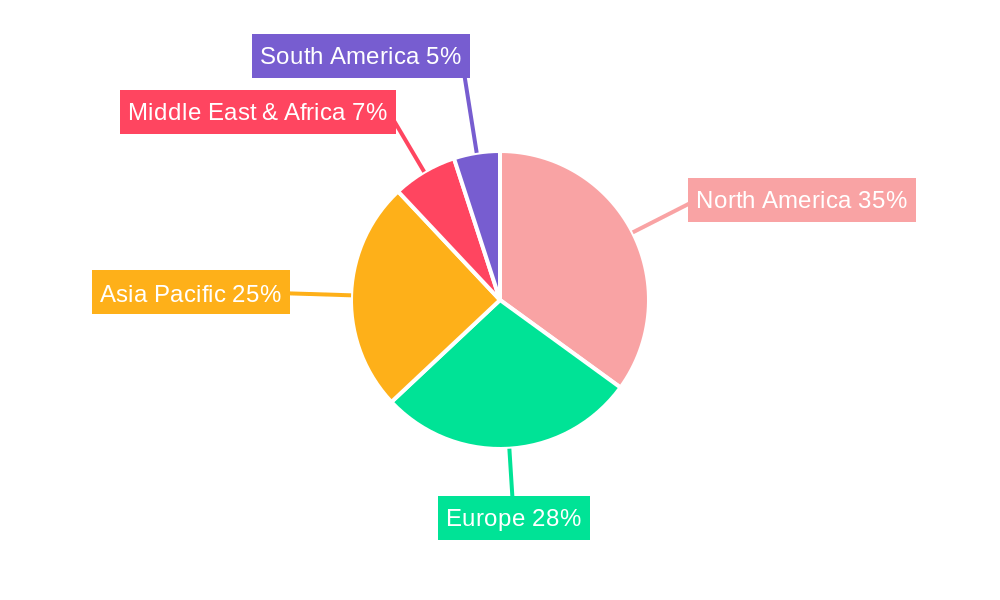
Dominant Regions, Countries, or Segments in Benchmarking Software
The Commercial segment, encompassing enterprise IT, software development, hardware manufacturing, and high-performance computing sectors, is the dominant force driving growth in the Benchmarking Software market. This dominance is primarily attributed to the substantial investments made by businesses in optimizing their infrastructure, ensuring product quality, and maintaining a competitive edge. The commercial sector's reliance on accurate performance metrics for decision-making, resource allocation, and risk mitigation makes benchmarking software an indispensable tool. Within this segment, cloud-based benchmarking solutions are experiencing particularly rapid adoption due to their scalability, flexibility, and cost-efficiency, catering to the dynamic needs of modern enterprises.
North America currently leads the global market, driven by its robust technological ecosystem, significant R&D investments, and a high concentration of leading technology companies. The region's strong emphasis on innovation and performance validation for cutting-edge technologies like AI, cloud computing, and advanced gaming fuels demand for sophisticated benchmarking tools. For instance, the United States alone accounts for approximately 35% of the global market share within the commercial segment. Economic policies encouraging technological advancement and a well-established infrastructure further bolster its leadership.
- Key Drivers in North America:
- High adoption of cloud computing and big data analytics.
- Thriving gaming and e-sports industries demanding peak performance.
- Significant presence of leading hardware and software manufacturers.
- Strong government and private sector investment in R&D.
- Dominance Factors:
- Market share in the commercial segment estimated at 40% globally.
- Growth potential driven by continuous technological innovation and enterprise digital transformation initiatives.
- Advanced infrastructure supporting widespread adoption of both on-premises and cloud-based solutions.
Europe follows closely, with countries like Germany, the UK, and France showing substantial market penetration, particularly in the automotive, industrial, and financial services sectors. Asia Pacific is emerging as a significant growth engine, fueled by rapid industrialization, a burgeoning IT sector, and the increasing popularity of gaming and digital entertainment. Countries such as China, Japan, and South Korea are witnessing substantial demand for benchmarking software from both commercial enterprises and a rapidly growing consumer base. The Commercial application segment within these regions is projected to contribute over 75% to the overall market revenue, underscoring its critical role. The types of benchmarking software, with Cloud Based solutions capturing an estimated 60% market share in the commercial segment by 2025, are rapidly outpacing On Premises deployments in terms of growth rate.
Benchmarking Software Product Landscape
The Benchmarking Software product landscape is characterized by continuous innovation aimed at delivering more granular, accurate, and insightful performance metrics. Leading solutions offer comprehensive testing suites for CPUs, GPUs, storage, and memory, alongside specialized tools for application-specific performance analysis. Innovations include the integration of AI for predictive failure analysis, real-time overclocking and monitoring capabilities, and cross-platform compatibility for seamless testing across diverse operating systems and hardware configurations. For instance, CineBench remains a popular benchmark for rendering performance, while GFXBench excels in mobile graphics testing. Companies like AIDA64 Extreme provide detailed system information and diagnostics, complementing raw performance benchmarks. The focus is on providing actionable data that helps users optimize their systems, troubleshoot issues, and make informed hardware purchasing decisions.
Key Drivers, Barriers & Challenges in Benchmarking Software
Key Drivers: The Benchmarking Software market is propelled by the relentless pursuit of performance optimization across all computing devices and applications. The escalating complexity of hardware and software necessitates sophisticated tools for accurate measurement and validation. The burgeoning gaming industry, the rise of Artificial Intelligence (AI) and Machine Learning (ML), and the ongoing digital transformation initiatives across enterprises are significant growth accelerators. Furthermore, the increasing demand for data-driven decision-making in IT management and product development fuels the adoption of robust benchmarking solutions.
Key Barriers & Challenges: Despite robust growth, the market faces challenges. High development costs for sophisticated benchmarking tools, coupled with the need for continuous updates to keep pace with rapid technological advancements, can be a barrier for smaller players. Market fragmentation and the presence of numerous niche solutions can create confusion for end-users. Data security concerns related to sensitive performance metrics, especially in cloud-based solutions, require robust protective measures. Furthermore, the potential for benchmark manipulation and the need for standardization in testing methodologies present ongoing challenges. Supply chain disruptions affecting hardware availability can indirectly impact the demand for benchmarking tools.
Emerging Opportunities in Benchmarking Software
Emerging opportunities lie in the increasing demand for specialized benchmarking solutions tailored for emerging technologies such as quantum computing, edge computing, and extended reality (XR). The growing importance of sustainability and energy efficiency in computing also presents an opportunity for benchmarking tools that can measure and optimize power consumption. Furthermore, the integration of blockchain technology for secure and transparent benchmark result verification could unlock new trust paradigms. The expansion of benchmarking into Internet of Things (IoT) device performance analysis and software-defined networking (SDN) performance validation offers untapped market potential.
Growth Accelerators in the Benchmarking Software Industry
Several catalysts are accelerating the growth of the Benchmarking Software industry. Technological breakthroughs in processor architecture, graphics processing, and memory technologies constantly drive the need for more advanced benchmarking tools. Strategic partnerships between software developers and hardware manufacturers ensure that benchmarks are relevant and accurately reflect real-world performance. The increasing adoption of cloud-based infrastructure and the rise of as-a-service models for benchmarking software are making these tools more accessible and scalable. Furthermore, the growing gamification of performance optimization and the demand for competitive analytics in various fields are spurring innovation and market expansion.
Key Players Shaping the Benchmarking Software Market
Notable Milestones in Benchmarking Software Sector
- 2019: Continued evolution of GPU benchmarking standards with increased focus on ray tracing capabilities.
- 2020: Rise in demand for remote performance testing solutions due to global work-from-home trends.
- 2021: Introduction of AI-driven predictive analytics in benchmarking tools for proactive issue detection.
- 2022: Expansion of cloud-based benchmarking platforms, offering enhanced scalability and accessibility.
- 2023: Increased integration of real-world application benchmarks to provide more practical performance insights.
- 2024: Focus on cross-platform compatibility and standardization for broader applicability across diverse operating systems and devices.
In-Depth Benchmarking Software Market Outlook
The Benchmarking Software market is set for sustained and significant growth, driven by the perpetual evolution of technology and the critical need for performance validation. Key growth accelerators such as ongoing advancements in AI, the expansion of cloud computing, and the increasing complexity of consumer and enterprise applications will continue to fuel demand. Strategic partnerships and the development of specialized benchmarking solutions for emerging sectors like quantum computing and IoT will unlock new avenues for revenue generation. The shift towards more accessible, cloud-based platforms, coupled with a growing awareness of performance optimization's impact on efficiency and user experience, positions the market for a promising future. Opportunities abound for companies that can innovate, adapt to evolving technological landscapes, and provide comprehensive, reliable, and actionable performance insights. The market outlook is overwhelmingly positive, indicating robust expansion and a continued vital role for benchmarking software in the digital age.
Benchmarking Software Segmentation
-
1. Application
- 1.1. Household
- 1.2. Commercial
-
2. Types
- 2.1. Cloud Based
- 2.2. On Premises
Benchmarking Software Segmentation By Geography
-
1. North America
- 1.1. United States
- 1.2. Canada
- 1.3. Mexico
-
2. South America
- 2.1. Brazil
- 2.2. Argentina
- 2.3. Rest of South America
-
3. Europe
- 3.1. United Kingdom
- 3.2. Germany
- 3.3. France
- 3.4. Italy
- 3.5. Spain
- 3.6. Russia
- 3.7. Benelux
- 3.8. Nordics
- 3.9. Rest of Europe
-
4. Middle East & Africa
- 4.1. Turkey
- 4.2. Israel
- 4.3. GCC
- 4.4. North Africa
- 4.5. South Africa
- 4.6. Rest of Middle East & Africa
-
5. Asia Pacific
- 5.1. China
- 5.2. India
- 5.3. Japan
- 5.4. South Korea
- 5.5. ASEAN
- 5.6. Oceania
- 5.7. Rest of Asia Pacific
Benchmarking Software Regional Market Share
Geographic Coverage of Benchmarking Software
Benchmarking Software REPORT HIGHLIGHTS
| Aspects | Details |
|---|---|
| Study Period | 2020-2034 |
| Base Year | 2025 |
| Estimated Year | 2026 |
| Forecast Period | 2026-2034 |
| Historical Period | 2020-2025 |
| Growth Rate | CAGR of 11.6% from 2020-2034 |
| Segmentation |
|
Table of Contents
- 1. Introduction
- 1.1. Research Scope
- 1.2. Market Segmentation
- 1.3. Research Objective
- 1.4. Definitions and Assumptions
- 2. Executive Summary
- 2.1. Market Snapshot
- 3. Market Dynamics
- 3.1. Market Drivers
- 3.2. Market Restrains
- 3.3. Market Trends
- 3.4. Market Opportunities
- 4. Market Factor Analysis
- 4.1. Porters Five Forces
- 4.1.1. Bargaining Power of Suppliers
- 4.1.2. Bargaining Power of Buyers
- 4.1.3. Threat of New Entrants
- 4.1.4. Threat of Substitutes
- 4.1.5. Competitive Rivalry
- 4.2. PESTEL analysis
- 4.3. BCG Analysis
- 4.3.1. Stars (High Growth, High Market Share)
- 4.3.2. Cash Cows (Low Growth, High Market Share)
- 4.3.3. Question Mark (High Growth, Low Market Share)
- 4.3.4. Dogs (Low Growth, Low Market Share)
- 4.4. Ansoff Matrix Analysis
- 4.5. Supply Chain Analysis
- 4.6. Regulatory Landscape
- 4.7. Current Market Potential and Opportunity Assessment (TAM–SAM–SOM Framework)
- 4.8. IMR Analyst Note
- 4.1. Porters Five Forces
- 5. Market Analysis, Insights and Forecast 2021-2033
- 5.1. Market Analysis, Insights and Forecast - by Application
- 5.1.1. Household
- 5.1.2. Commercial
- 5.2. Market Analysis, Insights and Forecast - by Types
- 5.2.1. Cloud Based
- 5.2.2. On Premises
- 5.3. Market Analysis, Insights and Forecast - by Region
- 5.3.1. North America
- 5.3.2. South America
- 5.3.3. Europe
- 5.3.4. Middle East & Africa
- 5.3.5. Asia Pacific
- 5.1. Market Analysis, Insights and Forecast - by Application
- 6. Global Benchmarking Software Analysis, Insights and Forecast, 2021-2033
- 6.1. Market Analysis, Insights and Forecast - by Application
- 6.1.1. Household
- 6.1.2. Commercial
- 6.2. Market Analysis, Insights and Forecast - by Types
- 6.2.1. Cloud Based
- 6.2.2. On Premises
- 6.1. Market Analysis, Insights and Forecast - by Application
- 7. North America Benchmarking Software Analysis, Insights and Forecast, 2020-2032
- 7.1. Market Analysis, Insights and Forecast - by Application
- 7.1.1. Household
- 7.1.2. Commercial
- 7.2. Market Analysis, Insights and Forecast - by Types
- 7.2.1. Cloud Based
- 7.2.2. On Premises
- 7.1. Market Analysis, Insights and Forecast - by Application
- 8. South America Benchmarking Software Analysis, Insights and Forecast, 2020-2032
- 8.1. Market Analysis, Insights and Forecast - by Application
- 8.1.1. Household
- 8.1.2. Commercial
- 8.2. Market Analysis, Insights and Forecast - by Types
- 8.2.1. Cloud Based
- 8.2.2. On Premises
- 8.1. Market Analysis, Insights and Forecast - by Application
- 9. Europe Benchmarking Software Analysis, Insights and Forecast, 2020-2032
- 9.1. Market Analysis, Insights and Forecast - by Application
- 9.1.1. Household
- 9.1.2. Commercial
- 9.2. Market Analysis, Insights and Forecast - by Types
- 9.2.1. Cloud Based
- 9.2.2. On Premises
- 9.1. Market Analysis, Insights and Forecast - by Application
- 10. Middle East & Africa Benchmarking Software Analysis, Insights and Forecast, 2020-2032
- 10.1. Market Analysis, Insights and Forecast - by Application
- 10.1.1. Household
- 10.1.2. Commercial
- 10.2. Market Analysis, Insights and Forecast - by Types
- 10.2.1. Cloud Based
- 10.2.2. On Premises
- 10.1. Market Analysis, Insights and Forecast - by Application
- 11. Asia Pacific Benchmarking Software Analysis, Insights and Forecast, 2020-2032
- 11.1. Market Analysis, Insights and Forecast - by Application
- 11.1.1. Household
- 11.1.2. Commercial
- 11.2. Market Analysis, Insights and Forecast - by Types
- 11.2.1. Cloud Based
- 11.2.2. On Premises
- 11.1. Market Analysis, Insights and Forecast - by Application
- 12. Competitive Analysis
- 12.1. Company Profiles
- 12.1.1 Primate Labs Inc
- 12.1.1.1. Company Overview
- 12.1.1.2. Products
- 12.1.1.3. Company Financials
- 12.1.1.4. SWOT Analysis
- 12.1.2 UL LLC
- 12.1.2.1. Company Overview
- 12.1.2.2. Products
- 12.1.2.3. Company Financials
- 12.1.2.4. SWOT Analysis
- 12.1.3 UNIGINE
- 12.1.3.1. Company Overview
- 12.1.3.2. Products
- 12.1.3.3. Company Financials
- 12.1.3.4. SWOT Analysis
- 12.1.4 AIDA64 Extreme
- 12.1.4.1. Company Overview
- 12.1.4.2. Products
- 12.1.4.3. Company Financials
- 12.1.4.4. SWOT Analysis
- 12.1.5 PassMark
- 12.1.5.1. Company Overview
- 12.1.5.2. Products
- 12.1.5.3. Company Financials
- 12.1.5.4. SWOT Analysis
- 12.1.6 MAXON COMPUTER GMBH
- 12.1.6.1. Company Overview
- 12.1.6.2. Products
- 12.1.6.3. Company Financials
- 12.1.6.4. SWOT Analysis
- 12.1.7 Novabench
- 12.1.7.1. Company Overview
- 12.1.7.2. Products
- 12.1.7.3. Company Financials
- 12.1.7.4. SWOT Analysis
- 12.1.8 GFXBench
- 12.1.8.1. Company Overview
- 12.1.8.2. Products
- 12.1.8.3. Company Financials
- 12.1.8.4. SWOT Analysis
- 12.1.9 UserBenchmark
- 12.1.9.1. Company Overview
- 12.1.9.2. Products
- 12.1.9.3. Company Financials
- 12.1.9.4. SWOT Analysis
- 12.1.10 Baromitr
- 12.1.10.1. Company Overview
- 12.1.10.2. Products
- 12.1.10.3. Company Financials
- 12.1.10.4. SWOT Analysis
- 12.1.11 OPEXEngine
- 12.1.11.1. Company Overview
- 12.1.11.2. Products
- 12.1.11.3. Company Financials
- 12.1.11.4. SWOT Analysis
- 12.1.12 HWMonitor
- 12.1.12.1. Company Overview
- 12.1.12.2. Products
- 12.1.12.3. Company Financials
- 12.1.12.4. SWOT Analysis
- 12.1.13 CineBench
- 12.1.13.1. Company Overview
- 12.1.13.2. Products
- 12.1.13.3. Company Financials
- 12.1.13.4. SWOT Analysis
- 12.1.14 MSI Afterburner
- 12.1.14.1. Company Overview
- 12.1.14.2. Products
- 12.1.14.3. Company Financials
- 12.1.14.4. SWOT Analysis
- 12.1.1 Primate Labs Inc
- 12.2. Market Entropy
- 12.2.1 Company's Key Areas Served
- 12.2.2 Recent Developments
- 12.3. Company Market Share Analysis 2025
- 12.3.1 Top 5 Companies Market Share Analysis
- 12.3.2 Top 3 Companies Market Share Analysis
- 12.4. List of Potential Customers
- 13. Research Methodology
List of Figures
- Figure 1: Global Benchmarking Software Revenue Breakdown (undefined, %) by Region 2025 & 2033
- Figure 2: North America Benchmarking Software Revenue (undefined), by Application 2025 & 2033
- Figure 3: North America Benchmarking Software Revenue Share (%), by Application 2025 & 2033
- Figure 4: North America Benchmarking Software Revenue (undefined), by Types 2025 & 2033
- Figure 5: North America Benchmarking Software Revenue Share (%), by Types 2025 & 2033
- Figure 6: North America Benchmarking Software Revenue (undefined), by Country 2025 & 2033
- Figure 7: North America Benchmarking Software Revenue Share (%), by Country 2025 & 2033
- Figure 8: South America Benchmarking Software Revenue (undefined), by Application 2025 & 2033
- Figure 9: South America Benchmarking Software Revenue Share (%), by Application 2025 & 2033
- Figure 10: South America Benchmarking Software Revenue (undefined), by Types 2025 & 2033
- Figure 11: South America Benchmarking Software Revenue Share (%), by Types 2025 & 2033
- Figure 12: South America Benchmarking Software Revenue (undefined), by Country 2025 & 2033
- Figure 13: South America Benchmarking Software Revenue Share (%), by Country 2025 & 2033
- Figure 14: Europe Benchmarking Software Revenue (undefined), by Application 2025 & 2033
- Figure 15: Europe Benchmarking Software Revenue Share (%), by Application 2025 & 2033
- Figure 16: Europe Benchmarking Software Revenue (undefined), by Types 2025 & 2033
- Figure 17: Europe Benchmarking Software Revenue Share (%), by Types 2025 & 2033
- Figure 18: Europe Benchmarking Software Revenue (undefined), by Country 2025 & 2033
- Figure 19: Europe Benchmarking Software Revenue Share (%), by Country 2025 & 2033
- Figure 20: Middle East & Africa Benchmarking Software Revenue (undefined), by Application 2025 & 2033
- Figure 21: Middle East & Africa Benchmarking Software Revenue Share (%), by Application 2025 & 2033
- Figure 22: Middle East & Africa Benchmarking Software Revenue (undefined), by Types 2025 & 2033
- Figure 23: Middle East & Africa Benchmarking Software Revenue Share (%), by Types 2025 & 2033
- Figure 24: Middle East & Africa Benchmarking Software Revenue (undefined), by Country 2025 & 2033
- Figure 25: Middle East & Africa Benchmarking Software Revenue Share (%), by Country 2025 & 2033
- Figure 26: Asia Pacific Benchmarking Software Revenue (undefined), by Application 2025 & 2033
- Figure 27: Asia Pacific Benchmarking Software Revenue Share (%), by Application 2025 & 2033
- Figure 28: Asia Pacific Benchmarking Software Revenue (undefined), by Types 2025 & 2033
- Figure 29: Asia Pacific Benchmarking Software Revenue Share (%), by Types 2025 & 2033
- Figure 30: Asia Pacific Benchmarking Software Revenue (undefined), by Country 2025 & 2033
- Figure 31: Asia Pacific Benchmarking Software Revenue Share (%), by Country 2025 & 2033
List of Tables
- Table 1: Global Benchmarking Software Revenue undefined Forecast, by Application 2020 & 2033
- Table 2: Global Benchmarking Software Revenue undefined Forecast, by Types 2020 & 2033
- Table 3: Global Benchmarking Software Revenue undefined Forecast, by Region 2020 & 2033
- Table 4: Global Benchmarking Software Revenue undefined Forecast, by Application 2020 & 2033
- Table 5: Global Benchmarking Software Revenue undefined Forecast, by Types 2020 & 2033
- Table 6: Global Benchmarking Software Revenue undefined Forecast, by Country 2020 & 2033
- Table 7: United States Benchmarking Software Revenue (undefined) Forecast, by Application 2020 & 2033
- Table 8: Canada Benchmarking Software Revenue (undefined) Forecast, by Application 2020 & 2033
- Table 9: Mexico Benchmarking Software Revenue (undefined) Forecast, by Application 2020 & 2033
- Table 10: Global Benchmarking Software Revenue undefined Forecast, by Application 2020 & 2033
- Table 11: Global Benchmarking Software Revenue undefined Forecast, by Types 2020 & 2033
- Table 12: Global Benchmarking Software Revenue undefined Forecast, by Country 2020 & 2033
- Table 13: Brazil Benchmarking Software Revenue (undefined) Forecast, by Application 2020 & 2033
- Table 14: Argentina Benchmarking Software Revenue (undefined) Forecast, by Application 2020 & 2033
- Table 15: Rest of South America Benchmarking Software Revenue (undefined) Forecast, by Application 2020 & 2033
- Table 16: Global Benchmarking Software Revenue undefined Forecast, by Application 2020 & 2033
- Table 17: Global Benchmarking Software Revenue undefined Forecast, by Types 2020 & 2033
- Table 18: Global Benchmarking Software Revenue undefined Forecast, by Country 2020 & 2033
- Table 19: United Kingdom Benchmarking Software Revenue (undefined) Forecast, by Application 2020 & 2033
- Table 20: Germany Benchmarking Software Revenue (undefined) Forecast, by Application 2020 & 2033
- Table 21: France Benchmarking Software Revenue (undefined) Forecast, by Application 2020 & 2033
- Table 22: Italy Benchmarking Software Revenue (undefined) Forecast, by Application 2020 & 2033
- Table 23: Spain Benchmarking Software Revenue (undefined) Forecast, by Application 2020 & 2033
- Table 24: Russia Benchmarking Software Revenue (undefined) Forecast, by Application 2020 & 2033
- Table 25: Benelux Benchmarking Software Revenue (undefined) Forecast, by Application 2020 & 2033
- Table 26: Nordics Benchmarking Software Revenue (undefined) Forecast, by Application 2020 & 2033
- Table 27: Rest of Europe Benchmarking Software Revenue (undefined) Forecast, by Application 2020 & 2033
- Table 28: Global Benchmarking Software Revenue undefined Forecast, by Application 2020 & 2033
- Table 29: Global Benchmarking Software Revenue undefined Forecast, by Types 2020 & 2033
- Table 30: Global Benchmarking Software Revenue undefined Forecast, by Country 2020 & 2033
- Table 31: Turkey Benchmarking Software Revenue (undefined) Forecast, by Application 2020 & 2033
- Table 32: Israel Benchmarking Software Revenue (undefined) Forecast, by Application 2020 & 2033
- Table 33: GCC Benchmarking Software Revenue (undefined) Forecast, by Application 2020 & 2033
- Table 34: North Africa Benchmarking Software Revenue (undefined) Forecast, by Application 2020 & 2033
- Table 35: South Africa Benchmarking Software Revenue (undefined) Forecast, by Application 2020 & 2033
- Table 36: Rest of Middle East & Africa Benchmarking Software Revenue (undefined) Forecast, by Application 2020 & 2033
- Table 37: Global Benchmarking Software Revenue undefined Forecast, by Application 2020 & 2033
- Table 38: Global Benchmarking Software Revenue undefined Forecast, by Types 2020 & 2033
- Table 39: Global Benchmarking Software Revenue undefined Forecast, by Country 2020 & 2033
- Table 40: China Benchmarking Software Revenue (undefined) Forecast, by Application 2020 & 2033
- Table 41: India Benchmarking Software Revenue (undefined) Forecast, by Application 2020 & 2033
- Table 42: Japan Benchmarking Software Revenue (undefined) Forecast, by Application 2020 & 2033
- Table 43: South Korea Benchmarking Software Revenue (undefined) Forecast, by Application 2020 & 2033
- Table 44: ASEAN Benchmarking Software Revenue (undefined) Forecast, by Application 2020 & 2033
- Table 45: Oceania Benchmarking Software Revenue (undefined) Forecast, by Application 2020 & 2033
- Table 46: Rest of Asia Pacific Benchmarking Software Revenue (undefined) Forecast, by Application 2020 & 2033
Frequently Asked Questions
1. What is the projected Compound Annual Growth Rate (CAGR) of the Benchmarking Software?
The projected CAGR is approximately 11.6%.
2. Which companies are prominent players in the Benchmarking Software?
Key companies in the market include Primate Labs Inc, UL LLC, UNIGINE, AIDA64 Extreme, PassMark, MAXON COMPUTER GMBH, Novabench, GFXBench, UserBenchmark, Baromitr, OPEXEngine, HWMonitor, CineBench, MSI Afterburner.
3. What are the main segments of the Benchmarking Software?
The market segments include Application, Types.
4. Can you provide details about the market size?
The market size is estimated to be USD XXX N/A as of 2022.
5. What are some drivers contributing to market growth?
N/A
6. What are the notable trends driving market growth?
N/A
7. Are there any restraints impacting market growth?
N/A
8. Can you provide examples of recent developments in the market?
N/A
9. What pricing options are available for accessing the report?
Pricing options include single-user, multi-user, and enterprise licenses priced at USD 4900.00, USD 7350.00, and USD 9800.00 respectively.
10. Is the market size provided in terms of value or volume?
The market size is provided in terms of value, measured in N/A.
11. Are there any specific market keywords associated with the report?
Yes, the market keyword associated with the report is "Benchmarking Software," which aids in identifying and referencing the specific market segment covered.
12. How do I determine which pricing option suits my needs best?
The pricing options vary based on user requirements and access needs. Individual users may opt for single-user licenses, while businesses requiring broader access may choose multi-user or enterprise licenses for cost-effective access to the report.
13. Are there any additional resources or data provided in the Benchmarking Software report?
While the report offers comprehensive insights, it's advisable to review the specific contents or supplementary materials provided to ascertain if additional resources or data are available.
14. How can I stay updated on further developments or reports in the Benchmarking Software?
To stay informed about further developments, trends, and reports in the Benchmarking Software, consider subscribing to industry newsletters, following relevant companies and organizations, or regularly checking reputable industry news sources and publications.
Methodology
Step 1 - Identification of Relevant Samples Size from Population Database


Step 2 - Approaches for Defining Global Market Size (Value, Volume* & Price*)

Note*: In applicable scenarios
Step 3 - Data Sources
Primary Research
- Web Analytics
- Survey Reports
- Research Institute
- Latest Research Reports
- Opinion Leaders
Secondary Research
- Annual Reports
- White Paper
- Latest Press Release
- Industry Association
- Paid Database
- Investor Presentations

Step 4 - Data Triangulation
Involves using different sources of information in order to increase the validity of a study
These sources are likely to be stakeholders in a program - participants, other researchers, program staff, other community members, and so on.
Then we put all data in single framework & apply various statistical tools to find out the dynamic on the market.
During the analysis stage, feedback from the stakeholder groups would be compared to determine areas of agreement as well as areas of divergence