

Key Insights
The Biomass Electric Power Generation Market is undergoing a significant transformation, driven by global mandates for decarbonization and enhanced energy security. Valued at $59390 million in 2025, the market is projected to expand at a Compound Annual Growth Rate (CAGR) of 3.4% from 2026 to 2034, reaching an estimated $79.95 billion by the end of the forecast period. This robust growth trajectory is underpinned by a confluence of factors, including the increasing focus on renewable energy sources, advancements in biomass conversion technologies, and the imperative for sustainable waste management solutions.
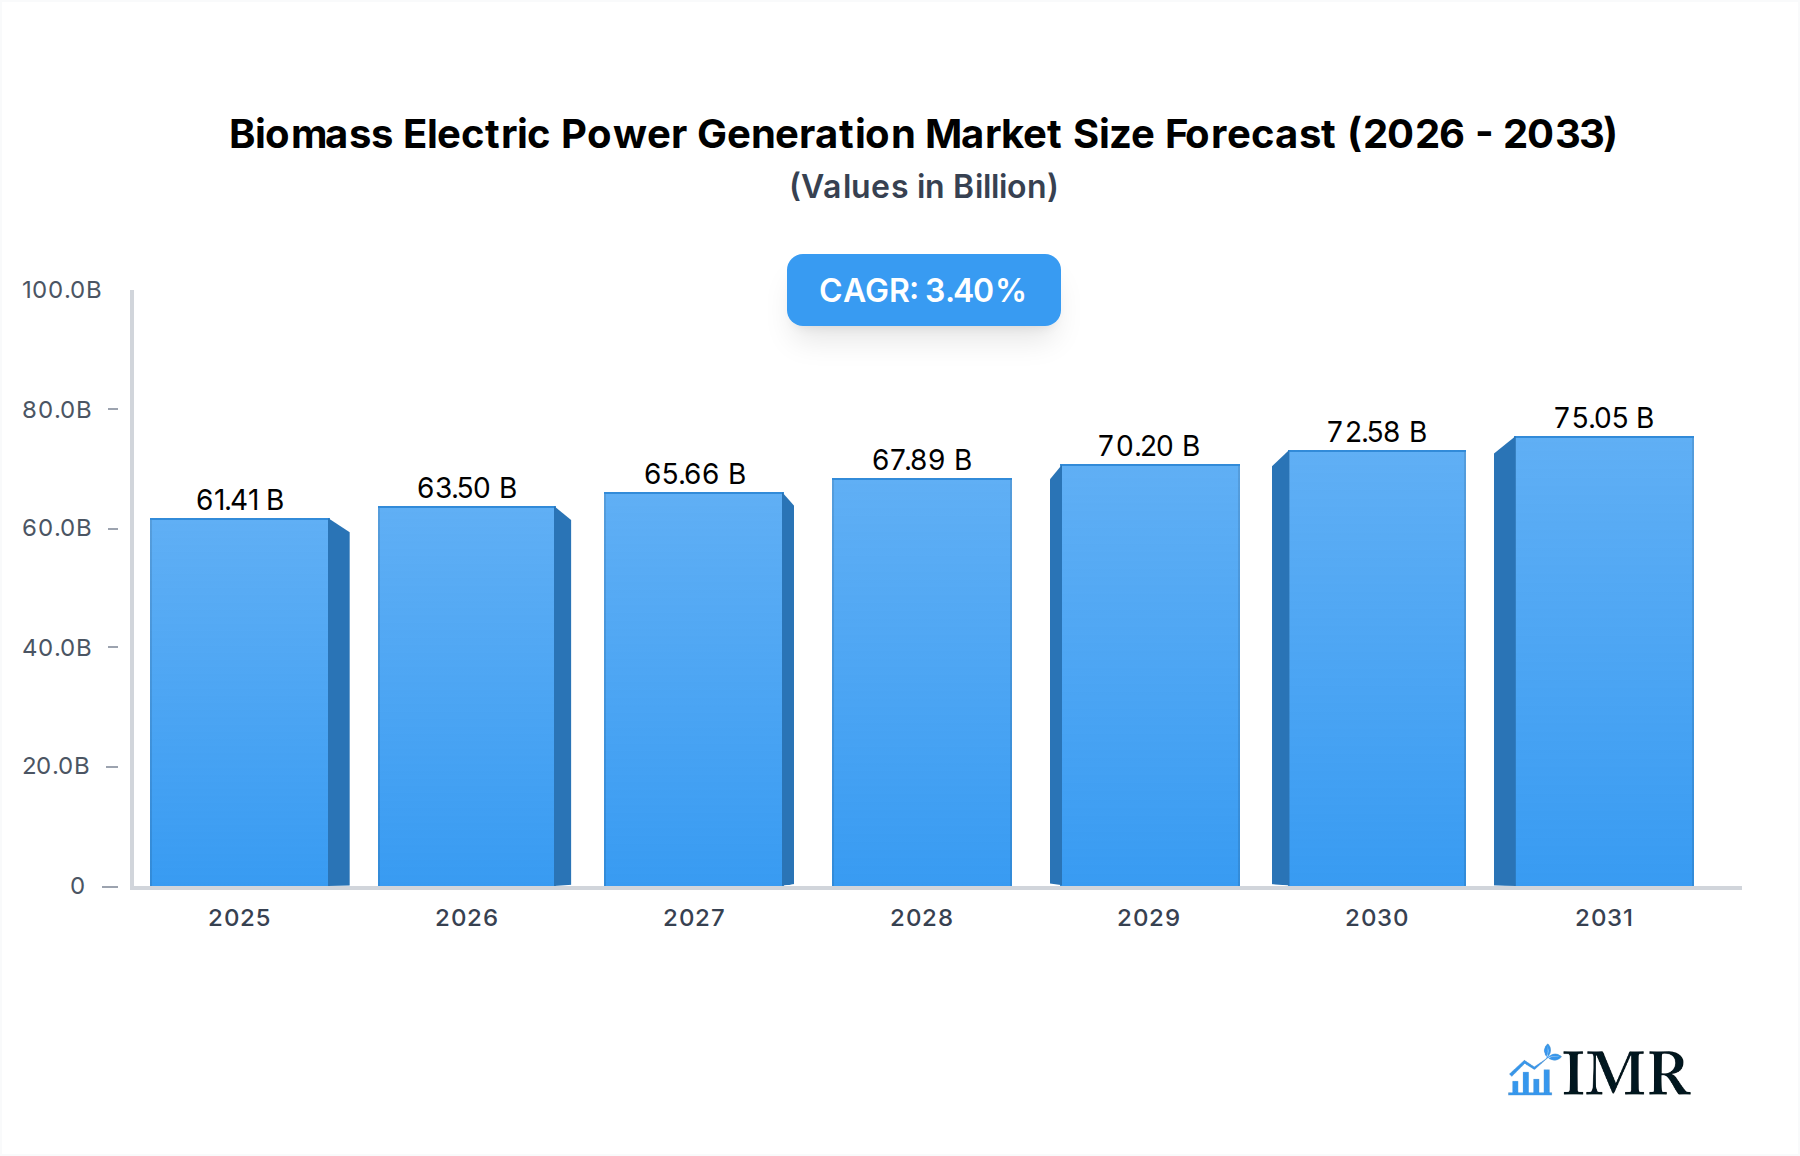
Biomass Electric Power Generation Market Size (In Billion)
Key demand drivers for the Biomass Electric Power Generation Market include supportive governmental policies, such as renewable energy subsidies, feed-in tariffs, and carbon credit mechanisms, which incentivize investment in bioenergy projects. Furthermore, the growing volume of agricultural and forest residues, coupled with municipal solid waste, presents a readily available and often underutilized feedstock supply. Innovations in gasification, anaerobic digestion, and pyrolysis technologies are enhancing efficiency and reducing the environmental footprint of biomass power plants, making them more competitive against conventional fossil fuel generation. The synergy between waste management and energy production is particularly potent, allowing municipalities and industries to address waste disposal challenges while simultaneously generating clean electricity.

Biomass Electric Power Generation Company Market Share
Macro tailwinds such as escalating fossil fuel prices, geopolitical instabilities impacting traditional energy supplies, and a heightened global awareness regarding climate change are accelerating the transition towards bioenergy. The integration of biomass power into existing grid infrastructure provides grid stability and dispatchable power, complementing intermittent renewable sources like solar and wind. Moreover, the circular economy principles embedded within the Biomass Electric Power Generation Market foster local job creation and economic development, particularly in rural and agricultural regions. The market's resilience against commodity price fluctuations for certain feedstocks further bolsters its appeal to investors. The continuous evolution of the broader Renewable Energy Generation Market, alongside the burgeoning Waste-to-Energy Market and the expanding Biofuel Production Market, creates a dynamic environment for sustained growth and innovation within biomass electric power generation.
Dominance of Combustion Technology in Biomass Electric Power Generation Market
The technology segment, specifically combustion, currently holds the largest revenue share within the global Biomass Electric Power Generation Market. This dominance is primarily attributed to its maturity, proven reliability, and widespread applicability across various scales and feedstock types. Direct combustion, the most common method, involves burning biomass (such as wood pellets, agricultural residues, or municipal solid waste) directly in a boiler to produce high-pressure steam. This steam then drives a turbine connected to a generator, producing electricity. The efficiency of modern combustion plants has significantly improved, incorporating advanced emission control systems and optimized boiler designs, which allows them to meet stringent environmental regulations while maximizing energy output.
Combustion technology benefits from its ability to process a diverse range of biomass feedstocks, from dedicated energy crops to industrial and agricultural wastes, making it a highly versatile solution. Its robust infrastructure, established supply chains, and extensive operational experience worldwide contribute to its leading position. Major players in the energy sector, including EDF, RWE, and Siemens Energy, have extensive portfolios in biomass combustion facilities, continually investing in upgrading existing plants and developing new projects. These companies leverage decades of engineering expertise to optimize plant performance, reduce operational costs, and enhance thermal efficiency, further solidifying combustion's market leadership.
While other technologies like gasification and anaerobic digestion are gaining traction due to their potential for higher efficiencies and production of more versatile energy carriers (e.g., syngas or biogas), combustion remains the cornerstone of utility-scale biomass electricity generation. The capital expenditure required for combustion plants can be substantial, but the long operational lifespans and the relatively stable cost of established biomass feedstocks contribute to favorable economics over the project's lifetime. Furthermore, co-firing biomass with coal in existing power plants—a common practice—offers a cost-effective pathway for reducing carbon emissions without major infrastructure overhauls. This approach allows for gradual integration of biomass, providing a transition mechanism towards full renewable deployment. The advancements in Gasification Technology Market and Anaerobic Digestion Market represent critical future growth vectors, but combustion's entrenched position, coupled with ongoing innovations in flue gas treatment and combined heat and power (CHP) applications, ensures its continued dominance in the foreseeable future of the Biomass Electric Power Generation Market.
Key Market Drivers and Challenges in Biomass Electric Power Generation Market
The Biomass Electric Power Generation Market is propelled by several robust drivers, fundamentally linked to global sustainability agendas and energy security. A primary driver is the accelerating global shift towards renewable energy sources, evidenced by national commitments to achieve net-zero emissions. Many countries have implemented ambitious renewable portfolio standards (RPS) or feed-in tariffs, creating a stable revenue stream for biomass power producers. For instance, the European Union's Renewable Energy Directive (RED II) targets a minimum of 32% renewable energy share by 2030, significantly supporting bioenergy deployment. This regulatory certainty stimulates investment and expansion within the market.
Another significant driver is the increasing focus on effective waste management. Agricultural and forest residues, along with municipal solid waste, pose substantial disposal challenges. Converting these wastes into electricity through biomass facilities provides a dual benefit: reducing landfill dependency and generating clean energy. The Agricultural Waste Management Market is intrinsically linked, as efficient collection and processing of residues enhance feedstock availability and reduce costs for biomass power plants. This closed-loop system mitigates environmental impacts while creating economic value from waste streams.
Conversely, the market faces several notable challenges. High capital expenditure (CAPEX) for establishing biomass power plants remains a significant barrier, particularly for advanced conversion technologies. These projects require substantial initial investment for construction, equipment procurement, and grid connection, making financing a critical hurdle. Furthermore, feedstock supply chain variability and sustainability concerns pose ongoing challenges. The availability, quality, and cost of biomass feedstock can fluctuate due based on seasonal factors, land use competition, and logistical complexities. Ensuring a consistent, economically viable, and sustainably sourced feedstock supply is paramount for long-term project viability.
Environmental concerns, particularly regarding air emissions (e.g., particulate matter, NOx) and the carbon neutrality debate, also constrain market growth. While biomass is considered carbon-neutral on a lifecycle basis when sustainably sourced, initial combustion releases greenhouse gases, necessitating advanced emission control technologies. Public perception and land-use conflicts further complicate project development. Despite these challenges, continuous technological innovation and supportive policy frameworks are expected to mitigate many of these constraints, particularly as global energy demand and the need for dispatchable renewable power intensify, influencing the broader Industrial Energy Consumption Market and energy transition strategies.
Competitive Ecosystem of Biomass Electric Power Generation Market
The competitive landscape of the Biomass Electric Power Generation Market is characterized by a mix of large multinational energy companies, specialized bioenergy firms, and regional independent power producers. These entities compete on technological expertise, feedstock sourcing capabilities, operational efficiency, and project development acumen:
- SUEZ Group : A global leader in environmental services, SUEZ Group offers comprehensive waste and water management solutions, playing a significant role in converting municipal and industrial waste into energy within the Biomass Electric Power Generation Market. Their expertise spans the entire value chain from collection to energy recovery, supporting the expansion of the global Waste-to-Energy Market.
- ENGIE: A multinational electric utility company, ENGIE is heavily involved in renewable energy development, including biomass power generation. They focus on integrated energy solutions, often incorporating biomass as a key component of their diversified generation portfolio.
- ACCIONA: A Spanish conglomerate dedicated to sustainable infrastructure and renewable energy, ACCIONA operates numerous biomass power plants globally, emphasizing sustainable sourcing and efficient energy conversion technologies across its projects.
- EPH: Energetický a průmyslový holding (EPH) is a leading Central European energy group with a significant presence in thermal and renewable generation, including biomass, playing a key role in the regional power landscape.
- Xcel Energy Inc.: An American utility holding company, Xcel Energy is committed to clean energy transition, integrating biomass and other renewables into its generation mix to meet sustainability goals for its customers and the broader
Renewable Energy Utilities Market. - Ramboll Group A/S: A global engineering, architecture, and consultancy company, Ramboll provides technical expertise for biomass power plant development, from feasibility studies and design to project management, supporting clients in optimizing their bioenergy investments.
- EDF: As a major global electricity producer, Électricité de France (EDF) has a substantial renewable energy portfolio, with significant investments in biomass power, particularly in Europe, contributing to its low-carbon generation strategy.
- Babcock & Wilcox Enterprises, Inc.: A global leader in power generation and environmental technologies, Babcock & Wilcox supplies advanced combustion and environmental equipment for biomass-fired power plants, enhancing their efficiency and emission profiles.
- Orsted A/S: A Danish multinational power company, Ørsted is a leader in offshore wind, but also actively invests in sustainable biomass power as part of its strategy to transition from fossil fuels to a fully green energy company.
- Ameresco: A leading energy efficiency and renewable energy company, Ameresco develops, owns, and operates biomass power facilities, providing integrated solutions for customers looking to reduce energy costs and carbon footprints.
- Siemens Energy: A global energy technology company, Siemens Energy provides critical components and full power plant solutions for biomass-fired generation, including turbines and automation systems, driving efficiency and innovation.
- Statkraft: A state-owned Norwegian energy company, Statkraft is Europe’s largest generator of renewable energy, with a diverse portfolio that includes significant biomass assets, contributing to secure and sustainable energy supply.
- General Electric: A global digital industrial company, General Electric offers various solutions for the power sector, including steam turbines and generators applicable to biomass power plants, supporting energy infrastructure development.
- RWE: A German energy company, RWE is a major electricity producer with a growing portfolio of renewable assets, including biomass co-firing and dedicated biomass plants, aligning with its decarbonization targets.
- AXIS Tech: A technology provider, AXIS Tech specializes in engineering and equipment for biomass combustion and gasification, offering innovative solutions for efficient bioenergy conversion.
- Veolia: A French transnational company, Veolia specializes in waste, water, and energy management, playing a critical role in developing and operating biomass power facilities, particularly those converting municipal and industrial waste.
- Vattenfall: A Swedish state-owned power company, Vattenfall is a leading European energy provider with a strong commitment to renewable energy, including extensive investments in biomass-fueled combined heat and power plants.
- Infinite Energy Pvt. Ltd.: An Indian renewable energy company, Infinite Energy focuses on developing and deploying various renewable energy projects, including biomass-based power generation, catering to regional energy demands.
- Others: The market also includes numerous regional players and specialized technology firms that contribute to the innovation and expansion of biomass electric power generation through niche solutions and localized projects.
Recent Developments & Milestones in Biomass Electric Power Generation Market
Recent developments in the Biomass Electric Power Generation Market highlight continuous innovation, strategic partnerships, and increasing policy support:
- November 2023: A major European utility announced the commissioning of a 150 MW dedicated biomass power plant, featuring advanced flue gas treatment technologies to significantly reduce emissions, marking a substantial investment in dispatchable renewable capacity.
- September 2023: A consortium of leading research institutions and industrial players secured significant funding from an international clean energy program to develop and commercialize next-generation pyrolysis reactors for advanced bio-oil production, aiming for higher efficiency and broader feedstock flexibility.
- July 2023: Several Asian governments introduced enhanced financial incentives and revised renewable energy targets that specifically included biomass, aiming to diversify their energy mix and utilize abundant agricultural waste, signaling a strong policy push.
- May 2023: A prominent technology firm unveiled a modular biomass gasification unit designed for decentralized power generation, targeting remote communities and industrial sites seeking self-sufficiency and reduced grid reliance.
- March 2023: A strategic partnership was formed between a leading waste management company and an energy provider to develop several large-scale
Waste-to-Energy Marketfacilities, utilizing municipal solid waste as a primary feedstock to generate electricity and heat. - January 2023: Innovations in sustainable forestry management and certification schemes gained traction, providing verifiable proof of feedstock sustainability, which is crucial for meeting stringent environmental criteria in key European markets.
- November 2022: A breakthrough in algae-to-bioenergy conversion technology showed promising results in pilot studies, demonstrating the potential for algae as a high-yield, low-footprint feedstock for future biomass power generation, though commercialization remains distant.
- September 2022: Key industry players collaborated to establish a new industry standard for biomass pellet quality and sustainability, aiming to streamline international trade and enhance market transparency for solid biomass fuels.
Regional Market Breakdown for Biomass Electric Power Generation Market
Globally, the Biomass Electric Power Generation Market exhibits diverse regional dynamics, driven by varying regulatory frameworks, feedstock availability, and energy demand profiles. While specific regional CAGR and revenue share data are not provided, an analysis of market drivers and existing infrastructure allows for a qualitative assessment of regional contributions.
Asia Pacific is projected to be the fastest-growing region, with an estimated CAGR exceeding 5% through 2034. This growth is primarily fueled by rapid industrialization, escalating energy demand, and abundant agricultural residues in countries like China, India, and ASEAN nations. Governments in these regions are increasingly prioritizing renewable energy to address air pollution and energy security concerns, leading to significant investments in biomass power plants. India, for instance, has a vast potential for biomass energy from crop residues, aiming to integrate more biomass into its grid.
Europe represents a mature but robust market, holding a significant revenue share, with an estimated regional CAGR of around 2.5-3.0%. Countries such as the United Kingdom, Germany, France, and the Nordics have established policies, strong infrastructure, and high environmental standards that have historically supported bioenergy. The region heavily relies on imported wood pellets and domestic forest residues. Demand is further boosted by the Renewable Energy Generation Market targets and the phase-out of coal-fired power plants, often replaced by or co-fired with biomass. The Anaerobic Digestion Market is particularly strong in countries like Germany, utilizing agricultural waste and municipal biogas.
North America, led by the United States and Canada, also commands a substantial market share, with a projected CAGR similar to Europe, around 2.8-3.3%. The region benefits from extensive forest resources and agricultural lands, providing ample feedstock. Supportive federal and state-level policies, alongside corporate sustainability initiatives, drive investments. The Landfill Gas Utilization Market is a notable segment in the US, contributing significantly to biomass electric power. The push for distributed generation and industrial self-sufficiency also bolsters regional growth.
South America and Middle East & Africa are emerging markets, showing high growth potential from a lower base, with estimated CAGRs between 4-6%. Brazil, in particular, is a leader in bioenergy, leveraging its vast sugarcane industry for bagasse-based power generation. In Africa, the need for rural electrification and sustainable waste management is driving interest in smaller-scale biomass projects, although investment and infrastructure remain challenges. The GCC region in the Middle East is exploring diversified energy sources beyond fossil fuels, showing nascent interest in waste-to-energy biomass solutions.
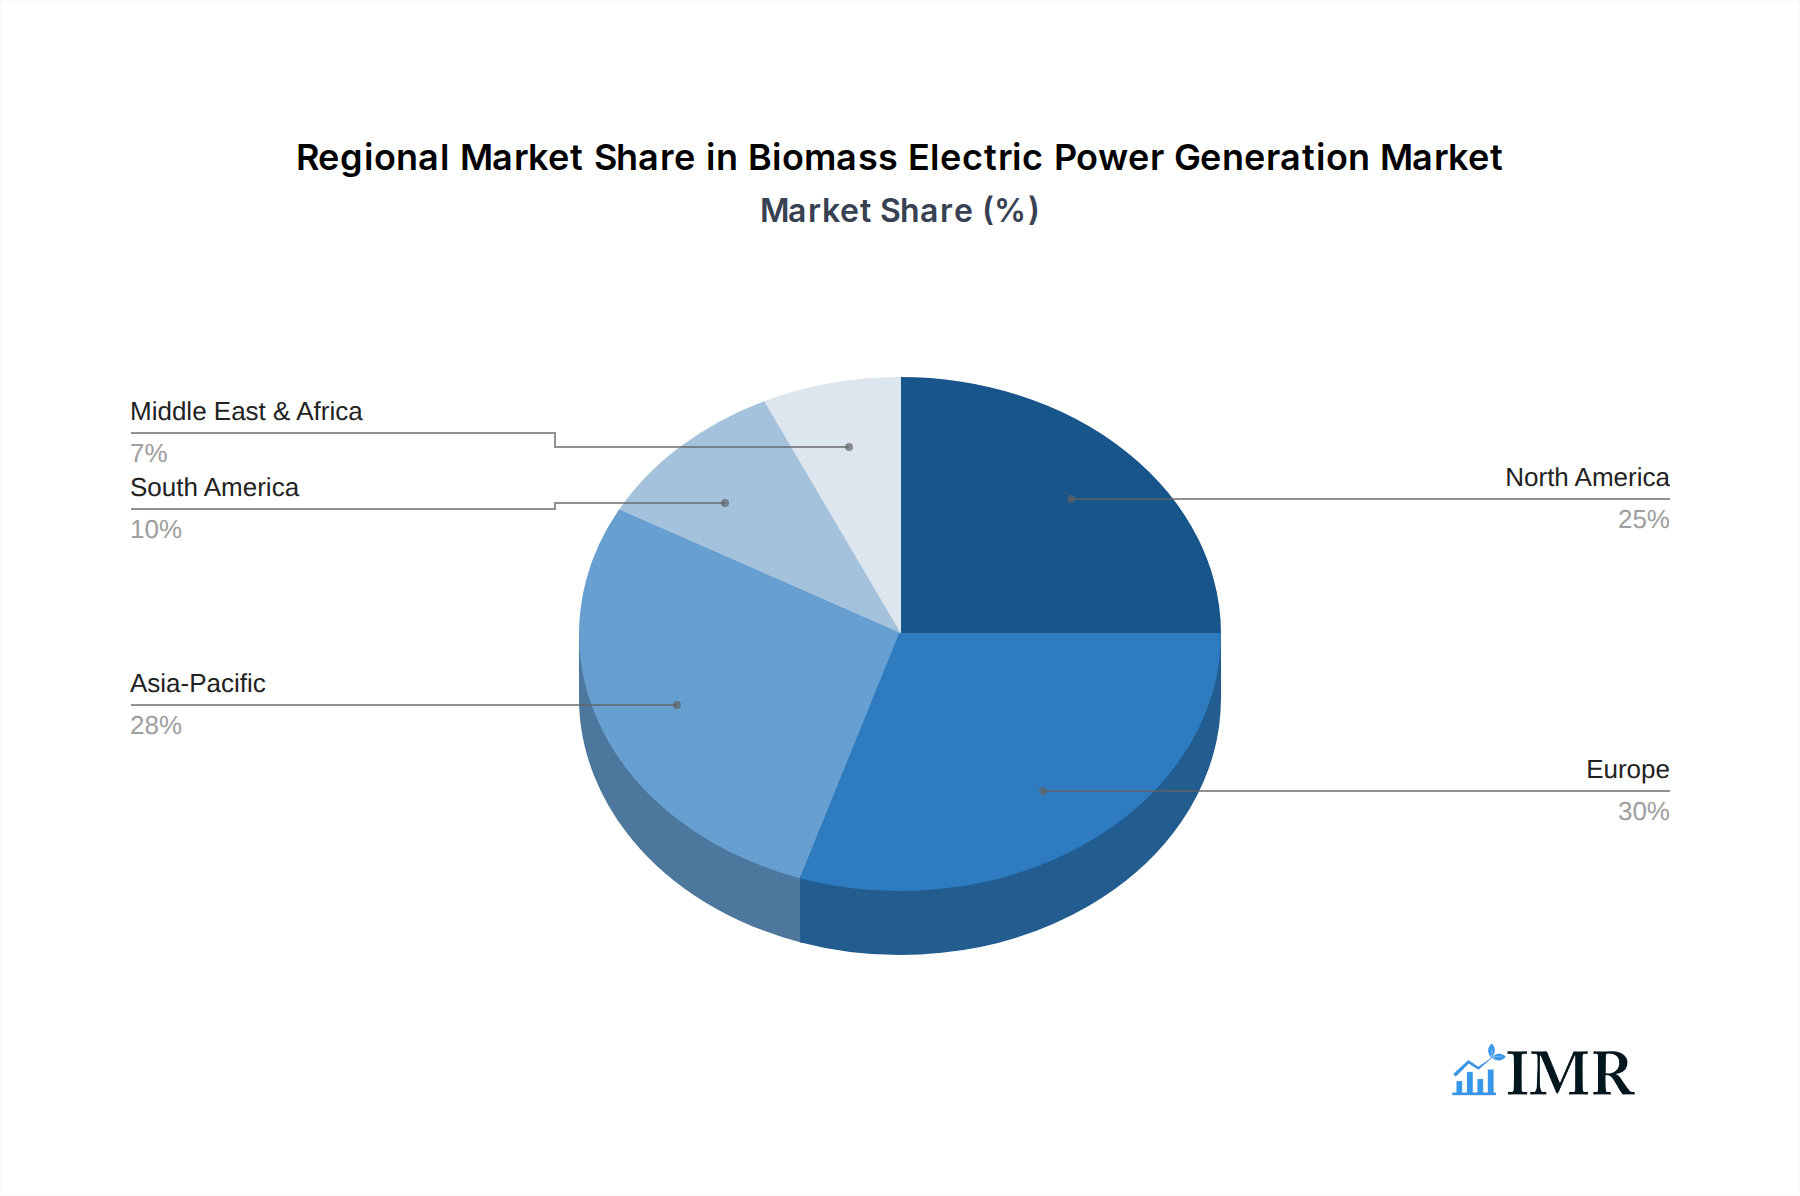
Biomass Electric Power Generation Regional Market Share
Export, Trade Flow & Tariff Impact on Biomass Electric Power Generation Market
The global Biomass Electric Power Generation Market is significantly influenced by international trade flows, particularly for solid biomass fuels such as wood pellets and wood chips. Major trade corridors exist between North America (especially the U.S. and Canada) and Europe, and increasingly between Southeast Asia and East Asia. The United States and Canada are leading exporters of wood pellets, primarily destined for the European Union and the United Kingdom, where demand for industrial biomass fuel to co-fire coal plants or fuel dedicated biomass power plants is high due to stringent renewable energy mandates. Similarly, Vietnam and Malaysia are emerging as significant exporters to the South Korean and Japanese markets, driven by their respective renewable energy targets.
Tariffs and non-tariff barriers can significantly impact the economics of the Biomass Electric Power Generation Market. Historically, biomass fuels have enjoyed relatively low tariff rates in major importing regions to encourage renewable energy adoption. However, phytosanitary regulations, sustainability certification requirements (e.g., from organizations like the Sustainable Biomass Program - SBP), and import quotas act as substantial non-tariff barriers. For instance, European Union regulations on the sustainability criteria for biomass imports necessitate robust chain-of-custody tracking and compliance, which can increase operational costs for exporters and influence trade patterns. Recent trade policy shifts, particularly those addressing illegal logging or promoting domestic biomass production, could lead to increased scrutiny or new tariffs, potentially raising feedstock prices and impacting the competitiveness of imported biomass. Geopolitical tensions and trade disputes, though less directly impacting biomass than other commodities, can disrupt shipping routes and increase freight costs, indirectly affecting the delivered price of biomass and thus the profitability of power generation projects reliant on international trade.
Investment & Funding Activity in Biomass Electric Power Generation Market
Investment and funding activity within the Biomass Electric Power Generation Market has seen consistent, albeit targeted, engagement over the past 2-3 years, driven by the broader push for decarbonization and energy independence. Mergers and acquisitions (M&A) have typically involved larger utilities acquiring operational biomass plants or specialized bioenergy companies to expand their renewable portfolios. For example, several European utilities have acquired existing combined heat and power (CHP) biomass facilities to secure dispatchable renewable capacity and integrate into district heating networks. These M&A activities reflect a consolidation trend as larger players seek to capitalize on established assets and market positions, particularly in the Renewable Energy Utilities Market.
Venture funding rounds, while less frequent for traditional combustion biomass plants, have been more vibrant in innovative sub-segments. Advanced bioenergy technologies, such as those focused on converting diverse waste streams (e.g., municipal solid waste, plastic waste) into bioenergy or synthetic fuels, are attracting considerable venture capital. Start-ups developing novel Gasification Technology Market for waste-to-energy applications or advanced Anaerobic Digestion Market solutions for biogas upgrading and injection into natural gas grids have seen notable investments. These investments are driven by the promise of higher energy conversion efficiencies, broader feedstock flexibility, and reduced environmental footprints. The integration of carbon capture, utilization, and storage (CCUS) technologies with biomass power (Bioenergy with Carbon Capture and Storage – BECCS) is a nascent but high-potential area that has begun to attract strategic investments from energy majors and specialized climate tech funds.
Strategic partnerships are also prevalent, often involving technology providers, feedstock suppliers, and project developers. These collaborations aim to de-risk complex projects, optimize supply chains, and share expertise in technology deployment. For instance, partnerships between agricultural cooperatives and energy companies are common to ensure a stable and sustainable supply of feedstock for biomass power plants, directly impacting the viability of the Agricultural Waste Management Market. Furthermore, public-private partnerships are crucial, especially in developing new infrastructure and demonstrating novel technologies. Government grants and green bonds also play a vital role in de-risking early-stage projects and facilitating large-scale deployment, particularly for projects aligning with national energy transition and waste reduction targets.
Biomass Electric Power Generation Segmentation
-
1. Feedstock
- 1.1. Agricultural and Forest Residues
- 1.2. Energy Crops
- 1.3. Animal Waste
- 1.4. Municipal Solid Waste
- 1.5. Landfill Gas & Biogas
- 1.6. Algae
- 1.7. Others
-
2. Power Capacity
- 2.1. Below 10 MW
- 2.2. 10 MW to 50 MW
- 2.3. 51 MW to 100 MW
- 2.4. Above 100 MW
-
3. Technology
- 3.1. Combustion
- 3.2. Gasification
- 3.3. Anaerobic Digestion
- 3.4. Pyrolysis
- 3.5. Oil Exaction
- 3.6. Fermentation
-
4. End User
- 4.1. Utilities
- 4.2. Industrial Sector
- 4.3. Commercial Sector
- 4.4. Municipalities
- 4.5. Independent Power Producers (IPPs)
Biomass Electric Power Generation Segmentation By Geography
- 1. undefined
- 2. undefined
- 3. undefined
- 4. undefined
- 5. undefined
Biomass Electric Power Generation Regional Market Share
Geographic Coverage of Biomass Electric Power Generation
Biomass Electric Power Generation REPORT HIGHLIGHTS
| Aspects | Details |
|---|---|
| Study Period | 2020-2034 |
| Base Year | 2025 |
| Estimated Year | 2026 |
| Forecast Period | 2026-2034 |
| Historical Period | 2020-2025 |
| Growth Rate | CAGR of 3.4% from 2020-2034 |
| Segmentation |
|
Table of Contents
- 1. Introduction
- 1.1. Research Scope
- 1.2. Market Segmentation
- 1.3. Research Objective
- 1.4. Definitions and Assumptions
- 2. Executive Summary
- 2.1. Market Snapshot
- 3. Market Dynamics
- 3.1. Market Drivers
- 3.2. Market Restrains
- 3.3. Market Trends
- 3.4. Market Opportunities
- 4. Market Factor Analysis
- 4.1. Porters Five Forces
- 4.1.1. Bargaining Power of Suppliers
- 4.1.2. Bargaining Power of Buyers
- 4.1.3. Threat of New Entrants
- 4.1.4. Threat of Substitutes
- 4.1.5. Competitive Rivalry
- 4.2. PESTEL analysis
- 4.3. BCG Analysis
- 4.3.1. Stars (High Growth, High Market Share)
- 4.3.2. Cash Cows (Low Growth, High Market Share)
- 4.3.3. Question Mark (High Growth, Low Market Share)
- 4.3.4. Dogs (Low Growth, Low Market Share)
- 4.4. Ansoff Matrix Analysis
- 4.5. Supply Chain Analysis
- 4.6. Regulatory Landscape
- 4.7. Current Market Potential and Opportunity Assessment (TAM–SAM–SOM Framework)
- 4.8. IMR Analyst Note
- 4.1. Porters Five Forces
- 5. Market Analysis, Insights and Forecast 2021-2033
- 5.1. Market Analysis, Insights and Forecast - by Feedstock
- 5.1.1. Agricultural and Forest Residues
- 5.1.2. Energy Crops
- 5.1.3. Animal Waste
- 5.1.4. Municipal Solid Waste
- 5.1.5. Landfill Gas & Biogas
- 5.1.6. Algae
- 5.1.7. Others
- 5.2. Market Analysis, Insights and Forecast - by Power Capacity
- 5.2.1. Below 10 MW
- 5.2.2. 10 MW to 50 MW
- 5.2.3. 51 MW to 100 MW
- 5.2.4. Above 100 MW
- 5.3. Market Analysis, Insights and Forecast - by Technology
- 5.3.1. Combustion
- 5.3.2. Gasification
- 5.3.3. Anaerobic Digestion
- 5.3.4. Pyrolysis
- 5.3.5. Oil Exaction
- 5.3.6. Fermentation
- 5.4. Market Analysis, Insights and Forecast - by End User
- 5.4.1. Utilities
- 5.4.2. Industrial Sector
- 5.4.3. Commercial Sector
- 5.4.4. Municipalities
- 5.4.5. Independent Power Producers (IPPs)
- 5.5. Market Analysis, Insights and Forecast - by Region
- 5.5.1.
- 5.5.2.
- 5.5.3.
- 5.5.4.
- 5.5.5.
- 5.1. Market Analysis, Insights and Forecast - by Feedstock
- 6. Global Biomass Electric Power Generation Analysis, Insights and Forecast, 2021-2033
- 6.1. Market Analysis, Insights and Forecast - by Feedstock
- 6.1.1. Agricultural and Forest Residues
- 6.1.2. Energy Crops
- 6.1.3. Animal Waste
- 6.1.4. Municipal Solid Waste
- 6.1.5. Landfill Gas & Biogas
- 6.1.6. Algae
- 6.1.7. Others
- 6.2. Market Analysis, Insights and Forecast - by Power Capacity
- 6.2.1. Below 10 MW
- 6.2.2. 10 MW to 50 MW
- 6.2.3. 51 MW to 100 MW
- 6.2.4. Above 100 MW
- 6.3. Market Analysis, Insights and Forecast - by Technology
- 6.3.1. Combustion
- 6.3.2. Gasification
- 6.3.3. Anaerobic Digestion
- 6.3.4. Pyrolysis
- 6.3.5. Oil Exaction
- 6.3.6. Fermentation
- 6.4. Market Analysis, Insights and Forecast - by End User
- 6.4.1. Utilities
- 6.4.2. Industrial Sector
- 6.4.3. Commercial Sector
- 6.4.4. Municipalities
- 6.4.5. Independent Power Producers (IPPs)
- 6.1. Market Analysis, Insights and Forecast - by Feedstock
- 7. undefined Biomass Electric Power Generation Analysis, Insights and Forecast, 2020-2032
- 7.1. Market Analysis, Insights and Forecast - by Feedstock
- 7.1.1. Agricultural and Forest Residues
- 7.1.2. Energy Crops
- 7.1.3. Animal Waste
- 7.1.4. Municipal Solid Waste
- 7.1.5. Landfill Gas & Biogas
- 7.1.6. Algae
- 7.1.7. Others
- 7.2. Market Analysis, Insights and Forecast - by Power Capacity
- 7.2.1. Below 10 MW
- 7.2.2. 10 MW to 50 MW
- 7.2.3. 51 MW to 100 MW
- 7.2.4. Above 100 MW
- 7.3. Market Analysis, Insights and Forecast - by Technology
- 7.3.1. Combustion
- 7.3.2. Gasification
- 7.3.3. Anaerobic Digestion
- 7.3.4. Pyrolysis
- 7.3.5. Oil Exaction
- 7.3.6. Fermentation
- 7.4. Market Analysis, Insights and Forecast - by End User
- 7.4.1. Utilities
- 7.4.2. Industrial Sector
- 7.4.3. Commercial Sector
- 7.4.4. Municipalities
- 7.4.5. Independent Power Producers (IPPs)
- 7.1. Market Analysis, Insights and Forecast - by Feedstock
- 8. undefined Biomass Electric Power Generation Analysis, Insights and Forecast, 2020-2032
- 8.1. Market Analysis, Insights and Forecast - by Feedstock
- 8.1.1. Agricultural and Forest Residues
- 8.1.2. Energy Crops
- 8.1.3. Animal Waste
- 8.1.4. Municipal Solid Waste
- 8.1.5. Landfill Gas & Biogas
- 8.1.6. Algae
- 8.1.7. Others
- 8.2. Market Analysis, Insights and Forecast - by Power Capacity
- 8.2.1. Below 10 MW
- 8.2.2. 10 MW to 50 MW
- 8.2.3. 51 MW to 100 MW
- 8.2.4. Above 100 MW
- 8.3. Market Analysis, Insights and Forecast - by Technology
- 8.3.1. Combustion
- 8.3.2. Gasification
- 8.3.3. Anaerobic Digestion
- 8.3.4. Pyrolysis
- 8.3.5. Oil Exaction
- 8.3.6. Fermentation
- 8.4. Market Analysis, Insights and Forecast - by End User
- 8.4.1. Utilities
- 8.4.2. Industrial Sector
- 8.4.3. Commercial Sector
- 8.4.4. Municipalities
- 8.4.5. Independent Power Producers (IPPs)
- 8.1. Market Analysis, Insights and Forecast - by Feedstock
- 9. undefined Biomass Electric Power Generation Analysis, Insights and Forecast, 2020-2032
- 9.1. Market Analysis, Insights and Forecast - by Feedstock
- 9.1.1. Agricultural and Forest Residues
- 9.1.2. Energy Crops
- 9.1.3. Animal Waste
- 9.1.4. Municipal Solid Waste
- 9.1.5. Landfill Gas & Biogas
- 9.1.6. Algae
- 9.1.7. Others
- 9.2. Market Analysis, Insights and Forecast - by Power Capacity
- 9.2.1. Below 10 MW
- 9.2.2. 10 MW to 50 MW
- 9.2.3. 51 MW to 100 MW
- 9.2.4. Above 100 MW
- 9.3. Market Analysis, Insights and Forecast - by Technology
- 9.3.1. Combustion
- 9.3.2. Gasification
- 9.3.3. Anaerobic Digestion
- 9.3.4. Pyrolysis
- 9.3.5. Oil Exaction
- 9.3.6. Fermentation
- 9.4. Market Analysis, Insights and Forecast - by End User
- 9.4.1. Utilities
- 9.4.2. Industrial Sector
- 9.4.3. Commercial Sector
- 9.4.4. Municipalities
- 9.4.5. Independent Power Producers (IPPs)
- 9.1. Market Analysis, Insights and Forecast - by Feedstock
- 10. undefined Biomass Electric Power Generation Analysis, Insights and Forecast, 2020-2032
- 10.1. Market Analysis, Insights and Forecast - by Feedstock
- 10.1.1. Agricultural and Forest Residues
- 10.1.2. Energy Crops
- 10.1.3. Animal Waste
- 10.1.4. Municipal Solid Waste
- 10.1.5. Landfill Gas & Biogas
- 10.1.6. Algae
- 10.1.7. Others
- 10.2. Market Analysis, Insights and Forecast - by Power Capacity
- 10.2.1. Below 10 MW
- 10.2.2. 10 MW to 50 MW
- 10.2.3. 51 MW to 100 MW
- 10.2.4. Above 100 MW
- 10.3. Market Analysis, Insights and Forecast - by Technology
- 10.3.1. Combustion
- 10.3.2. Gasification
- 10.3.3. Anaerobic Digestion
- 10.3.4. Pyrolysis
- 10.3.5. Oil Exaction
- 10.3.6. Fermentation
- 10.4. Market Analysis, Insights and Forecast - by End User
- 10.4.1. Utilities
- 10.4.2. Industrial Sector
- 10.4.3. Commercial Sector
- 10.4.4. Municipalities
- 10.4.5. Independent Power Producers (IPPs)
- 10.1. Market Analysis, Insights and Forecast - by Feedstock
- 11. undefined Biomass Electric Power Generation Analysis, Insights and Forecast, 2020-2032
- 11.1. Market Analysis, Insights and Forecast - by Feedstock
- 11.1.1. Agricultural and Forest Residues
- 11.1.2. Energy Crops
- 11.1.3. Animal Waste
- 11.1.4. Municipal Solid Waste
- 11.1.5. Landfill Gas & Biogas
- 11.1.6. Algae
- 11.1.7. Others
- 11.2. Market Analysis, Insights and Forecast - by Power Capacity
- 11.2.1. Below 10 MW
- 11.2.2. 10 MW to 50 MW
- 11.2.3. 51 MW to 100 MW
- 11.2.4. Above 100 MW
- 11.3. Market Analysis, Insights and Forecast - by Technology
- 11.3.1. Combustion
- 11.3.2. Gasification
- 11.3.3. Anaerobic Digestion
- 11.3.4. Pyrolysis
- 11.3.5. Oil Exaction
- 11.3.6. Fermentation
- 11.4. Market Analysis, Insights and Forecast - by End User
- 11.4.1. Utilities
- 11.4.2. Industrial Sector
- 11.4.3. Commercial Sector
- 11.4.4. Municipalities
- 11.4.5. Independent Power Producers (IPPs)
- 11.1. Market Analysis, Insights and Forecast - by Feedstock
- 12. Competitive Analysis
- 12.1. Company Profiles
- 12.1.1 SUEZ Group
- 12.1.1.1. Company Overview
- 12.1.1.2. Products
- 12.1.1.3. Company Financials
- 12.1.1.4. SWOT Analysis
- 12.1.2 ENGIE
- 12.1.2.1. Company Overview
- 12.1.2.2. Products
- 12.1.2.3. Company Financials
- 12.1.2.4. SWOT Analysis
- 12.1.3 ACCIONA
- 12.1.3.1. Company Overview
- 12.1.3.2. Products
- 12.1.3.3. Company Financials
- 12.1.3.4. SWOT Analysis
- 12.1.4 EPH
- 12.1.4.1. Company Overview
- 12.1.4.2. Products
- 12.1.4.3. Company Financials
- 12.1.4.4. SWOT Analysis
- 12.1.5 Xcel Energy Inc.
- 12.1.5.1. Company Overview
- 12.1.5.2. Products
- 12.1.5.3. Company Financials
- 12.1.5.4. SWOT Analysis
- 12.1.6 Ramboll Group A/S
- 12.1.6.1. Company Overview
- 12.1.6.2. Products
- 12.1.6.3. Company Financials
- 12.1.6.4. SWOT Analysis
- 12.1.7 EDF
- 12.1.7.1. Company Overview
- 12.1.7.2. Products
- 12.1.7.3. Company Financials
- 12.1.7.4. SWOT Analysis
- 12.1.8 Babcock & Wilcox Enterprises Inc.
- 12.1.8.1. Company Overview
- 12.1.8.2. Products
- 12.1.8.3. Company Financials
- 12.1.8.4. SWOT Analysis
- 12.1.9 Orsted A/S
- 12.1.9.1. Company Overview
- 12.1.9.2. Products
- 12.1.9.3. Company Financials
- 12.1.9.4. SWOT Analysis
- 12.1.10 Ameresco
- 12.1.10.1. Company Overview
- 12.1.10.2. Products
- 12.1.10.3. Company Financials
- 12.1.10.4. SWOT Analysis
- 12.1.11 Siemens Energy
- 12.1.11.1. Company Overview
- 12.1.11.2. Products
- 12.1.11.3. Company Financials
- 12.1.11.4. SWOT Analysis
- 12.1.12 Statkraft
- 12.1.12.1. Company Overview
- 12.1.12.2. Products
- 12.1.12.3. Company Financials
- 12.1.12.4. SWOT Analysis
- 12.1.13 General Electric
- 12.1.13.1. Company Overview
- 12.1.13.2. Products
- 12.1.13.3. Company Financials
- 12.1.13.4. SWOT Analysis
- 12.1.14 RWE
- 12.1.14.1. Company Overview
- 12.1.14.2. Products
- 12.1.14.3. Company Financials
- 12.1.14.4. SWOT Analysis
- 12.1.15 AXIS Tech
- 12.1.15.1. Company Overview
- 12.1.15.2. Products
- 12.1.15.3. Company Financials
- 12.1.15.4. SWOT Analysis
- 12.1.16 Veolia
- 12.1.16.1. Company Overview
- 12.1.16.2. Products
- 12.1.16.3. Company Financials
- 12.1.16.4. SWOT Analysis
- 12.1.17 Vattenfall
- 12.1.17.1. Company Overview
- 12.1.17.2. Products
- 12.1.17.3. Company Financials
- 12.1.17.4. SWOT Analysis
- 12.1.18 Infinite Energy Pvt. Ltd.
- 12.1.18.1. Company Overview
- 12.1.18.2. Products
- 12.1.18.3. Company Financials
- 12.1.18.4. SWOT Analysis
- 12.1.19 Others
- 12.1.19.1. Company Overview
- 12.1.19.2. Products
- 12.1.19.3. Company Financials
- 12.1.19.4. SWOT Analysis
- 12.1.1 SUEZ Group
- 12.2. Market Entropy
- 12.2.1 Company's Key Areas Served
- 12.2.2 Recent Developments
- 12.3. Company Market Share Analysis 2025
- 12.3.1 Top 5 Companies Market Share Analysis
- 12.3.2 Top 3 Companies Market Share Analysis
- 12.4. List of Potential Customers
- 13. Research Methodology
List of Figures
- Figure 1: Global Biomass Electric Power Generation Revenue Breakdown (million, %) by Region 2025 & 2033
- Figure 2: undefined Biomass Electric Power Generation Revenue (million), by Feedstock 2025 & 2033
- Figure 3: undefined Biomass Electric Power Generation Revenue Share (%), by Feedstock 2025 & 2033
- Figure 4: undefined Biomass Electric Power Generation Revenue (million), by Power Capacity 2025 & 2033
- Figure 5: undefined Biomass Electric Power Generation Revenue Share (%), by Power Capacity 2025 & 2033
- Figure 6: undefined Biomass Electric Power Generation Revenue (million), by Technology 2025 & 2033
- Figure 7: undefined Biomass Electric Power Generation Revenue Share (%), by Technology 2025 & 2033
- Figure 8: undefined Biomass Electric Power Generation Revenue (million), by End User 2025 & 2033
- Figure 9: undefined Biomass Electric Power Generation Revenue Share (%), by End User 2025 & 2033
- Figure 10: undefined Biomass Electric Power Generation Revenue (million), by Country 2025 & 2033
- Figure 11: undefined Biomass Electric Power Generation Revenue Share (%), by Country 2025 & 2033
- Figure 12: undefined Biomass Electric Power Generation Revenue (million), by Feedstock 2025 & 2033
- Figure 13: undefined Biomass Electric Power Generation Revenue Share (%), by Feedstock 2025 & 2033
- Figure 14: undefined Biomass Electric Power Generation Revenue (million), by Power Capacity 2025 & 2033
- Figure 15: undefined Biomass Electric Power Generation Revenue Share (%), by Power Capacity 2025 & 2033
- Figure 16: undefined Biomass Electric Power Generation Revenue (million), by Technology 2025 & 2033
- Figure 17: undefined Biomass Electric Power Generation Revenue Share (%), by Technology 2025 & 2033
- Figure 18: undefined Biomass Electric Power Generation Revenue (million), by End User 2025 & 2033
- Figure 19: undefined Biomass Electric Power Generation Revenue Share (%), by End User 2025 & 2033
- Figure 20: undefined Biomass Electric Power Generation Revenue (million), by Country 2025 & 2033
- Figure 21: undefined Biomass Electric Power Generation Revenue Share (%), by Country 2025 & 2033
- Figure 22: undefined Biomass Electric Power Generation Revenue (million), by Feedstock 2025 & 2033
- Figure 23: undefined Biomass Electric Power Generation Revenue Share (%), by Feedstock 2025 & 2033
- Figure 24: undefined Biomass Electric Power Generation Revenue (million), by Power Capacity 2025 & 2033
- Figure 25: undefined Biomass Electric Power Generation Revenue Share (%), by Power Capacity 2025 & 2033
- Figure 26: undefined Biomass Electric Power Generation Revenue (million), by Technology 2025 & 2033
- Figure 27: undefined Biomass Electric Power Generation Revenue Share (%), by Technology 2025 & 2033
- Figure 28: undefined Biomass Electric Power Generation Revenue (million), by End User 2025 & 2033
- Figure 29: undefined Biomass Electric Power Generation Revenue Share (%), by End User 2025 & 2033
- Figure 30: undefined Biomass Electric Power Generation Revenue (million), by Country 2025 & 2033
- Figure 31: undefined Biomass Electric Power Generation Revenue Share (%), by Country 2025 & 2033
- Figure 32: undefined Biomass Electric Power Generation Revenue (million), by Feedstock 2025 & 2033
- Figure 33: undefined Biomass Electric Power Generation Revenue Share (%), by Feedstock 2025 & 2033
- Figure 34: undefined Biomass Electric Power Generation Revenue (million), by Power Capacity 2025 & 2033
- Figure 35: undefined Biomass Electric Power Generation Revenue Share (%), by Power Capacity 2025 & 2033
- Figure 36: undefined Biomass Electric Power Generation Revenue (million), by Technology 2025 & 2033
- Figure 37: undefined Biomass Electric Power Generation Revenue Share (%), by Technology 2025 & 2033
- Figure 38: undefined Biomass Electric Power Generation Revenue (million), by End User 2025 & 2033
- Figure 39: undefined Biomass Electric Power Generation Revenue Share (%), by End User 2025 & 2033
- Figure 40: undefined Biomass Electric Power Generation Revenue (million), by Country 2025 & 2033
- Figure 41: undefined Biomass Electric Power Generation Revenue Share (%), by Country 2025 & 2033
- Figure 42: undefined Biomass Electric Power Generation Revenue (million), by Feedstock 2025 & 2033
- Figure 43: undefined Biomass Electric Power Generation Revenue Share (%), by Feedstock 2025 & 2033
- Figure 44: undefined Biomass Electric Power Generation Revenue (million), by Power Capacity 2025 & 2033
- Figure 45: undefined Biomass Electric Power Generation Revenue Share (%), by Power Capacity 2025 & 2033
- Figure 46: undefined Biomass Electric Power Generation Revenue (million), by Technology 2025 & 2033
- Figure 47: undefined Biomass Electric Power Generation Revenue Share (%), by Technology 2025 & 2033
- Figure 48: undefined Biomass Electric Power Generation Revenue (million), by End User 2025 & 2033
- Figure 49: undefined Biomass Electric Power Generation Revenue Share (%), by End User 2025 & 2033
- Figure 50: undefined Biomass Electric Power Generation Revenue (million), by Country 2025 & 2033
- Figure 51: undefined Biomass Electric Power Generation Revenue Share (%), by Country 2025 & 2033
List of Tables
- Table 1: Global Biomass Electric Power Generation Revenue million Forecast, by Feedstock 2020 & 2033
- Table 2: Global Biomass Electric Power Generation Revenue million Forecast, by Power Capacity 2020 & 2033
- Table 3: Global Biomass Electric Power Generation Revenue million Forecast, by Technology 2020 & 2033
- Table 4: Global Biomass Electric Power Generation Revenue million Forecast, by End User 2020 & 2033
- Table 5: Global Biomass Electric Power Generation Revenue million Forecast, by Region 2020 & 2033
- Table 6: Global Biomass Electric Power Generation Revenue million Forecast, by Feedstock 2020 & 2033
- Table 7: Global Biomass Electric Power Generation Revenue million Forecast, by Power Capacity 2020 & 2033
- Table 8: Global Biomass Electric Power Generation Revenue million Forecast, by Technology 2020 & 2033
- Table 9: Global Biomass Electric Power Generation Revenue million Forecast, by End User 2020 & 2033
- Table 10: Global Biomass Electric Power Generation Revenue million Forecast, by Country 2020 & 2033
- Table 11: Global Biomass Electric Power Generation Revenue million Forecast, by Feedstock 2020 & 2033
- Table 12: Global Biomass Electric Power Generation Revenue million Forecast, by Power Capacity 2020 & 2033
- Table 13: Global Biomass Electric Power Generation Revenue million Forecast, by Technology 2020 & 2033
- Table 14: Global Biomass Electric Power Generation Revenue million Forecast, by End User 2020 & 2033
- Table 15: Global Biomass Electric Power Generation Revenue million Forecast, by Country 2020 & 2033
- Table 16: Global Biomass Electric Power Generation Revenue million Forecast, by Feedstock 2020 & 2033
- Table 17: Global Biomass Electric Power Generation Revenue million Forecast, by Power Capacity 2020 & 2033
- Table 18: Global Biomass Electric Power Generation Revenue million Forecast, by Technology 2020 & 2033
- Table 19: Global Biomass Electric Power Generation Revenue million Forecast, by End User 2020 & 2033
- Table 20: Global Biomass Electric Power Generation Revenue million Forecast, by Country 2020 & 2033
- Table 21: Global Biomass Electric Power Generation Revenue million Forecast, by Feedstock 2020 & 2033
- Table 22: Global Biomass Electric Power Generation Revenue million Forecast, by Power Capacity 2020 & 2033
- Table 23: Global Biomass Electric Power Generation Revenue million Forecast, by Technology 2020 & 2033
- Table 24: Global Biomass Electric Power Generation Revenue million Forecast, by End User 2020 & 2033
- Table 25: Global Biomass Electric Power Generation Revenue million Forecast, by Country 2020 & 2033
- Table 26: Global Biomass Electric Power Generation Revenue million Forecast, by Feedstock 2020 & 2033
- Table 27: Global Biomass Electric Power Generation Revenue million Forecast, by Power Capacity 2020 & 2033
- Table 28: Global Biomass Electric Power Generation Revenue million Forecast, by Technology 2020 & 2033
- Table 29: Global Biomass Electric Power Generation Revenue million Forecast, by End User 2020 & 2033
- Table 30: Global Biomass Electric Power Generation Revenue million Forecast, by Country 2020 & 2033
Frequently Asked Questions
1. What is the projected Compound Annual Growth Rate (CAGR) of the Biomass Electric Power Generation?
The projected CAGR is approximately 3.4%.
2. Which companies are prominent players in the Biomass Electric Power Generation?
Key companies in the market include SUEZ Group , ENGIE, ACCIONA, EPH, Xcel Energy Inc., Ramboll Group A/S, EDF, Babcock & Wilcox Enterprises, Inc., Orsted A/S, Ameresco, Siemens Energy, Statkraft, General Electric, RWE, AXIS Tech, Veolia, Vattenfall, Infinite Energy Pvt. Ltd., Others.
3. What are the main segments of the Biomass Electric Power Generation?
The market segments include Feedstock, Power Capacity, Technology, End User.
4. Can you provide details about the market size?
The market size is estimated to be USD 59390 million as of 2022.
5. What are some drivers contributing to market growth?
N/A
6. What are the notable trends driving market growth?
N/A
7. Are there any restraints impacting market growth?
N/A
8. Can you provide examples of recent developments in the market?
N/A
9. What pricing options are available for accessing the report?
Pricing options include single-user, multi-user, and enterprise licenses priced at USD 3950.00, USD 5925.00, and USD 7900.00 respectively.
10. Is the market size provided in terms of value or volume?
The market size is provided in terms of value, measured in million.
11. Are there any specific market keywords associated with the report?
Yes, the market keyword associated with the report is "Biomass Electric Power Generation," which aids in identifying and referencing the specific market segment covered.
12. How do I determine which pricing option suits my needs best?
The pricing options vary based on user requirements and access needs. Individual users may opt for single-user licenses, while businesses requiring broader access may choose multi-user or enterprise licenses for cost-effective access to the report.
13. Are there any additional resources or data provided in the Biomass Electric Power Generation report?
While the report offers comprehensive insights, it's advisable to review the specific contents or supplementary materials provided to ascertain if additional resources or data are available.
14. How can I stay updated on further developments or reports in the Biomass Electric Power Generation?
To stay informed about further developments, trends, and reports in the Biomass Electric Power Generation, consider subscribing to industry newsletters, following relevant companies and organizations, or regularly checking reputable industry news sources and publications.
Methodology
Step 1 - Identification of Relevant Samples Size from Population Database


Step 2 - Approaches for Defining Global Market Size (Value, Volume* & Price*)

Note*: In applicable scenarios
Step 3 - Data Sources
Primary Research
- Web Analytics
- Survey Reports
- Research Institute
- Latest Research Reports
- Opinion Leaders
Secondary Research
- Annual Reports
- White Paper
- Latest Press Release
- Industry Association
- Paid Database
- Investor Presentations

Step 4 - Data Triangulation
Involves using different sources of information in order to increase the validity of a study
These sources are likely to be stakeholders in a program - participants, other researchers, program staff, other community members, and so on.
Then we put all data in single framework & apply various statistical tools to find out the dynamic on the market.
During the analysis stage, feedback from the stakeholder groups would be compared to determine areas of agreement as well as areas of divergence