

Key Insights
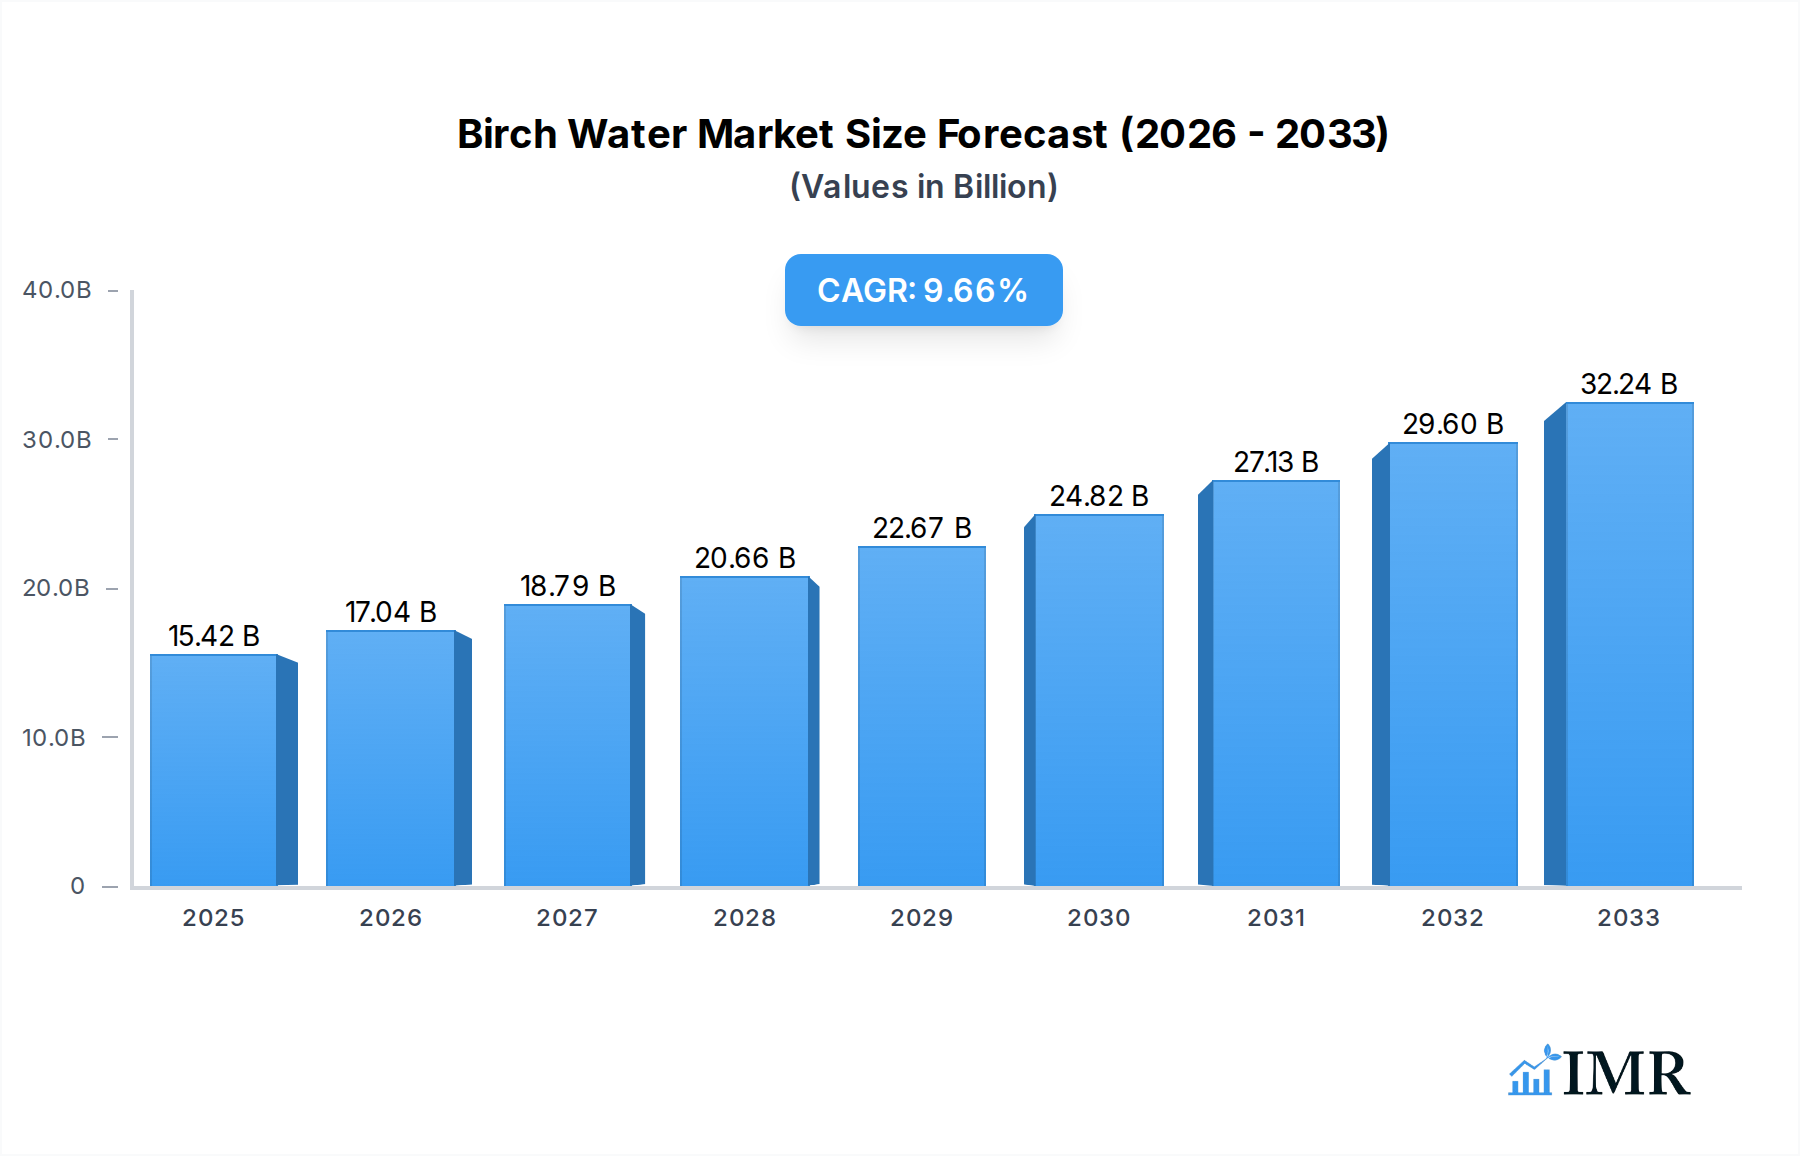
The global Birch Water market is poised for substantial expansion, projected to reach USD 6.84 billion in 2025, exhibiting a robust Compound Annual Growth Rate (CAGR) of 15.77% during the forecast period of 2025-2033. This impressive growth is primarily fueled by an increasing consumer awareness regarding the health and wellness benefits associated with birch water, including its hydrating properties, rich nutrient profile, and potential antioxidant effects. The growing demand for natural and low-calorie beverages, coupled with a rising preference for functional drinks, further propels the market forward. The Food and Beverages segment is expected to dominate the market, driven by its widespread adoption in various beverage formulations. The Pharmaceutical and Nutraceutical sectors are also witnessing significant traction due to the perceived therapeutic advantages and incorporation into health supplements.

Birch Water Market Size (In Billion)
The market's dynamism is further shaped by emerging trends such as the introduction of innovative flavor variants like Strawberry Flavor, Apple Ginger Flavor, and Bilberry Flavor, catering to evolving consumer palates. Companies like Sibberi, Sapp, and BelSeva are actively engaged in product development and strategic collaborations to enhance their market presence. While the market exhibits strong growth potential, certain factors could present challenges. High production costs associated with sourcing and processing birch sap, coupled with limited shelf life and logistical complexities in certain regions, may act as restraints. However, advancements in preservation techniques and expanding distribution networks are expected to mitigate these challenges. The Asia Pacific region is anticipated to emerge as a key growth engine, driven by a burgeoning health-conscious population and increasing disposable incomes.
Birch Water Company Market Share
Comprehensive Birch Water Market Report: Growth, Trends, and Opportunities (2019-2033)
This in-depth report provides a comprehensive analysis of the global Birch Water market, offering critical insights into its dynamics, growth trajectories, and future potential. Covering the historical period from 2019 to 2024, a base year of 2025, and a forecast period extending to 2033, this study is an indispensable resource for industry stakeholders seeking to navigate and capitalize on this rapidly evolving sector. We delve into market concentration, technological innovations, regulatory landscapes, competitive threats, consumer demographics, and M&A activities, alongside detailed analyses of growth trends, regional dominance, product innovations, key drivers, barriers, challenges, and emerging opportunities.
Birch Water Market Dynamics & Structure
The global Birch Water market is characterized by a moderately concentrated structure, with a few prominent players holding significant market share, particularly within the Food and Beverages and Nutraceutical segments. Technological innovation is a key driver, with ongoing advancements in extraction processes, product formulation, and flavor development enhancing product appeal and shelf-life. Regulatory frameworks, while still evolving, are increasingly focused on health claims, sourcing transparency, and sustainable practices, influencing product development and market access. Competitive product substitutes, including coconut water and other functional beverages, pose a constant challenge, necessitating continuous differentiation through unique value propositions and targeted marketing. End-user demographics reveal a growing interest among health-conscious millennials and Gen Z consumers, particularly in developed economies, seeking natural, low-calorie, and functional hydration alternatives. Mergers and acquisitions (M&A) trends indicate strategic consolidation as companies aim to expand their product portfolios, geographic reach, and production capacities. For instance, the market has witnessed strategic acquisitions of smaller, innovative brands by larger beverage conglomerates seeking to diversify their offerings and tap into the growing demand for plant-based beverages. The market is projected to reach a valuation of approximately $2.1 billion by 2025, with continued innovation and expanding consumer adoption driving its trajectory.
- Market Concentration: Moderately concentrated with key players in North America and Europe.
- Technological Innovation: Focus on improved extraction efficiency, novel flavor infusions (e.g., Bilberry, Rose Chip), and enhanced bioavailability of beneficial compounds.
- Regulatory Frameworks: Increasing emphasis on clean label certifications, natural ingredients, and adherence to regional food and beverage standards.
- Competitive Substitutes: Coconut water, mineral water, and other plant-based milks are key competitors.
- End-User Demographics: Young adults (18-35) and health-conscious individuals driving demand.
- M&A Trends: Strategic acquisitions to gain market share and expand product lines. Approximately 3-5 significant M&A deals are anticipated between 2024 and 2025.
Birch Water Growth Trends & Insights
The global Birch Water market is poised for significant expansion, driven by escalating consumer demand for natural, healthy, and functional beverages. The market size, estimated at approximately $1.8 billion in 2024, is projected to witness a compound annual growth rate (CAGR) of around 12.5% from 2025 to 2033, reaching an estimated value of over $4.5 billion by the end of the forecast period. This robust growth is fueled by increasing health awareness and a growing preference for plant-based alternatives to traditional sugary drinks. Adoption rates are accelerating, particularly in urban centers across North America, Europe, and select Asian markets, where consumers are more exposed to novel health trends and have higher disposable incomes. Technological disruptions, such as advancements in cold-pressing extraction techniques and aseptic packaging, are enhancing the quality, shelf-life, and accessibility of birch water, thereby contributing to its wider market penetration. Consumer behavior shifts are profoundly impacting the market, with a noticeable move towards functional ingredients and natural wellness products. Birch water's inherent benefits, including hydration, electrolytes, and antioxidants, are resonating strongly with this evolving consumer mindset. The rise of e-commerce and direct-to-consumer (DTC) sales channels has also facilitated greater access to birch water products, further boosting adoption. Emerging flavor profiles, such as Rose Chip and Bilberry, are appealing to a broader demographic, moving beyond the traditionally perceived niche market. The global market is expected to see its adoption rate increase from 15% in 2024 to an estimated 30% by 2033 in its target demographics. This surge in adoption is directly linked to increased investment in marketing and brand awareness campaigns by key industry players.
Dominant Regions, Countries, or Segments in Birch Water
North America currently stands as the dominant region in the global Birch Water market, driven by a well-established health and wellness culture, high disposable incomes, and a significant consumer base actively seeking natural and functional beverages. The United States, in particular, leads market growth due to its robust retail infrastructure, extensive distribution networks, and a strong presence of health-conscious consumers. The Food and Beverages application segment is the primary revenue generator within the birch water market. This dominance is attributed to birch water's versatility as a direct beverage, a mixer, and an ingredient in various food products. Its natural sweetness and hydrating properties make it an attractive alternative to sugary drinks and a popular choice for smoothies, juices, and functional water formulations. The Strawberry Flavor segment also exhibits substantial traction, appealing to a broad consumer base with its familiar and pleasant taste profile, contributing significantly to market share within the flavored birch water category.
- Leading Region: North America, with an estimated 40% market share in 2025, followed by Europe.
- Dominant Country: United States, accounting for over 30% of the global market value.
- Dominant Application Segment: Food and Beverages, projected to hold approximately 55% of the market revenue by 2025.
- Key Drivers in North America:
- High consumer awareness of health and wellness trends.
- Strong demand for natural and plant-based products.
- Extensive distribution channels and retail availability.
- Significant marketing and promotional activities by key players.
- Growth Potential in Europe: Rising demand for natural beverages and increasing penetration in key markets like Germany, the UK, and Scandinavia.
- Emerging Markets: Asia-Pacific, particularly China and South Korea, showing promising growth due to increasing health consciousness and adoption of global beverage trends.
Birch Water Product Landscape
The birch water product landscape is rapidly diversifying, driven by innovation and a focus on enhancing consumer appeal and functional benefits. Companies are introducing a wider array of flavored birch waters, including popular options like Strawberry Flavor, Apple Ginger Flavor, Bilberry Flavor, and Rose Chip Flavor, alongside a growing segment of "Others" encompassing unique and exotic infusions. These product innovations cater to diverse taste preferences and target specific health benefits, such as enhanced antioxidant content from bilberry or a soothing effect from rose. Beyond flavors, advancements in packaging technology, including sustainable and eco-friendly options, are also shaping the product landscape. Performance metrics highlight increased shelf-stability and improved taste profiles compared to earlier iterations.
Key Drivers, Barriers & Challenges in Birch Water
Key Drivers:
- Growing Health and Wellness Trend: Increasing consumer focus on natural, low-calorie, and functional beverages.
- Plant-Based Beverage Popularity: Rising demand for dairy-free and plant-derived alternatives.
- Hydration and Electrolyte Benefits: Birch water's natural hydration properties and mineral content are highly appealing.
- Technological Advancements: Improved extraction, processing, and flavor infusion techniques.
- Growing Availability: Expansion of distribution channels, including online and specialty stores.
Barriers & Challenges:
- Seasonality of Sourcing: Birch sap collection is seasonal, potentially impacting supply chain stability and cost.
- Limited Consumer Awareness: Compared to established beverages like coconut water, birch water still faces a significant awareness gap in some markets.
- Higher Production Costs: The intricate process of sap collection and purification can lead to higher production costs, translating to higher retail prices.
- Competition from Established Brands: Intense competition from well-entrenched players in the beverage market.
- Regulatory Hurdles: Navigating diverse food and beverage regulations across different countries can be complex. The market is projected to encounter supply chain challenges leading to a potential 5-7% increase in raw material costs between 2025 and 2027.
Emerging Opportunities in Birch Water
Emerging opportunities in the birch water market lie in tapping into the Pharmaceutical and Nutraceutical segments, where its perceived health benefits can be leveraged for specialized products. The development of birch water-based supplements, functional foods, and even cosmetic applications (e.g., in skincare for its hydrating and antioxidant properties) presents significant growth avenues. Untapped geographical markets, particularly in developing economies with rising middle classes and increasing health consciousness, offer substantial expansion potential. Furthermore, exploring innovative, functional flavor combinations that target specific health outcomes, such as stress relief or enhanced immunity, could attract a wider consumer base. The Cosmetics and Personal Care segment, although nascent, is showing promise for birch water's natural moisturizing and antioxidant properties.
Growth Accelerators in the Birch Water Industry
Growth accelerators for the birch water industry are multifaceted, encompassing technological breakthroughs in sustainable harvesting and processing to reduce costs and increase yields. Strategic partnerships between birch water producers and established beverage conglomerates or health food retailers can significantly expand market reach and brand visibility. Market expansion strategies, particularly focusing on direct-to-consumer (DTC) models and e-commerce platforms, will further fuel growth by providing wider accessibility to consumers. The increasing consumer willingness to pay a premium for natural and functional health products is a powerful accelerator. The report predicts that investments in R&D for novel applications within the Pharmaceutical and Nutraceutical sectors will accelerate market growth by an estimated 10% over the forecast period.
Key Players Shaping the Birch Water Market
- Sibberi
- Sapp
- BelSeva
- TreeVitalise
- Treo Brands
Notable Milestones in Birch Water Sector
- 2019: Increased investment in R&D for novel flavor profiles, leading to the launch of Bilberry and Rose Chip flavors.
- 2020: Sibberi secures significant funding for capacity expansion and global distribution.
- 2021: Sapp introduces sustainable packaging solutions, enhancing its environmental credentials.
- 2022: BelSeva expands its product line to include birch water-based functional shots.
- 2023: TreeVitalise enters the North American market with a focus on the nutraceutical segment.
- 2024: Several smaller brands are acquired by larger beverage companies to capitalize on market growth.
- 2025 (Estimated): Anticipated launch of birch water products specifically formulated for pharmaceutical applications.
In-Depth Birch Water Market Outlook
The future outlook for the birch water market remains exceptionally promising, fueled by its inherent health benefits and alignment with evolving consumer preferences for natural and functional products. Growth accelerators, including technological advancements in sourcing and processing, strategic market expansion, and increasing consumer acceptance of premium health beverages, will continue to propel the industry forward. The burgeoning Nutraceutical and Pharmaceutical applications represent significant untapped potential, offering avenues for specialized product development and premium pricing. As global health consciousness rises, birch water is well-positioned to capture a larger share of the functional beverage market, projecting sustained and robust growth through the forecast period.
Birch Water Segmentation
-
1. Application
- 1.1. Food and Beverages
- 1.2. Pharmaceutical
- 1.3. Nutraceutical
- 1.4. Cosmetics and Personal Care
-
2. Type
- 2.1. Strawberry Flavor
- 2.2. Apple Ginger Flavor
- 2.3. Bilberry Flavor
- 2.4. Rose Chip Flavor
- 2.5. Others
Birch Water Segmentation By Geography
-
1. North America
- 1.1. United States
- 1.2. Canada
- 1.3. Mexico
-
2. South America
- 2.1. Brazil
- 2.2. Argentina
- 2.3. Rest of South America
-
3. Europe
- 3.1. United Kingdom
- 3.2. Germany
- 3.3. France
- 3.4. Italy
- 3.5. Spain
- 3.6. Russia
- 3.7. Benelux
- 3.8. Nordics
- 3.9. Rest of Europe
-
4. Middle East & Africa
- 4.1. Turkey
- 4.2. Israel
- 4.3. GCC
- 4.4. North Africa
- 4.5. South Africa
- 4.6. Rest of Middle East & Africa
-
5. Asia Pacific
- 5.1. China
- 5.2. India
- 5.3. Japan
- 5.4. South Korea
- 5.5. ASEAN
- 5.6. Oceania
- 5.7. Rest of Asia Pacific
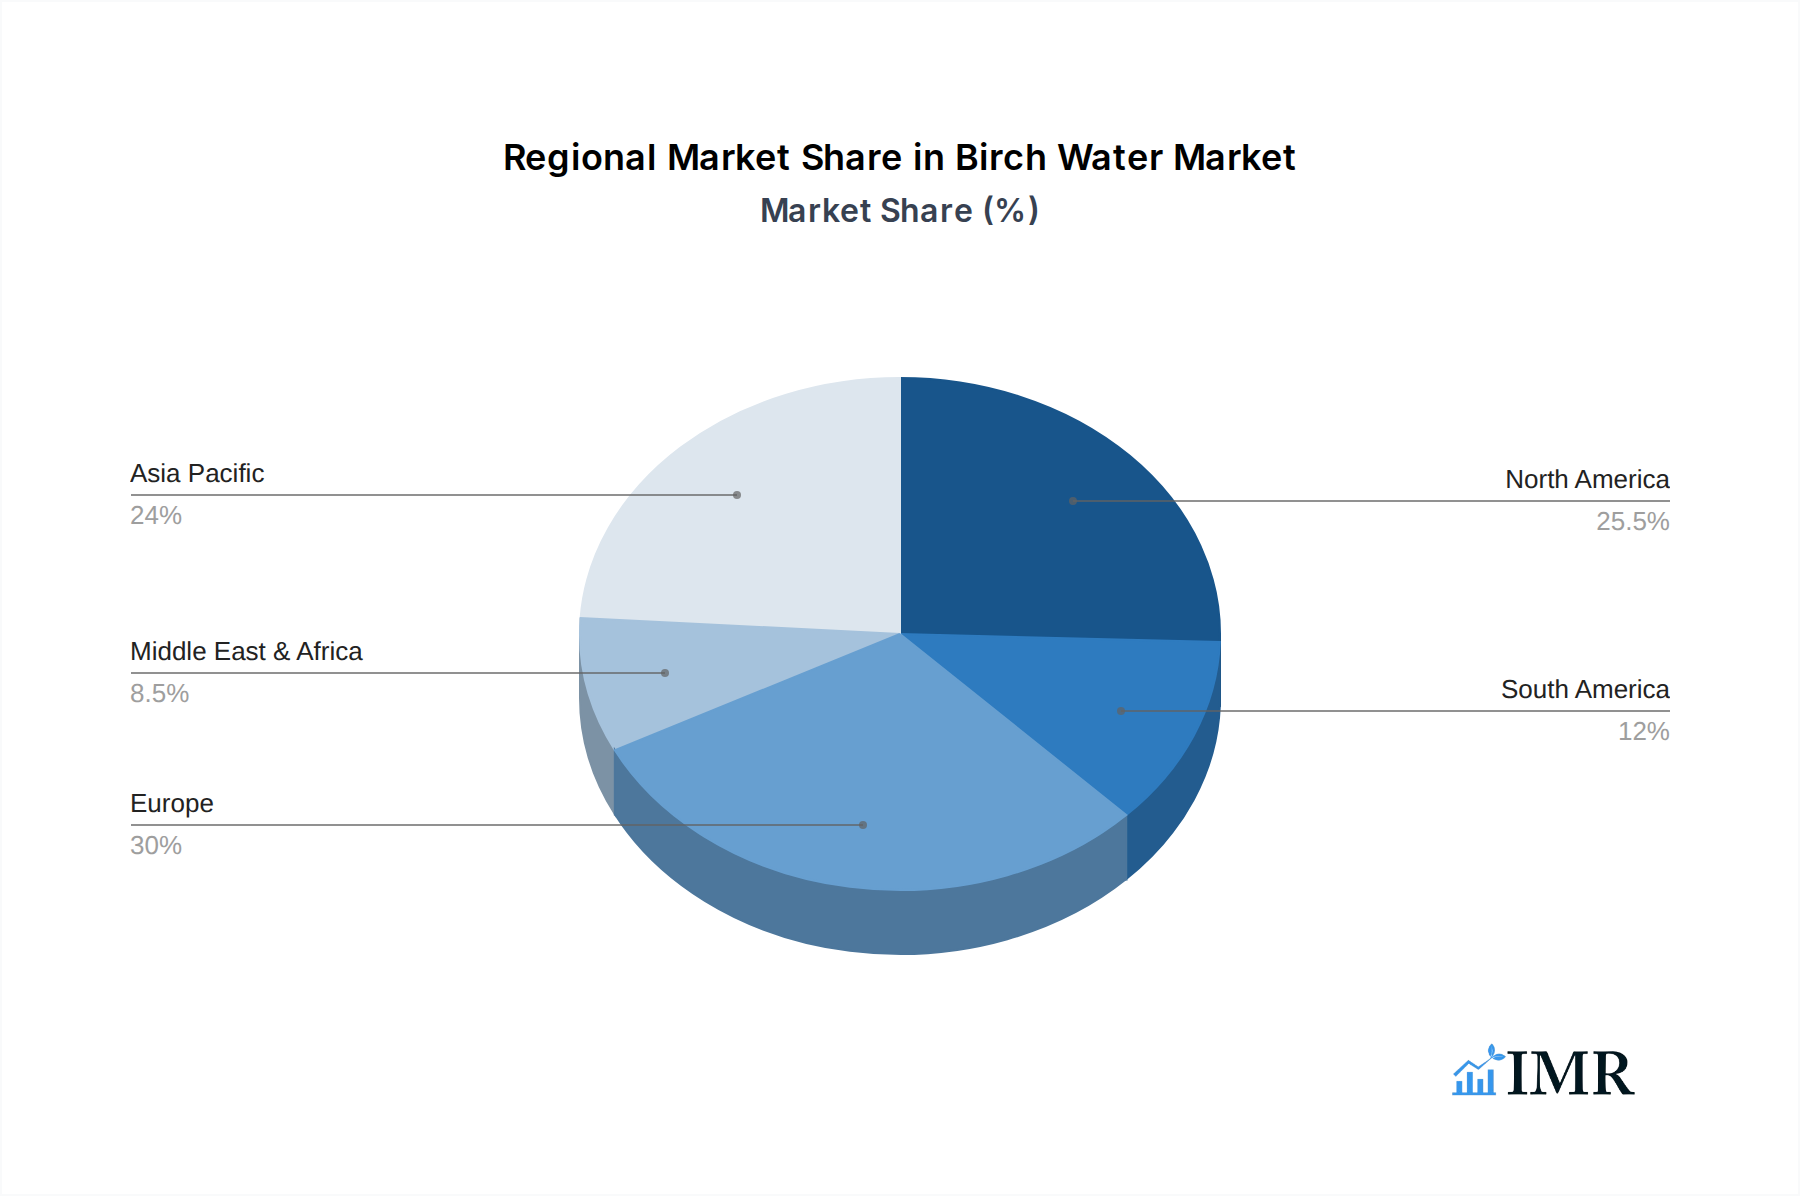
Birch Water Regional Market Share
Geographic Coverage of Birch Water
Birch Water REPORT HIGHLIGHTS
| Aspects | Details |
|---|---|
| Study Period | 2020-2034 |
| Base Year | 2025 |
| Estimated Year | 2026 |
| Forecast Period | 2026-2034 |
| Historical Period | 2020-2025 |
| Growth Rate | CAGR of 9.8% from 2020-2034 |
| Segmentation |
|
Table of Contents
- 1. Introduction
- 1.1. Research Scope
- 1.2. Market Segmentation
- 1.3. Research Objective
- 1.4. Definitions and Assumptions
- 2. Executive Summary
- 2.1. Market Snapshot
- 3. Market Dynamics
- 3.1. Market Drivers
- 3.2. Market Restrains
- 3.3. Market Trends
- 3.4. Market Opportunities
- 4. Market Factor Analysis
- 4.1. Porters Five Forces
- 4.1.1. Bargaining Power of Suppliers
- 4.1.2. Bargaining Power of Buyers
- 4.1.3. Threat of New Entrants
- 4.1.4. Threat of Substitutes
- 4.1.5. Competitive Rivalry
- 4.2. PESTEL analysis
- 4.3. BCG Analysis
- 4.3.1. Stars (High Growth, High Market Share)
- 4.3.2. Cash Cows (Low Growth, High Market Share)
- 4.3.3. Question Mark (High Growth, Low Market Share)
- 4.3.4. Dogs (Low Growth, Low Market Share)
- 4.4. Ansoff Matrix Analysis
- 4.5. Supply Chain Analysis
- 4.6. Regulatory Landscape
- 4.7. Current Market Potential and Opportunity Assessment (TAM–SAM–SOM Framework)
- 4.8. IMR Analyst Note
- 4.1. Porters Five Forces
- 5. Market Analysis, Insights and Forecast 2021-2033
- 5.1. Market Analysis, Insights and Forecast - by Application
- 5.1.1. Food and Beverages
- 5.1.2. Pharmaceutical
- 5.1.3. Nutraceutical
- 5.1.4. Cosmetics and Personal Care
- 5.2. Market Analysis, Insights and Forecast - by Type
- 5.2.1. Strawberry Flavor
- 5.2.2. Apple Ginger Flavor
- 5.2.3. Bilberry Flavor
- 5.2.4. Rose Chip Flavor
- 5.2.5. Others
- 5.3. Market Analysis, Insights and Forecast - by Region
- 5.3.1. North America
- 5.3.2. South America
- 5.3.3. Europe
- 5.3.4. Middle East & Africa
- 5.3.5. Asia Pacific
- 5.1. Market Analysis, Insights and Forecast - by Application
- 6. Global Birch Water Analysis, Insights and Forecast, 2021-2033
- 6.1. Market Analysis, Insights and Forecast - by Application
- 6.1.1. Food and Beverages
- 6.1.2. Pharmaceutical
- 6.1.3. Nutraceutical
- 6.1.4. Cosmetics and Personal Care
- 6.2. Market Analysis, Insights and Forecast - by Type
- 6.2.1. Strawberry Flavor
- 6.2.2. Apple Ginger Flavor
- 6.2.3. Bilberry Flavor
- 6.2.4. Rose Chip Flavor
- 6.2.5. Others
- 6.1. Market Analysis, Insights and Forecast - by Application
- 7. North America Birch Water Analysis, Insights and Forecast, 2020-2032
- 7.1. Market Analysis, Insights and Forecast - by Application
- 7.1.1. Food and Beverages
- 7.1.2. Pharmaceutical
- 7.1.3. Nutraceutical
- 7.1.4. Cosmetics and Personal Care
- 7.2. Market Analysis, Insights and Forecast - by Type
- 7.2.1. Strawberry Flavor
- 7.2.2. Apple Ginger Flavor
- 7.2.3. Bilberry Flavor
- 7.2.4. Rose Chip Flavor
- 7.2.5. Others
- 7.1. Market Analysis, Insights and Forecast - by Application
- 8. South America Birch Water Analysis, Insights and Forecast, 2020-2032
- 8.1. Market Analysis, Insights and Forecast - by Application
- 8.1.1. Food and Beverages
- 8.1.2. Pharmaceutical
- 8.1.3. Nutraceutical
- 8.1.4. Cosmetics and Personal Care
- 8.2. Market Analysis, Insights and Forecast - by Type
- 8.2.1. Strawberry Flavor
- 8.2.2. Apple Ginger Flavor
- 8.2.3. Bilberry Flavor
- 8.2.4. Rose Chip Flavor
- 8.2.5. Others
- 8.1. Market Analysis, Insights and Forecast - by Application
- 9. Europe Birch Water Analysis, Insights and Forecast, 2020-2032
- 9.1. Market Analysis, Insights and Forecast - by Application
- 9.1.1. Food and Beverages
- 9.1.2. Pharmaceutical
- 9.1.3. Nutraceutical
- 9.1.4. Cosmetics and Personal Care
- 9.2. Market Analysis, Insights and Forecast - by Type
- 9.2.1. Strawberry Flavor
- 9.2.2. Apple Ginger Flavor
- 9.2.3. Bilberry Flavor
- 9.2.4. Rose Chip Flavor
- 9.2.5. Others
- 9.1. Market Analysis, Insights and Forecast - by Application
- 10. Middle East & Africa Birch Water Analysis, Insights and Forecast, 2020-2032
- 10.1. Market Analysis, Insights and Forecast - by Application
- 10.1.1. Food and Beverages
- 10.1.2. Pharmaceutical
- 10.1.3. Nutraceutical
- 10.1.4. Cosmetics and Personal Care
- 10.2. Market Analysis, Insights and Forecast - by Type
- 10.2.1. Strawberry Flavor
- 10.2.2. Apple Ginger Flavor
- 10.2.3. Bilberry Flavor
- 10.2.4. Rose Chip Flavor
- 10.2.5. Others
- 10.1. Market Analysis, Insights and Forecast - by Application
- 11. Asia Pacific Birch Water Analysis, Insights and Forecast, 2020-2032
- 11.1. Market Analysis, Insights and Forecast - by Application
- 11.1.1. Food and Beverages
- 11.1.2. Pharmaceutical
- 11.1.3. Nutraceutical
- 11.1.4. Cosmetics and Personal Care
- 11.2. Market Analysis, Insights and Forecast - by Type
- 11.2.1. Strawberry Flavor
- 11.2.2. Apple Ginger Flavor
- 11.2.3. Bilberry Flavor
- 11.2.4. Rose Chip Flavor
- 11.2.5. Others
- 11.1. Market Analysis, Insights and Forecast - by Application
- 12. Competitive Analysis
- 12.1. Company Profiles
- 12.1.1 Sibberi
- 12.1.1.1. Company Overview
- 12.1.1.2. Products
- 12.1.1.3. Company Financials
- 12.1.1.4. SWOT Analysis
- 12.1.2 Sapp
- 12.1.2.1. Company Overview
- 12.1.2.2. Products
- 12.1.2.3. Company Financials
- 12.1.2.4. SWOT Analysis
- 12.1.3 BelSeva
- 12.1.3.1. Company Overview
- 12.1.3.2. Products
- 12.1.3.3. Company Financials
- 12.1.3.4. SWOT Analysis
- 12.1.4 TreeVitalise
- 12.1.4.1. Company Overview
- 12.1.4.2. Products
- 12.1.4.3. Company Financials
- 12.1.4.4. SWOT Analysis
- 12.1.5 Treo Brands
- 12.1.5.1. Company Overview
- 12.1.5.2. Products
- 12.1.5.3. Company Financials
- 12.1.5.4. SWOT Analysis
- 12.1.1 Sibberi
- 12.2. Market Entropy
- 12.2.1 Company's Key Areas Served
- 12.2.2 Recent Developments
- 12.3. Company Market Share Analysis 2025
- 12.3.1 Top 5 Companies Market Share Analysis
- 12.3.2 Top 3 Companies Market Share Analysis
- 12.4. List of Potential Customers
- 13. Research Methodology
List of Figures
- Figure 1: Global Birch Water Revenue Breakdown (undefined, %) by Region 2025 & 2033
- Figure 2: Global Birch Water Volume Breakdown (K, %) by Region 2025 & 2033
- Figure 3: North America Birch Water Revenue (undefined), by Application 2025 & 2033
- Figure 4: North America Birch Water Volume (K), by Application 2025 & 2033
- Figure 5: North America Birch Water Revenue Share (%), by Application 2025 & 2033
- Figure 6: North America Birch Water Volume Share (%), by Application 2025 & 2033
- Figure 7: North America Birch Water Revenue (undefined), by Type 2025 & 2033
- Figure 8: North America Birch Water Volume (K), by Type 2025 & 2033
- Figure 9: North America Birch Water Revenue Share (%), by Type 2025 & 2033
- Figure 10: North America Birch Water Volume Share (%), by Type 2025 & 2033
- Figure 11: North America Birch Water Revenue (undefined), by Country 2025 & 2033
- Figure 12: North America Birch Water Volume (K), by Country 2025 & 2033
- Figure 13: North America Birch Water Revenue Share (%), by Country 2025 & 2033
- Figure 14: North America Birch Water Volume Share (%), by Country 2025 & 2033
- Figure 15: South America Birch Water Revenue (undefined), by Application 2025 & 2033
- Figure 16: South America Birch Water Volume (K), by Application 2025 & 2033
- Figure 17: South America Birch Water Revenue Share (%), by Application 2025 & 2033
- Figure 18: South America Birch Water Volume Share (%), by Application 2025 & 2033
- Figure 19: South America Birch Water Revenue (undefined), by Type 2025 & 2033
- Figure 20: South America Birch Water Volume (K), by Type 2025 & 2033
- Figure 21: South America Birch Water Revenue Share (%), by Type 2025 & 2033
- Figure 22: South America Birch Water Volume Share (%), by Type 2025 & 2033
- Figure 23: South America Birch Water Revenue (undefined), by Country 2025 & 2033
- Figure 24: South America Birch Water Volume (K), by Country 2025 & 2033
- Figure 25: South America Birch Water Revenue Share (%), by Country 2025 & 2033
- Figure 26: South America Birch Water Volume Share (%), by Country 2025 & 2033
- Figure 27: Europe Birch Water Revenue (undefined), by Application 2025 & 2033
- Figure 28: Europe Birch Water Volume (K), by Application 2025 & 2033
- Figure 29: Europe Birch Water Revenue Share (%), by Application 2025 & 2033
- Figure 30: Europe Birch Water Volume Share (%), by Application 2025 & 2033
- Figure 31: Europe Birch Water Revenue (undefined), by Type 2025 & 2033
- Figure 32: Europe Birch Water Volume (K), by Type 2025 & 2033
- Figure 33: Europe Birch Water Revenue Share (%), by Type 2025 & 2033
- Figure 34: Europe Birch Water Volume Share (%), by Type 2025 & 2033
- Figure 35: Europe Birch Water Revenue (undefined), by Country 2025 & 2033
- Figure 36: Europe Birch Water Volume (K), by Country 2025 & 2033
- Figure 37: Europe Birch Water Revenue Share (%), by Country 2025 & 2033
- Figure 38: Europe Birch Water Volume Share (%), by Country 2025 & 2033
- Figure 39: Middle East & Africa Birch Water Revenue (undefined), by Application 2025 & 2033
- Figure 40: Middle East & Africa Birch Water Volume (K), by Application 2025 & 2033
- Figure 41: Middle East & Africa Birch Water Revenue Share (%), by Application 2025 & 2033
- Figure 42: Middle East & Africa Birch Water Volume Share (%), by Application 2025 & 2033
- Figure 43: Middle East & Africa Birch Water Revenue (undefined), by Type 2025 & 2033
- Figure 44: Middle East & Africa Birch Water Volume (K), by Type 2025 & 2033
- Figure 45: Middle East & Africa Birch Water Revenue Share (%), by Type 2025 & 2033
- Figure 46: Middle East & Africa Birch Water Volume Share (%), by Type 2025 & 2033
- Figure 47: Middle East & Africa Birch Water Revenue (undefined), by Country 2025 & 2033
- Figure 48: Middle East & Africa Birch Water Volume (K), by Country 2025 & 2033
- Figure 49: Middle East & Africa Birch Water Revenue Share (%), by Country 2025 & 2033
- Figure 50: Middle East & Africa Birch Water Volume Share (%), by Country 2025 & 2033
- Figure 51: Asia Pacific Birch Water Revenue (undefined), by Application 2025 & 2033
- Figure 52: Asia Pacific Birch Water Volume (K), by Application 2025 & 2033
- Figure 53: Asia Pacific Birch Water Revenue Share (%), by Application 2025 & 2033
- Figure 54: Asia Pacific Birch Water Volume Share (%), by Application 2025 & 2033
- Figure 55: Asia Pacific Birch Water Revenue (undefined), by Type 2025 & 2033
- Figure 56: Asia Pacific Birch Water Volume (K), by Type 2025 & 2033
- Figure 57: Asia Pacific Birch Water Revenue Share (%), by Type 2025 & 2033
- Figure 58: Asia Pacific Birch Water Volume Share (%), by Type 2025 & 2033
- Figure 59: Asia Pacific Birch Water Revenue (undefined), by Country 2025 & 2033
- Figure 60: Asia Pacific Birch Water Volume (K), by Country 2025 & 2033
- Figure 61: Asia Pacific Birch Water Revenue Share (%), by Country 2025 & 2033
- Figure 62: Asia Pacific Birch Water Volume Share (%), by Country 2025 & 2033
List of Tables
- Table 1: Global Birch Water Revenue undefined Forecast, by Application 2020 & 2033
- Table 2: Global Birch Water Volume K Forecast, by Application 2020 & 2033
- Table 3: Global Birch Water Revenue undefined Forecast, by Type 2020 & 2033
- Table 4: Global Birch Water Volume K Forecast, by Type 2020 & 2033
- Table 5: Global Birch Water Revenue undefined Forecast, by Region 2020 & 2033
- Table 6: Global Birch Water Volume K Forecast, by Region 2020 & 2033
- Table 7: Global Birch Water Revenue undefined Forecast, by Application 2020 & 2033
- Table 8: Global Birch Water Volume K Forecast, by Application 2020 & 2033
- Table 9: Global Birch Water Revenue undefined Forecast, by Type 2020 & 2033
- Table 10: Global Birch Water Volume K Forecast, by Type 2020 & 2033
- Table 11: Global Birch Water Revenue undefined Forecast, by Country 2020 & 2033
- Table 12: Global Birch Water Volume K Forecast, by Country 2020 & 2033
- Table 13: United States Birch Water Revenue (undefined) Forecast, by Application 2020 & 2033
- Table 14: United States Birch Water Volume (K) Forecast, by Application 2020 & 2033
- Table 15: Canada Birch Water Revenue (undefined) Forecast, by Application 2020 & 2033
- Table 16: Canada Birch Water Volume (K) Forecast, by Application 2020 & 2033
- Table 17: Mexico Birch Water Revenue (undefined) Forecast, by Application 2020 & 2033
- Table 18: Mexico Birch Water Volume (K) Forecast, by Application 2020 & 2033
- Table 19: Global Birch Water Revenue undefined Forecast, by Application 2020 & 2033
- Table 20: Global Birch Water Volume K Forecast, by Application 2020 & 2033
- Table 21: Global Birch Water Revenue undefined Forecast, by Type 2020 & 2033
- Table 22: Global Birch Water Volume K Forecast, by Type 2020 & 2033
- Table 23: Global Birch Water Revenue undefined Forecast, by Country 2020 & 2033
- Table 24: Global Birch Water Volume K Forecast, by Country 2020 & 2033
- Table 25: Brazil Birch Water Revenue (undefined) Forecast, by Application 2020 & 2033
- Table 26: Brazil Birch Water Volume (K) Forecast, by Application 2020 & 2033
- Table 27: Argentina Birch Water Revenue (undefined) Forecast, by Application 2020 & 2033
- Table 28: Argentina Birch Water Volume (K) Forecast, by Application 2020 & 2033
- Table 29: Rest of South America Birch Water Revenue (undefined) Forecast, by Application 2020 & 2033
- Table 30: Rest of South America Birch Water Volume (K) Forecast, by Application 2020 & 2033
- Table 31: Global Birch Water Revenue undefined Forecast, by Application 2020 & 2033
- Table 32: Global Birch Water Volume K Forecast, by Application 2020 & 2033
- Table 33: Global Birch Water Revenue undefined Forecast, by Type 2020 & 2033
- Table 34: Global Birch Water Volume K Forecast, by Type 2020 & 2033
- Table 35: Global Birch Water Revenue undefined Forecast, by Country 2020 & 2033
- Table 36: Global Birch Water Volume K Forecast, by Country 2020 & 2033
- Table 37: United Kingdom Birch Water Revenue (undefined) Forecast, by Application 2020 & 2033
- Table 38: United Kingdom Birch Water Volume (K) Forecast, by Application 2020 & 2033
- Table 39: Germany Birch Water Revenue (undefined) Forecast, by Application 2020 & 2033
- Table 40: Germany Birch Water Volume (K) Forecast, by Application 2020 & 2033
- Table 41: France Birch Water Revenue (undefined) Forecast, by Application 2020 & 2033
- Table 42: France Birch Water Volume (K) Forecast, by Application 2020 & 2033
- Table 43: Italy Birch Water Revenue (undefined) Forecast, by Application 2020 & 2033
- Table 44: Italy Birch Water Volume (K) Forecast, by Application 2020 & 2033
- Table 45: Spain Birch Water Revenue (undefined) Forecast, by Application 2020 & 2033
- Table 46: Spain Birch Water Volume (K) Forecast, by Application 2020 & 2033
- Table 47: Russia Birch Water Revenue (undefined) Forecast, by Application 2020 & 2033
- Table 48: Russia Birch Water Volume (K) Forecast, by Application 2020 & 2033
- Table 49: Benelux Birch Water Revenue (undefined) Forecast, by Application 2020 & 2033
- Table 50: Benelux Birch Water Volume (K) Forecast, by Application 2020 & 2033
- Table 51: Nordics Birch Water Revenue (undefined) Forecast, by Application 2020 & 2033
- Table 52: Nordics Birch Water Volume (K) Forecast, by Application 2020 & 2033
- Table 53: Rest of Europe Birch Water Revenue (undefined) Forecast, by Application 2020 & 2033
- Table 54: Rest of Europe Birch Water Volume (K) Forecast, by Application 2020 & 2033
- Table 55: Global Birch Water Revenue undefined Forecast, by Application 2020 & 2033
- Table 56: Global Birch Water Volume K Forecast, by Application 2020 & 2033
- Table 57: Global Birch Water Revenue undefined Forecast, by Type 2020 & 2033
- Table 58: Global Birch Water Volume K Forecast, by Type 2020 & 2033
- Table 59: Global Birch Water Revenue undefined Forecast, by Country 2020 & 2033
- Table 60: Global Birch Water Volume K Forecast, by Country 2020 & 2033
- Table 61: Turkey Birch Water Revenue (undefined) Forecast, by Application 2020 & 2033
- Table 62: Turkey Birch Water Volume (K) Forecast, by Application 2020 & 2033
- Table 63: Israel Birch Water Revenue (undefined) Forecast, by Application 2020 & 2033
- Table 64: Israel Birch Water Volume (K) Forecast, by Application 2020 & 2033
- Table 65: GCC Birch Water Revenue (undefined) Forecast, by Application 2020 & 2033
- Table 66: GCC Birch Water Volume (K) Forecast, by Application 2020 & 2033
- Table 67: North Africa Birch Water Revenue (undefined) Forecast, by Application 2020 & 2033
- Table 68: North Africa Birch Water Volume (K) Forecast, by Application 2020 & 2033
- Table 69: South Africa Birch Water Revenue (undefined) Forecast, by Application 2020 & 2033
- Table 70: South Africa Birch Water Volume (K) Forecast, by Application 2020 & 2033
- Table 71: Rest of Middle East & Africa Birch Water Revenue (undefined) Forecast, by Application 2020 & 2033
- Table 72: Rest of Middle East & Africa Birch Water Volume (K) Forecast, by Application 2020 & 2033
- Table 73: Global Birch Water Revenue undefined Forecast, by Application 2020 & 2033
- Table 74: Global Birch Water Volume K Forecast, by Application 2020 & 2033
- Table 75: Global Birch Water Revenue undefined Forecast, by Type 2020 & 2033
- Table 76: Global Birch Water Volume K Forecast, by Type 2020 & 2033
- Table 77: Global Birch Water Revenue undefined Forecast, by Country 2020 & 2033
- Table 78: Global Birch Water Volume K Forecast, by Country 2020 & 2033
- Table 79: China Birch Water Revenue (undefined) Forecast, by Application 2020 & 2033
- Table 80: China Birch Water Volume (K) Forecast, by Application 2020 & 2033
- Table 81: India Birch Water Revenue (undefined) Forecast, by Application 2020 & 2033
- Table 82: India Birch Water Volume (K) Forecast, by Application 2020 & 2033
- Table 83: Japan Birch Water Revenue (undefined) Forecast, by Application 2020 & 2033
- Table 84: Japan Birch Water Volume (K) Forecast, by Application 2020 & 2033
- Table 85: South Korea Birch Water Revenue (undefined) Forecast, by Application 2020 & 2033
- Table 86: South Korea Birch Water Volume (K) Forecast, by Application 2020 & 2033
- Table 87: ASEAN Birch Water Revenue (undefined) Forecast, by Application 2020 & 2033
- Table 88: ASEAN Birch Water Volume (K) Forecast, by Application 2020 & 2033
- Table 89: Oceania Birch Water Revenue (undefined) Forecast, by Application 2020 & 2033
- Table 90: Oceania Birch Water Volume (K) Forecast, by Application 2020 & 2033
- Table 91: Rest of Asia Pacific Birch Water Revenue (undefined) Forecast, by Application 2020 & 2033
- Table 92: Rest of Asia Pacific Birch Water Volume (K) Forecast, by Application 2020 & 2033
Frequently Asked Questions
1. What is the projected Compound Annual Growth Rate (CAGR) of the Birch Water?
The projected CAGR is approximately 9.8%.
2. Which companies are prominent players in the Birch Water?
Key companies in the market include Sibberi, Sapp, BelSeva, TreeVitalise, Treo Brands.
3. What are the main segments of the Birch Water?
The market segments include Application, Type.
4. Can you provide details about the market size?
The market size is estimated to be USD XXX N/A as of 2022.
5. What are some drivers contributing to market growth?
N/A
6. What are the notable trends driving market growth?
N/A
7. Are there any restraints impacting market growth?
N/A
8. Can you provide examples of recent developments in the market?
N/A
9. What pricing options are available for accessing the report?
Pricing options include single-user, multi-user, and enterprise licenses priced at USD 3950.00, USD 5925.00, and USD 7900.00 respectively.
10. Is the market size provided in terms of value or volume?
The market size is provided in terms of value, measured in N/A and volume, measured in K.
11. Are there any specific market keywords associated with the report?
Yes, the market keyword associated with the report is "Birch Water," which aids in identifying and referencing the specific market segment covered.
12. How do I determine which pricing option suits my needs best?
The pricing options vary based on user requirements and access needs. Individual users may opt for single-user licenses, while businesses requiring broader access may choose multi-user or enterprise licenses for cost-effective access to the report.
13. Are there any additional resources or data provided in the Birch Water report?
While the report offers comprehensive insights, it's advisable to review the specific contents or supplementary materials provided to ascertain if additional resources or data are available.
14. How can I stay updated on further developments or reports in the Birch Water?
To stay informed about further developments, trends, and reports in the Birch Water, consider subscribing to industry newsletters, following relevant companies and organizations, or regularly checking reputable industry news sources and publications.
Methodology
Step 1 - Identification of Relevant Samples Size from Population Database


Step 2 - Approaches for Defining Global Market Size (Value, Volume* & Price*)

Note*: In applicable scenarios
Step 3 - Data Sources
Primary Research
- Web Analytics
- Survey Reports
- Research Institute
- Latest Research Reports
- Opinion Leaders
Secondary Research
- Annual Reports
- White Paper
- Latest Press Release
- Industry Association
- Paid Database
- Investor Presentations

Step 4 - Data Triangulation
Involves using different sources of information in order to increase the validity of a study
These sources are likely to be stakeholders in a program - participants, other researchers, program staff, other community members, and so on.
Then we put all data in single framework & apply various statistical tools to find out the dynamic on the market.
During the analysis stage, feedback from the stakeholder groups would be compared to determine areas of agreement as well as areas of divergence