

Key Insights
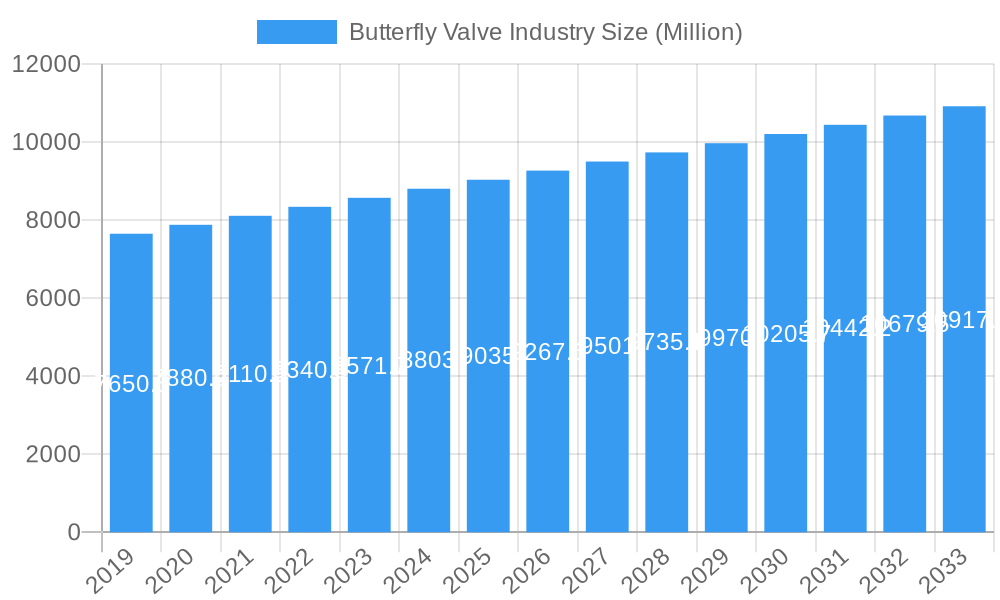
The global butterfly valve market is projected for substantial growth, estimated to reach USD 11.7 billion by 2025, with a projected Compound Annual Growth Rate (CAGR) of 6.5% from a 2025 base year. This expansion is primarily driven by escalating demand across key sectors including water and wastewater treatment, oil and gas exploration and refining, and the rapidly growing energy and power industry. Increased infrastructure development, particularly in emerging economies, and the ongoing need for efficient fluid control in industrial processes are significant growth catalysts. Additionally, stringent environmental regulations and a heightened focus on water conservation are driving investments in advanced butterfly valve technologies offering superior sealing and operational efficiency. Technological advancements, leading to the development of high-performance and specialized butterfly valves, are further supporting market expansion by catering to diverse application requirements.
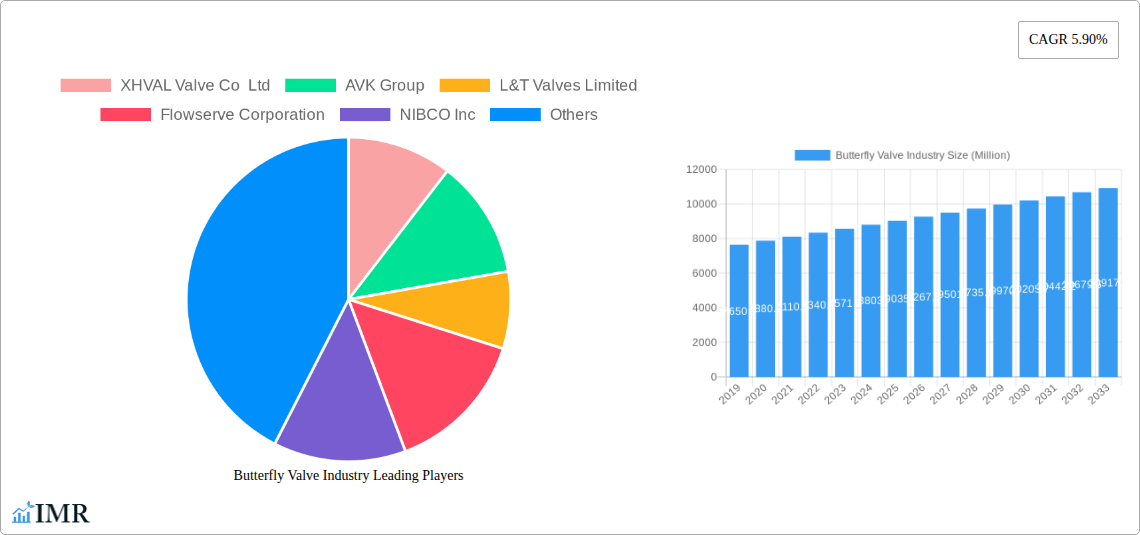
Butterfly Valve Industry Market Size (In Billion)
Market segmentation highlights strong performance in High Performance and Lined Butterfly Valves, attributed to their enhanced durability and chemical resistance, respectively. Concentric Butterfly Valves maintain a dominant share in terms of design, while Eccentric Butterfly Valves are gaining popularity for applications requiring precise shut-off. Demand for both On/Off and Control Valves is balanced, crucial for process automation. Geographically, the Asia Pacific region is anticipated to lead market growth due to rapid industrialization and extensive infrastructure projects in China and India. North America and Europe, established markets, will continue to be significant contributors, driven by retrofitting and upgrade initiatives. Leading market players, including XHVAL Valve Co Ltd, AVK Group, and Flowserve Corporation, are actively pursuing innovation and global expansion to capitalize on these promising opportunities within the competitive butterfly valve industry.
Butterfly Valve Industry Company Market Share
Comprehensive Butterfly Valve Market Analysis: Growth, Trends, and Opportunities (2019-2033)
This in-depth report provides a strategic outlook on the global Butterfly Valve Industry, offering critical insights into market dynamics, growth trajectories, and emerging opportunities. Covering a study period from 2019 to 2033, with a base and estimated year of 2025, this analysis delves into key segments, geographic landscapes, and competitive strategies. The report is meticulously structured to equip industry professionals, investors, and stakeholders with actionable intelligence for informed decision-making. With a focus on quantitative data presented in Million units and qualitative analysis, this report navigates the intricate landscape of butterfly valve applications across diverse end-user industries.
Butterfly Valve Industry Market Dynamics & Structure
The global Butterfly Valve Industry exhibits a moderately consolidated market structure, characterized by the presence of several prominent global players and a growing number of regional manufacturers. Innovation drivers are primarily fueled by the demand for enhanced efficiency, reduced leakage, and improved longevity in critical industrial processes. Regulatory frameworks, particularly concerning environmental standards and safety protocols in sectors like Oil & Gas and Chemical, significantly influence product development and adoption. Competitive product substitutes, such as ball valves and gate valves, present a continuous challenge, necessitating ongoing technological advancements and cost-effectiveness from butterfly valve manufacturers. End-user demographics are shifting towards industries with higher automation needs and stringent process control requirements. Mergers and acquisition (M&A) trends are observed as key players seek to expand their product portfolios, geographic reach, and technological capabilities. For instance, the acquisition of specialized valve manufacturers by larger conglomerates aims to consolidate market share and enhance competitive positioning.
- Market Concentration: Moderately consolidated with key global players holding significant market share, alongside a growing number of specialized regional entities.
- Technological Innovation Drivers: Focus on improved sealing technologies, material advancements for corrosive environments, smart valve features for IoT integration, and miniaturization for compact applications.
- Regulatory Frameworks: Stringent environmental and safety standards in Oil & Gas, Chemical, and Water & Wastewater sectors drive the adoption of compliant and high-performance butterfly valves.
- Competitive Product Substitutes: Ball valves, gate valves, and plug valves compete based on application-specific advantages, requiring butterfly valve manufacturers to emphasize unique benefits like lighter weight and faster operation.
- End-User Demographics: Increasing demand from sectors like Water & Wastewater treatment, Energy & Power generation, and Pharmaceutical manufacturing due to their critical role in process control and fluid management.
- M&A Trends: Strategic acquisitions by leading valve manufacturers to broaden product offerings, gain access to new technologies, and expand market penetration.
Butterfly Valve Industry Growth Trends & Insights
The Butterfly Valve Industry is poised for robust growth, driven by escalating investments in infrastructure development, industrial expansion, and the increasing adoption of automation across various sectors. The market size evolution is indicative of a sustained upward trajectory, projected to reach $XX Billion by 2033, expanding from an estimated $XX Billion in 2025. Adoption rates are accelerating, particularly for high-performance and lined butterfly valves, which offer superior resistance to corrosive media and extreme temperatures. Technological disruptions, such as the integration of smart features for real-time monitoring and predictive maintenance, are reshaping consumer behavior. End-users are increasingly prioritizing valves that offer operational efficiency, reduced downtime, and a lower total cost of ownership. The shift towards more sustainable and energy-efficient industrial processes also augments the demand for butterfly valves that contribute to optimized fluid management. The forecast period (2025–2033) is expected to witness a Compound Annual Growth Rate (CAGR) of approximately X.X%, underscoring the industry's significant expansion potential. Key drivers include the growing demand for reliable flow control in Water & Wastewater management, the expansion of Oil & Gas exploration and processing facilities, and the ongoing development in the Energy & Power sector, including renewable energy projects. Furthermore, the Pharmaceutical and Chemical industries, with their stringent process requirements, are significant contributors to market growth.
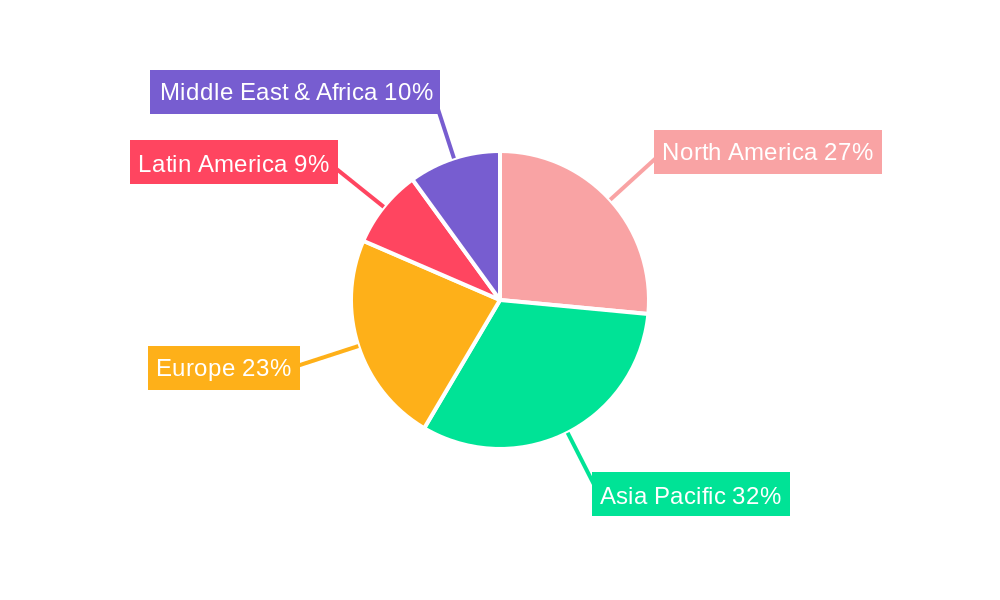
Dominant Regions, Countries, or Segments in Butterfly Valve Industry
The Asia Pacific region is emerging as a dominant force in the global Butterfly Valve Industry, propelled by rapid industrialization, extensive infrastructure projects, and a burgeoning manufacturing base. Countries like China and India are at the forefront, driven by significant government initiatives aimed at enhancing water management systems, expanding energy production capacities, and supporting the growth of the chemical and pharmaceutical sectors. The Water & Wastewater end-user industry, in particular, is a substantial market driver across all geographies, with a heightened focus on efficient water treatment and distribution networks. Within this segment, High Performance Butterfly Valves are gaining significant traction due to their superior sealing capabilities and applicability in demanding pressure and temperature ranges. The Concentric Butterfly Valve design, known for its simplicity and cost-effectiveness, continues to hold a considerable market share, especially in less critical applications and for lower-pressure systems. However, the increasing complexity of industrial processes and the need for enhanced reliability are fueling the growth of Eccentric Butterfly Valves, which offer improved sealing and reduced wear. The Oil & Gas sector remains a critical segment, particularly in regions with significant upstream and downstream activities, driving demand for robust and corrosion-resistant butterfly valves. The Energy & Power sector, encompassing both conventional and renewable energy generation, also presents a substantial market, requiring reliable valves for steam, water, and fuel control. The Chemical industry, with its diverse and often aggressive media, necessitates specialized lined and high-performance butterfly valves. While North America and Europe are mature markets with established demand, the Asia Pacific region's accelerated growth rate and expanding industrial footprint position it as the leading growth engine for the Butterfly Valve Industry. Factors contributing to this dominance include favorable economic policies, massive investments in infrastructure development, and the increasing adoption of advanced manufacturing technologies.
- Leading Region: Asia Pacific, driven by industrialization and infrastructure development in China and India.
- Dominant End-User Industry: Water & Wastewater, due to global focus on water security and treatment.
- Key Segment Growth Driver (Type): High Performance Butterfly Valves, for demanding applications.
- Key Segment Growth Driver (Design): Increasing adoption of Eccentric Butterfly Valves for enhanced reliability.
- Growth Factors in Asia Pacific: Economic policies, infrastructure investments, burgeoning manufacturing, and technological adoption.
Butterfly Valve Industry Product Landscape
The Butterfly Valve Industry product landscape is characterized by continuous innovation, focusing on enhanced performance, durability, and application-specific solutions. Manufacturers are developing advanced materials like specialized alloys and robust polymeric coatings to withstand corrosive environments and extreme temperatures, crucial for the Oil & Gas and Chemical sectors. Product differentiation is achieved through superior sealing technologies, such as advanced soft and metal seats, and improved actuation mechanisms that enable precise control. The integration of smart technologies, including IoT sensors for remote monitoring and diagnostics, is a significant trend, particularly for control valve applications in the Energy & Power and Pharmaceutical industries. Unique selling propositions often revolve around lightweight designs for easier installation and maintenance, extended service life, and compliance with stringent international standards.
Key Drivers, Barriers & Challenges in Butterfly Valve Industry
Key Drivers:
- Infrastructure Development: Growing global investments in water and wastewater treatment, power generation, and oil & gas infrastructure.
- Industrial Automation: Increasing adoption of automated processes across manufacturing, chemical, and pharmaceutical sectors requiring precise flow control.
- Technological Advancements: Development of high-performance materials, enhanced sealing technologies, and smart valve capabilities.
- Environmental Regulations: Stricter regulations promoting efficient water management and reducing industrial emissions drive demand for reliable valve solutions.
Barriers & Challenges:
- Intense Competition: Presence of numerous players leading to price pressures and market fragmentation.
- Supply Chain Disruptions: Volatility in raw material prices and global logistics challenges impacting production and delivery.
- High Initial Investment: For advanced manufacturing technologies and R&D, posing a barrier for smaller players.
- Technical Expertise Requirement: Installation and maintenance of specialized butterfly valves require skilled labor, which can be a limiting factor in some regions.
- Economic Downturns: Global economic slowdowns can impact capital expenditure in key end-user industries, affecting demand.
Emerging Opportunities in Butterfly Valve Industry
Emerging opportunities within the Butterfly Valve Industry lie in the growing demand for smart and connected valves equipped with IoT capabilities for predictive maintenance and remote monitoring, particularly in the Water & Wastewater and Energy & Power sectors. The increasing focus on sustainable practices and the expansion of renewable energy sources, such as solar and wind power, create a need for specialized butterfly valves in associated infrastructure. Untapped markets in developing economies, coupled with an increasing emphasis on upgrading aging industrial facilities, present significant growth potential. Furthermore, the development of ultra-high performance butterfly valves for niche applications in industries like semiconductor manufacturing and specialized chemical processing offers avenues for premium product development and market penetration.
Growth Accelerators in the Butterfly Valve Industry Industry
Long-term growth in the Butterfly Valve Industry will be significantly accelerated by continuous technological breakthroughs, particularly in the realm of material science and intelligent valve systems. The development of self-healing materials, advanced sensor integration for real-time performance analysis, and enhanced digital twin capabilities will revolutionize valve performance and lifecycle management. Strategic partnerships between valve manufacturers and automation solution providers will foster the creation of integrated flow control systems. Market expansion strategies, focusing on emerging economies and underserved sectors, coupled with a growing emphasis on sustainability and energy efficiency in valve design, will also act as powerful growth catalysts.
Key Players Shaping the Butterfly Valve Industry Market
- XHVAL Valve Co Ltd
- AVK Group
- L&T Valves Limited
- Flowserve Corporation
- NIBCO Inc
- Alfa Laval Corporate AB
- Emerson Electric Co
- ASE Engineered Solutions
- Huamei Machinery Limited
- Crane Co
- Curtiss-Wright Corporation
- Flexachem
- Schlumberger Limited
- Valmet Corporation
Notable Milestones in Butterfly Valve Industry Sector
- June 2021: Neles launched a new versatile butterfly valve product range, enabling easy valve configuration for many applications across all process industries. The product range offers superior process efficiency with a minimized environmental footprint and includes configurations from Neles' Neldisc metal seat and Jamesbury Wafer-Sphere soft seat families.
- April 2021: GF Piping Systems announced the launch of its new Butterfly Valve 565. This valve is strong yet lightweight, made from high-performance plastic components, suitable for up to 16 bars, and operates in temperatures ranging from -10 to +80 degrees Celsius. It is 60% lighter than comparable metal valves, offering a competitive advantage in water treatment applications.
In-Depth Butterfly Valve Industry Market Outlook
The future outlook for the Butterfly Valve Industry is exceptionally positive, driven by a confluence of sustained infrastructure development, rapid industrialization in emerging economies, and an unwavering commitment to technological innovation. The integration of smart valve technologies, enabling enhanced control, predictive maintenance, and operational efficiency, will be a pivotal factor in market expansion. Strategic collaborations and market diversification will allow companies to tap into new applications and geographic regions, further solidifying growth trajectories. The increasing global emphasis on sustainability and resource management will continue to fuel demand for efficient and reliable fluid control solutions, making the Butterfly Valve Industry a vital component in the evolution of modern industrial processes and infrastructure.
Butterfly Valve Industry Segmentation
-
1. Type
- 1.1. High Performance Butterfly Valve
- 1.2. Lined Butterfly Valve
-
2. Design
- 2.1. Concentric Butterfly Valve
- 2.2. Eccentric Butterfly Valve
-
3. Function
- 3.1. On/Off Valve
- 3.2. Control Valve
-
4. End-User Industry
- 4.1. Water & Wastewater
- 4.2. Oil & Gas
- 4.3. Energy & Power
- 4.4. Pharmaceutical
- 4.5. Chemical
- 4.6. Others
-
5. Geograhy
- 5.1. North America
- 5.2. Asia Pacific
- 5.3. Europe
- 5.4. Latin America
- 5.5. Middle East & Africa
Butterfly Valve Industry Segmentation By Geography
-
1. North America
- 1.1. United States
- 1.2. Canada
- 1.3. Mexico
-
2. South America
- 2.1. Brazil
- 2.2. Argentina
- 2.3. Rest of South America
-
3. Europe
- 3.1. United Kingdom
- 3.2. Germany
- 3.3. France
- 3.4. Italy
- 3.5. Spain
- 3.6. Russia
- 3.7. Benelux
- 3.8. Nordics
- 3.9. Rest of Europe
-
4. Middle East & Africa
- 4.1. Turkey
- 4.2. Israel
- 4.3. GCC
- 4.4. North Africa
- 4.5. South Africa
- 4.6. Rest of Middle East & Africa
-
5. Asia Pacific
- 5.1. China
- 5.2. India
- 5.3. Japan
- 5.4. South Korea
- 5.5. ASEAN
- 5.6. Oceania
- 5.7. Rest of Asia Pacific
Butterfly Valve Industry Regional Market Share
Geographic Coverage of Butterfly Valve Industry
Butterfly Valve Industry REPORT HIGHLIGHTS
| Aspects | Details |
|---|---|
| Study Period | 2020-2034 |
| Base Year | 2025 |
| Estimated Year | 2026 |
| Forecast Period | 2026-2034 |
| Historical Period | 2020-2025 |
| Growth Rate | CAGR of 6.5% from 2020-2034 |
| Segmentation |
|
Table of Contents
- 1. Introduction
- 1.1. Research Scope
- 1.2. Market Segmentation
- 1.3. Research Objective
- 1.4. Definitions and Assumptions
- 2. Executive Summary
- 2.1. Market Snapshot
- 3. Market Dynamics
- 3.1. Market Drivers
- 3.2. Market Restrains
- 3.3. Market Trends
- 3.4. Market Opportunities
- 4. Market Factor Analysis
- 4.1. Porters Five Forces
- 4.1.1. Bargaining Power of Suppliers
- 4.1.2. Bargaining Power of Buyers
- 4.1.3. Threat of New Entrants
- 4.1.4. Threat of Substitutes
- 4.1.5. Competitive Rivalry
- 4.2. PESTEL analysis
- 4.3. BCG Analysis
- 4.3.1. Stars (High Growth, High Market Share)
- 4.3.2. Cash Cows (Low Growth, High Market Share)
- 4.3.3. Question Mark (High Growth, Low Market Share)
- 4.3.4. Dogs (Low Growth, Low Market Share)
- 4.4. Ansoff Matrix Analysis
- 4.5. Supply Chain Analysis
- 4.6. Regulatory Landscape
- 4.7. Current Market Potential and Opportunity Assessment (TAM–SAM–SOM Framework)
- 4.8. IMR Analyst Note
- 4.1. Porters Five Forces
- 5. Market Analysis, Insights and Forecast 2021-2033
- 5.1. Market Analysis, Insights and Forecast - by Type
- 5.1.1. High Performance Butterfly Valve
- 5.1.2. Lined Butterfly Valve
- 5.2. Market Analysis, Insights and Forecast - by Design
- 5.2.1. Concentric Butterfly Valve
- 5.2.2. Eccentric Butterfly Valve
- 5.3. Market Analysis, Insights and Forecast - by Function
- 5.3.1. On/Off Valve
- 5.3.2. Control Valve
- 5.4. Market Analysis, Insights and Forecast - by End-User Industry
- 5.4.1. Water & Wastewater
- 5.4.2. Oil & Gas
- 5.4.3. Energy & Power
- 5.4.4. Pharmaceutical
- 5.4.5. Chemical
- 5.4.6. Others
- 5.5. Market Analysis, Insights and Forecast - by Geograhy
- 5.5.1. North America
- 5.5.2. Asia Pacific
- 5.5.3. Europe
- 5.5.4. Latin America
- 5.5.5. Middle East & Africa
- 5.6. Market Analysis, Insights and Forecast - by Region
- 5.6.1. North America
- 5.6.2. South America
- 5.6.3. Europe
- 5.6.4. Middle East & Africa
- 5.6.5. Asia Pacific
- 5.1. Market Analysis, Insights and Forecast - by Type
- 6. Global Butterfly Valve Industry Analysis, Insights and Forecast, 2021-2033
- 6.1. Market Analysis, Insights and Forecast - by Type
- 6.1.1. High Performance Butterfly Valve
- 6.1.2. Lined Butterfly Valve
- 6.2. Market Analysis, Insights and Forecast - by Design
- 6.2.1. Concentric Butterfly Valve
- 6.2.2. Eccentric Butterfly Valve
- 6.3. Market Analysis, Insights and Forecast - by Function
- 6.3.1. On/Off Valve
- 6.3.2. Control Valve
- 6.4. Market Analysis, Insights and Forecast - by End-User Industry
- 6.4.1. Water & Wastewater
- 6.4.2. Oil & Gas
- 6.4.3. Energy & Power
- 6.4.4. Pharmaceutical
- 6.4.5. Chemical
- 6.4.6. Others
- 6.5. Market Analysis, Insights and Forecast - by Geograhy
- 6.5.1. North America
- 6.5.2. Asia Pacific
- 6.5.3. Europe
- 6.5.4. Latin America
- 6.5.5. Middle East & Africa
- 6.1. Market Analysis, Insights and Forecast - by Type
- 7. North America Butterfly Valve Industry Analysis, Insights and Forecast, 2020-2032
- 7.1. Market Analysis, Insights and Forecast - by Type
- 7.1.1. High Performance Butterfly Valve
- 7.1.2. Lined Butterfly Valve
- 7.2. Market Analysis, Insights and Forecast - by Design
- 7.2.1. Concentric Butterfly Valve
- 7.2.2. Eccentric Butterfly Valve
- 7.3. Market Analysis, Insights and Forecast - by Function
- 7.3.1. On/Off Valve
- 7.3.2. Control Valve
- 7.4. Market Analysis, Insights and Forecast - by End-User Industry
- 7.4.1. Water & Wastewater
- 7.4.2. Oil & Gas
- 7.4.3. Energy & Power
- 7.4.4. Pharmaceutical
- 7.4.5. Chemical
- 7.4.6. Others
- 7.5. Market Analysis, Insights and Forecast - by Geograhy
- 7.5.1. North America
- 7.5.2. Asia Pacific
- 7.5.3. Europe
- 7.5.4. Latin America
- 7.5.5. Middle East & Africa
- 7.1. Market Analysis, Insights and Forecast - by Type
- 8. South America Butterfly Valve Industry Analysis, Insights and Forecast, 2020-2032
- 8.1. Market Analysis, Insights and Forecast - by Type
- 8.1.1. High Performance Butterfly Valve
- 8.1.2. Lined Butterfly Valve
- 8.2. Market Analysis, Insights and Forecast - by Design
- 8.2.1. Concentric Butterfly Valve
- 8.2.2. Eccentric Butterfly Valve
- 8.3. Market Analysis, Insights and Forecast - by Function
- 8.3.1. On/Off Valve
- 8.3.2. Control Valve
- 8.4. Market Analysis, Insights and Forecast - by End-User Industry
- 8.4.1. Water & Wastewater
- 8.4.2. Oil & Gas
- 8.4.3. Energy & Power
- 8.4.4. Pharmaceutical
- 8.4.5. Chemical
- 8.4.6. Others
- 8.5. Market Analysis, Insights and Forecast - by Geograhy
- 8.5.1. North America
- 8.5.2. Asia Pacific
- 8.5.3. Europe
- 8.5.4. Latin America
- 8.5.5. Middle East & Africa
- 8.1. Market Analysis, Insights and Forecast - by Type
- 9. Europe Butterfly Valve Industry Analysis, Insights and Forecast, 2020-2032
- 9.1. Market Analysis, Insights and Forecast - by Type
- 9.1.1. High Performance Butterfly Valve
- 9.1.2. Lined Butterfly Valve
- 9.2. Market Analysis, Insights and Forecast - by Design
- 9.2.1. Concentric Butterfly Valve
- 9.2.2. Eccentric Butterfly Valve
- 9.3. Market Analysis, Insights and Forecast - by Function
- 9.3.1. On/Off Valve
- 9.3.2. Control Valve
- 9.4. Market Analysis, Insights and Forecast - by End-User Industry
- 9.4.1. Water & Wastewater
- 9.4.2. Oil & Gas
- 9.4.3. Energy & Power
- 9.4.4. Pharmaceutical
- 9.4.5. Chemical
- 9.4.6. Others
- 9.5. Market Analysis, Insights and Forecast - by Geograhy
- 9.5.1. North America
- 9.5.2. Asia Pacific
- 9.5.3. Europe
- 9.5.4. Latin America
- 9.5.5. Middle East & Africa
- 9.1. Market Analysis, Insights and Forecast - by Type
- 10. Middle East & Africa Butterfly Valve Industry Analysis, Insights and Forecast, 2020-2032
- 10.1. Market Analysis, Insights and Forecast - by Type
- 10.1.1. High Performance Butterfly Valve
- 10.1.2. Lined Butterfly Valve
- 10.2. Market Analysis, Insights and Forecast - by Design
- 10.2.1. Concentric Butterfly Valve
- 10.2.2. Eccentric Butterfly Valve
- 10.3. Market Analysis, Insights and Forecast - by Function
- 10.3.1. On/Off Valve
- 10.3.2. Control Valve
- 10.4. Market Analysis, Insights and Forecast - by End-User Industry
- 10.4.1. Water & Wastewater
- 10.4.2. Oil & Gas
- 10.4.3. Energy & Power
- 10.4.4. Pharmaceutical
- 10.4.5. Chemical
- 10.4.6. Others
- 10.5. Market Analysis, Insights and Forecast - by Geograhy
- 10.5.1. North America
- 10.5.2. Asia Pacific
- 10.5.3. Europe
- 10.5.4. Latin America
- 10.5.5. Middle East & Africa
- 10.1. Market Analysis, Insights and Forecast - by Type
- 11. Asia Pacific Butterfly Valve Industry Analysis, Insights and Forecast, 2020-2032
- 11.1. Market Analysis, Insights and Forecast - by Type
- 11.1.1. High Performance Butterfly Valve
- 11.1.2. Lined Butterfly Valve
- 11.2. Market Analysis, Insights and Forecast - by Design
- 11.2.1. Concentric Butterfly Valve
- 11.2.2. Eccentric Butterfly Valve
- 11.3. Market Analysis, Insights and Forecast - by Function
- 11.3.1. On/Off Valve
- 11.3.2. Control Valve
- 11.4. Market Analysis, Insights and Forecast - by End-User Industry
- 11.4.1. Water & Wastewater
- 11.4.2. Oil & Gas
- 11.4.3. Energy & Power
- 11.4.4. Pharmaceutical
- 11.4.5. Chemical
- 11.4.6. Others
- 11.5. Market Analysis, Insights and Forecast - by Geograhy
- 11.5.1. North America
- 11.5.2. Asia Pacific
- 11.5.3. Europe
- 11.5.4. Latin America
- 11.5.5. Middle East & Africa
- 11.1. Market Analysis, Insights and Forecast - by Type
- 12. Competitive Analysis
- 12.1. Company Profiles
- 12.1.1 XHVAL Valve Co Ltd
- 12.1.1.1. Company Overview
- 12.1.1.2. Products
- 12.1.1.3. Company Financials
- 12.1.1.4. SWOT Analysis
- 12.1.2 AVK Group
- 12.1.2.1. Company Overview
- 12.1.2.2. Products
- 12.1.2.3. Company Financials
- 12.1.2.4. SWOT Analysis
- 12.1.3 L&T Valves Limited
- 12.1.3.1. Company Overview
- 12.1.3.2. Products
- 12.1.3.3. Company Financials
- 12.1.3.4. SWOT Analysis
- 12.1.4 Flowserve Corporation
- 12.1.4.1. Company Overview
- 12.1.4.2. Products
- 12.1.4.3. Company Financials
- 12.1.4.4. SWOT Analysis
- 12.1.5 NIBCO Inc
- 12.1.5.1. Company Overview
- 12.1.5.2. Products
- 12.1.5.3. Company Financials
- 12.1.5.4. SWOT Analysis
- 12.1.6 Alfa Laval Corporate AB
- 12.1.6.1. Company Overview
- 12.1.6.2. Products
- 12.1.6.3. Company Financials
- 12.1.6.4. SWOT Analysis
- 12.1.7 Emerson Electric Co
- 12.1.7.1. Company Overview
- 12.1.7.2. Products
- 12.1.7.3. Company Financials
- 12.1.7.4. SWOT Analysis
- 12.1.8 ASE Engineered Solutions
- 12.1.8.1. Company Overview
- 12.1.8.2. Products
- 12.1.8.3. Company Financials
- 12.1.8.4. SWOT Analysis
- 12.1.9 Huamei Machinery Limited
- 12.1.9.1. Company Overview
- 12.1.9.2. Products
- 12.1.9.3. Company Financials
- 12.1.9.4. SWOT Analysis
- 12.1.10 Crane Co
- 12.1.10.1. Company Overview
- 12.1.10.2. Products
- 12.1.10.3. Company Financials
- 12.1.10.4. SWOT Analysis
- 12.1.11 Curtiss-Wright Corporation
- 12.1.11.1. Company Overview
- 12.1.11.2. Products
- 12.1.11.3. Company Financials
- 12.1.11.4. SWOT Analysis
- 12.1.12 Flexachem
- 12.1.12.1. Company Overview
- 12.1.12.2. Products
- 12.1.12.3. Company Financials
- 12.1.12.4. SWOT Analysis
- 12.1.13 Schlumberger Limited
- 12.1.13.1. Company Overview
- 12.1.13.2. Products
- 12.1.13.3. Company Financials
- 12.1.13.4. SWOT Analysis
- 12.1.14 Valmet Corporation
- 12.1.14.1. Company Overview
- 12.1.14.2. Products
- 12.1.14.3. Company Financials
- 12.1.14.4. SWOT Analysis
- 12.1.1 XHVAL Valve Co Ltd
- 12.2. Market Entropy
- 12.2.1 Company's Key Areas Served
- 12.2.2 Recent Developments
- 12.3. Company Market Share Analysis 2025
- 12.3.1 Top 5 Companies Market Share Analysis
- 12.3.2 Top 3 Companies Market Share Analysis
- 12.4. List of Potential Customers
- 13. Research Methodology
List of Figures
- Figure 1: Global Butterfly Valve Industry Revenue Breakdown (billion, %) by Region 2025 & 2033
- Figure 2: North America Butterfly Valve Industry Revenue (billion), by Type 2025 & 2033
- Figure 3: North America Butterfly Valve Industry Revenue Share (%), by Type 2025 & 2033
- Figure 4: North America Butterfly Valve Industry Revenue (billion), by Design 2025 & 2033
- Figure 5: North America Butterfly Valve Industry Revenue Share (%), by Design 2025 & 2033
- Figure 6: North America Butterfly Valve Industry Revenue (billion), by Function 2025 & 2033
- Figure 7: North America Butterfly Valve Industry Revenue Share (%), by Function 2025 & 2033
- Figure 8: North America Butterfly Valve Industry Revenue (billion), by End-User Industry 2025 & 2033
- Figure 9: North America Butterfly Valve Industry Revenue Share (%), by End-User Industry 2025 & 2033
- Figure 10: North America Butterfly Valve Industry Revenue (billion), by Geograhy 2025 & 2033
- Figure 11: North America Butterfly Valve Industry Revenue Share (%), by Geograhy 2025 & 2033
- Figure 12: North America Butterfly Valve Industry Revenue (billion), by Country 2025 & 2033
- Figure 13: North America Butterfly Valve Industry Revenue Share (%), by Country 2025 & 2033
- Figure 14: South America Butterfly Valve Industry Revenue (billion), by Type 2025 & 2033
- Figure 15: South America Butterfly Valve Industry Revenue Share (%), by Type 2025 & 2033
- Figure 16: South America Butterfly Valve Industry Revenue (billion), by Design 2025 & 2033
- Figure 17: South America Butterfly Valve Industry Revenue Share (%), by Design 2025 & 2033
- Figure 18: South America Butterfly Valve Industry Revenue (billion), by Function 2025 & 2033
- Figure 19: South America Butterfly Valve Industry Revenue Share (%), by Function 2025 & 2033
- Figure 20: South America Butterfly Valve Industry Revenue (billion), by End-User Industry 2025 & 2033
- Figure 21: South America Butterfly Valve Industry Revenue Share (%), by End-User Industry 2025 & 2033
- Figure 22: South America Butterfly Valve Industry Revenue (billion), by Geograhy 2025 & 2033
- Figure 23: South America Butterfly Valve Industry Revenue Share (%), by Geograhy 2025 & 2033
- Figure 24: South America Butterfly Valve Industry Revenue (billion), by Country 2025 & 2033
- Figure 25: South America Butterfly Valve Industry Revenue Share (%), by Country 2025 & 2033
- Figure 26: Europe Butterfly Valve Industry Revenue (billion), by Type 2025 & 2033
- Figure 27: Europe Butterfly Valve Industry Revenue Share (%), by Type 2025 & 2033
- Figure 28: Europe Butterfly Valve Industry Revenue (billion), by Design 2025 & 2033
- Figure 29: Europe Butterfly Valve Industry Revenue Share (%), by Design 2025 & 2033
- Figure 30: Europe Butterfly Valve Industry Revenue (billion), by Function 2025 & 2033
- Figure 31: Europe Butterfly Valve Industry Revenue Share (%), by Function 2025 & 2033
- Figure 32: Europe Butterfly Valve Industry Revenue (billion), by End-User Industry 2025 & 2033
- Figure 33: Europe Butterfly Valve Industry Revenue Share (%), by End-User Industry 2025 & 2033
- Figure 34: Europe Butterfly Valve Industry Revenue (billion), by Geograhy 2025 & 2033
- Figure 35: Europe Butterfly Valve Industry Revenue Share (%), by Geograhy 2025 & 2033
- Figure 36: Europe Butterfly Valve Industry Revenue (billion), by Country 2025 & 2033
- Figure 37: Europe Butterfly Valve Industry Revenue Share (%), by Country 2025 & 2033
- Figure 38: Middle East & Africa Butterfly Valve Industry Revenue (billion), by Type 2025 & 2033
- Figure 39: Middle East & Africa Butterfly Valve Industry Revenue Share (%), by Type 2025 & 2033
- Figure 40: Middle East & Africa Butterfly Valve Industry Revenue (billion), by Design 2025 & 2033
- Figure 41: Middle East & Africa Butterfly Valve Industry Revenue Share (%), by Design 2025 & 2033
- Figure 42: Middle East & Africa Butterfly Valve Industry Revenue (billion), by Function 2025 & 2033
- Figure 43: Middle East & Africa Butterfly Valve Industry Revenue Share (%), by Function 2025 & 2033
- Figure 44: Middle East & Africa Butterfly Valve Industry Revenue (billion), by End-User Industry 2025 & 2033
- Figure 45: Middle East & Africa Butterfly Valve Industry Revenue Share (%), by End-User Industry 2025 & 2033
- Figure 46: Middle East & Africa Butterfly Valve Industry Revenue (billion), by Geograhy 2025 & 2033
- Figure 47: Middle East & Africa Butterfly Valve Industry Revenue Share (%), by Geograhy 2025 & 2033
- Figure 48: Middle East & Africa Butterfly Valve Industry Revenue (billion), by Country 2025 & 2033
- Figure 49: Middle East & Africa Butterfly Valve Industry Revenue Share (%), by Country 2025 & 2033
- Figure 50: Asia Pacific Butterfly Valve Industry Revenue (billion), by Type 2025 & 2033
- Figure 51: Asia Pacific Butterfly Valve Industry Revenue Share (%), by Type 2025 & 2033
- Figure 52: Asia Pacific Butterfly Valve Industry Revenue (billion), by Design 2025 & 2033
- Figure 53: Asia Pacific Butterfly Valve Industry Revenue Share (%), by Design 2025 & 2033
- Figure 54: Asia Pacific Butterfly Valve Industry Revenue (billion), by Function 2025 & 2033
- Figure 55: Asia Pacific Butterfly Valve Industry Revenue Share (%), by Function 2025 & 2033
- Figure 56: Asia Pacific Butterfly Valve Industry Revenue (billion), by End-User Industry 2025 & 2033
- Figure 57: Asia Pacific Butterfly Valve Industry Revenue Share (%), by End-User Industry 2025 & 2033
- Figure 58: Asia Pacific Butterfly Valve Industry Revenue (billion), by Geograhy 2025 & 2033
- Figure 59: Asia Pacific Butterfly Valve Industry Revenue Share (%), by Geograhy 2025 & 2033
- Figure 60: Asia Pacific Butterfly Valve Industry Revenue (billion), by Country 2025 & 2033
- Figure 61: Asia Pacific Butterfly Valve Industry Revenue Share (%), by Country 2025 & 2033
List of Tables
- Table 1: Global Butterfly Valve Industry Revenue billion Forecast, by Type 2020 & 2033
- Table 2: Global Butterfly Valve Industry Revenue billion Forecast, by Design 2020 & 2033
- Table 3: Global Butterfly Valve Industry Revenue billion Forecast, by Function 2020 & 2033
- Table 4: Global Butterfly Valve Industry Revenue billion Forecast, by End-User Industry 2020 & 2033
- Table 5: Global Butterfly Valve Industry Revenue billion Forecast, by Geograhy 2020 & 2033
- Table 6: Global Butterfly Valve Industry Revenue billion Forecast, by Region 2020 & 2033
- Table 7: Global Butterfly Valve Industry Revenue billion Forecast, by Type 2020 & 2033
- Table 8: Global Butterfly Valve Industry Revenue billion Forecast, by Design 2020 & 2033
- Table 9: Global Butterfly Valve Industry Revenue billion Forecast, by Function 2020 & 2033
- Table 10: Global Butterfly Valve Industry Revenue billion Forecast, by End-User Industry 2020 & 2033
- Table 11: Global Butterfly Valve Industry Revenue billion Forecast, by Geograhy 2020 & 2033
- Table 12: Global Butterfly Valve Industry Revenue billion Forecast, by Country 2020 & 2033
- Table 13: United States Butterfly Valve Industry Revenue (billion) Forecast, by Application 2020 & 2033
- Table 14: Canada Butterfly Valve Industry Revenue (billion) Forecast, by Application 2020 & 2033
- Table 15: Mexico Butterfly Valve Industry Revenue (billion) Forecast, by Application 2020 & 2033
- Table 16: Global Butterfly Valve Industry Revenue billion Forecast, by Type 2020 & 2033
- Table 17: Global Butterfly Valve Industry Revenue billion Forecast, by Design 2020 & 2033
- Table 18: Global Butterfly Valve Industry Revenue billion Forecast, by Function 2020 & 2033
- Table 19: Global Butterfly Valve Industry Revenue billion Forecast, by End-User Industry 2020 & 2033
- Table 20: Global Butterfly Valve Industry Revenue billion Forecast, by Geograhy 2020 & 2033
- Table 21: Global Butterfly Valve Industry Revenue billion Forecast, by Country 2020 & 2033
- Table 22: Brazil Butterfly Valve Industry Revenue (billion) Forecast, by Application 2020 & 2033
- Table 23: Argentina Butterfly Valve Industry Revenue (billion) Forecast, by Application 2020 & 2033
- Table 24: Rest of South America Butterfly Valve Industry Revenue (billion) Forecast, by Application 2020 & 2033
- Table 25: Global Butterfly Valve Industry Revenue billion Forecast, by Type 2020 & 2033
- Table 26: Global Butterfly Valve Industry Revenue billion Forecast, by Design 2020 & 2033
- Table 27: Global Butterfly Valve Industry Revenue billion Forecast, by Function 2020 & 2033
- Table 28: Global Butterfly Valve Industry Revenue billion Forecast, by End-User Industry 2020 & 2033
- Table 29: Global Butterfly Valve Industry Revenue billion Forecast, by Geograhy 2020 & 2033
- Table 30: Global Butterfly Valve Industry Revenue billion Forecast, by Country 2020 & 2033
- Table 31: United Kingdom Butterfly Valve Industry Revenue (billion) Forecast, by Application 2020 & 2033
- Table 32: Germany Butterfly Valve Industry Revenue (billion) Forecast, by Application 2020 & 2033
- Table 33: France Butterfly Valve Industry Revenue (billion) Forecast, by Application 2020 & 2033
- Table 34: Italy Butterfly Valve Industry Revenue (billion) Forecast, by Application 2020 & 2033
- Table 35: Spain Butterfly Valve Industry Revenue (billion) Forecast, by Application 2020 & 2033
- Table 36: Russia Butterfly Valve Industry Revenue (billion) Forecast, by Application 2020 & 2033
- Table 37: Benelux Butterfly Valve Industry Revenue (billion) Forecast, by Application 2020 & 2033
- Table 38: Nordics Butterfly Valve Industry Revenue (billion) Forecast, by Application 2020 & 2033
- Table 39: Rest of Europe Butterfly Valve Industry Revenue (billion) Forecast, by Application 2020 & 2033
- Table 40: Global Butterfly Valve Industry Revenue billion Forecast, by Type 2020 & 2033
- Table 41: Global Butterfly Valve Industry Revenue billion Forecast, by Design 2020 & 2033
- Table 42: Global Butterfly Valve Industry Revenue billion Forecast, by Function 2020 & 2033
- Table 43: Global Butterfly Valve Industry Revenue billion Forecast, by End-User Industry 2020 & 2033
- Table 44: Global Butterfly Valve Industry Revenue billion Forecast, by Geograhy 2020 & 2033
- Table 45: Global Butterfly Valve Industry Revenue billion Forecast, by Country 2020 & 2033
- Table 46: Turkey Butterfly Valve Industry Revenue (billion) Forecast, by Application 2020 & 2033
- Table 47: Israel Butterfly Valve Industry Revenue (billion) Forecast, by Application 2020 & 2033
- Table 48: GCC Butterfly Valve Industry Revenue (billion) Forecast, by Application 2020 & 2033
- Table 49: North Africa Butterfly Valve Industry Revenue (billion) Forecast, by Application 2020 & 2033
- Table 50: South Africa Butterfly Valve Industry Revenue (billion) Forecast, by Application 2020 & 2033
- Table 51: Rest of Middle East & Africa Butterfly Valve Industry Revenue (billion) Forecast, by Application 2020 & 2033
- Table 52: Global Butterfly Valve Industry Revenue billion Forecast, by Type 2020 & 2033
- Table 53: Global Butterfly Valve Industry Revenue billion Forecast, by Design 2020 & 2033
- Table 54: Global Butterfly Valve Industry Revenue billion Forecast, by Function 2020 & 2033
- Table 55: Global Butterfly Valve Industry Revenue billion Forecast, by End-User Industry 2020 & 2033
- Table 56: Global Butterfly Valve Industry Revenue billion Forecast, by Geograhy 2020 & 2033
- Table 57: Global Butterfly Valve Industry Revenue billion Forecast, by Country 2020 & 2033
- Table 58: China Butterfly Valve Industry Revenue (billion) Forecast, by Application 2020 & 2033
- Table 59: India Butterfly Valve Industry Revenue (billion) Forecast, by Application 2020 & 2033
- Table 60: Japan Butterfly Valve Industry Revenue (billion) Forecast, by Application 2020 & 2033
- Table 61: South Korea Butterfly Valve Industry Revenue (billion) Forecast, by Application 2020 & 2033
- Table 62: ASEAN Butterfly Valve Industry Revenue (billion) Forecast, by Application 2020 & 2033
- Table 63: Oceania Butterfly Valve Industry Revenue (billion) Forecast, by Application 2020 & 2033
- Table 64: Rest of Asia Pacific Butterfly Valve Industry Revenue (billion) Forecast, by Application 2020 & 2033
Frequently Asked Questions
1. What is the projected Compound Annual Growth Rate (CAGR) of the Butterfly Valve Industry?
The projected CAGR is approximately 6.5%.
2. Which companies are prominent players in the Butterfly Valve Industry?
Key companies in the market include XHVAL Valve Co Ltd, AVK Group, L&T Valves Limited, Flowserve Corporation, NIBCO Inc, Alfa Laval Corporate AB, Emerson Electric Co, ASE Engineered Solutions, Huamei Machinery Limited, Crane Co, Curtiss-Wright Corporation, Flexachem, Schlumberger Limited, Valmet Corporation.
3. What are the main segments of the Butterfly Valve Industry?
The market segments include Type, Design, Function, End-User Industry, Geograhy.
4. Can you provide details about the market size?
The market size is estimated to be USD 11.7 billion as of 2022.
5. What are some drivers contributing to market growth?
Increasing Investment in Oil & Gas Refineries and Pipelines; Increasing Demand for Vales With Tight Shutoff. High-Pressure Handling Capacity. and Low Installation Cost.
6. What are the notable trends driving market growth?
Oil & Gas Sector to Hold Significant Market Share.
7. Are there any restraints impacting market growth?
Low resistance to cavitation & choke and limited throttling in case of low pressure.
8. Can you provide examples of recent developments in the market?
June 2021 - Neles launched a new versatile butterfly valve product range that enables easy valve configuration for many applications in all process industries. According to the company, the product range offers superior process efficiency with a minimized environmental footprint. Furthermore, the versatile butterfly valve range enables many configurations from Neles' product families, including the Neles Neldisc metal seat and Jamesbury Wafer-Sphere soft seat.
9. What pricing options are available for accessing the report?
Pricing options include single-user, multi-user, and enterprise licenses priced at USD 4750, USD 5250, and USD 8750 respectively.
10. Is the market size provided in terms of value or volume?
The market size is provided in terms of value, measured in billion.
11. Are there any specific market keywords associated with the report?
Yes, the market keyword associated with the report is "Butterfly Valve Industry," which aids in identifying and referencing the specific market segment covered.
12. How do I determine which pricing option suits my needs best?
The pricing options vary based on user requirements and access needs. Individual users may opt for single-user licenses, while businesses requiring broader access may choose multi-user or enterprise licenses for cost-effective access to the report.
13. Are there any additional resources or data provided in the Butterfly Valve Industry report?
While the report offers comprehensive insights, it's advisable to review the specific contents or supplementary materials provided to ascertain if additional resources or data are available.
14. How can I stay updated on further developments or reports in the Butterfly Valve Industry?
To stay informed about further developments, trends, and reports in the Butterfly Valve Industry, consider subscribing to industry newsletters, following relevant companies and organizations, or regularly checking reputable industry news sources and publications.
Methodology
Step 1 - Identification of Relevant Samples Size from Population Database


Step 2 - Approaches for Defining Global Market Size (Value, Volume* & Price*)

Note*: In applicable scenarios
Step 3 - Data Sources
Primary Research
- Web Analytics
- Survey Reports
- Research Institute
- Latest Research Reports
- Opinion Leaders
Secondary Research
- Annual Reports
- White Paper
- Latest Press Release
- Industry Association
- Paid Database
- Investor Presentations

Step 4 - Data Triangulation
Involves using different sources of information in order to increase the validity of a study
These sources are likely to be stakeholders in a program - participants, other researchers, program staff, other community members, and so on.
Then we put all data in single framework & apply various statistical tools to find out the dynamic on the market.
During the analysis stage, feedback from the stakeholder groups would be compared to determine areas of agreement as well as areas of divergence