

Key Insights
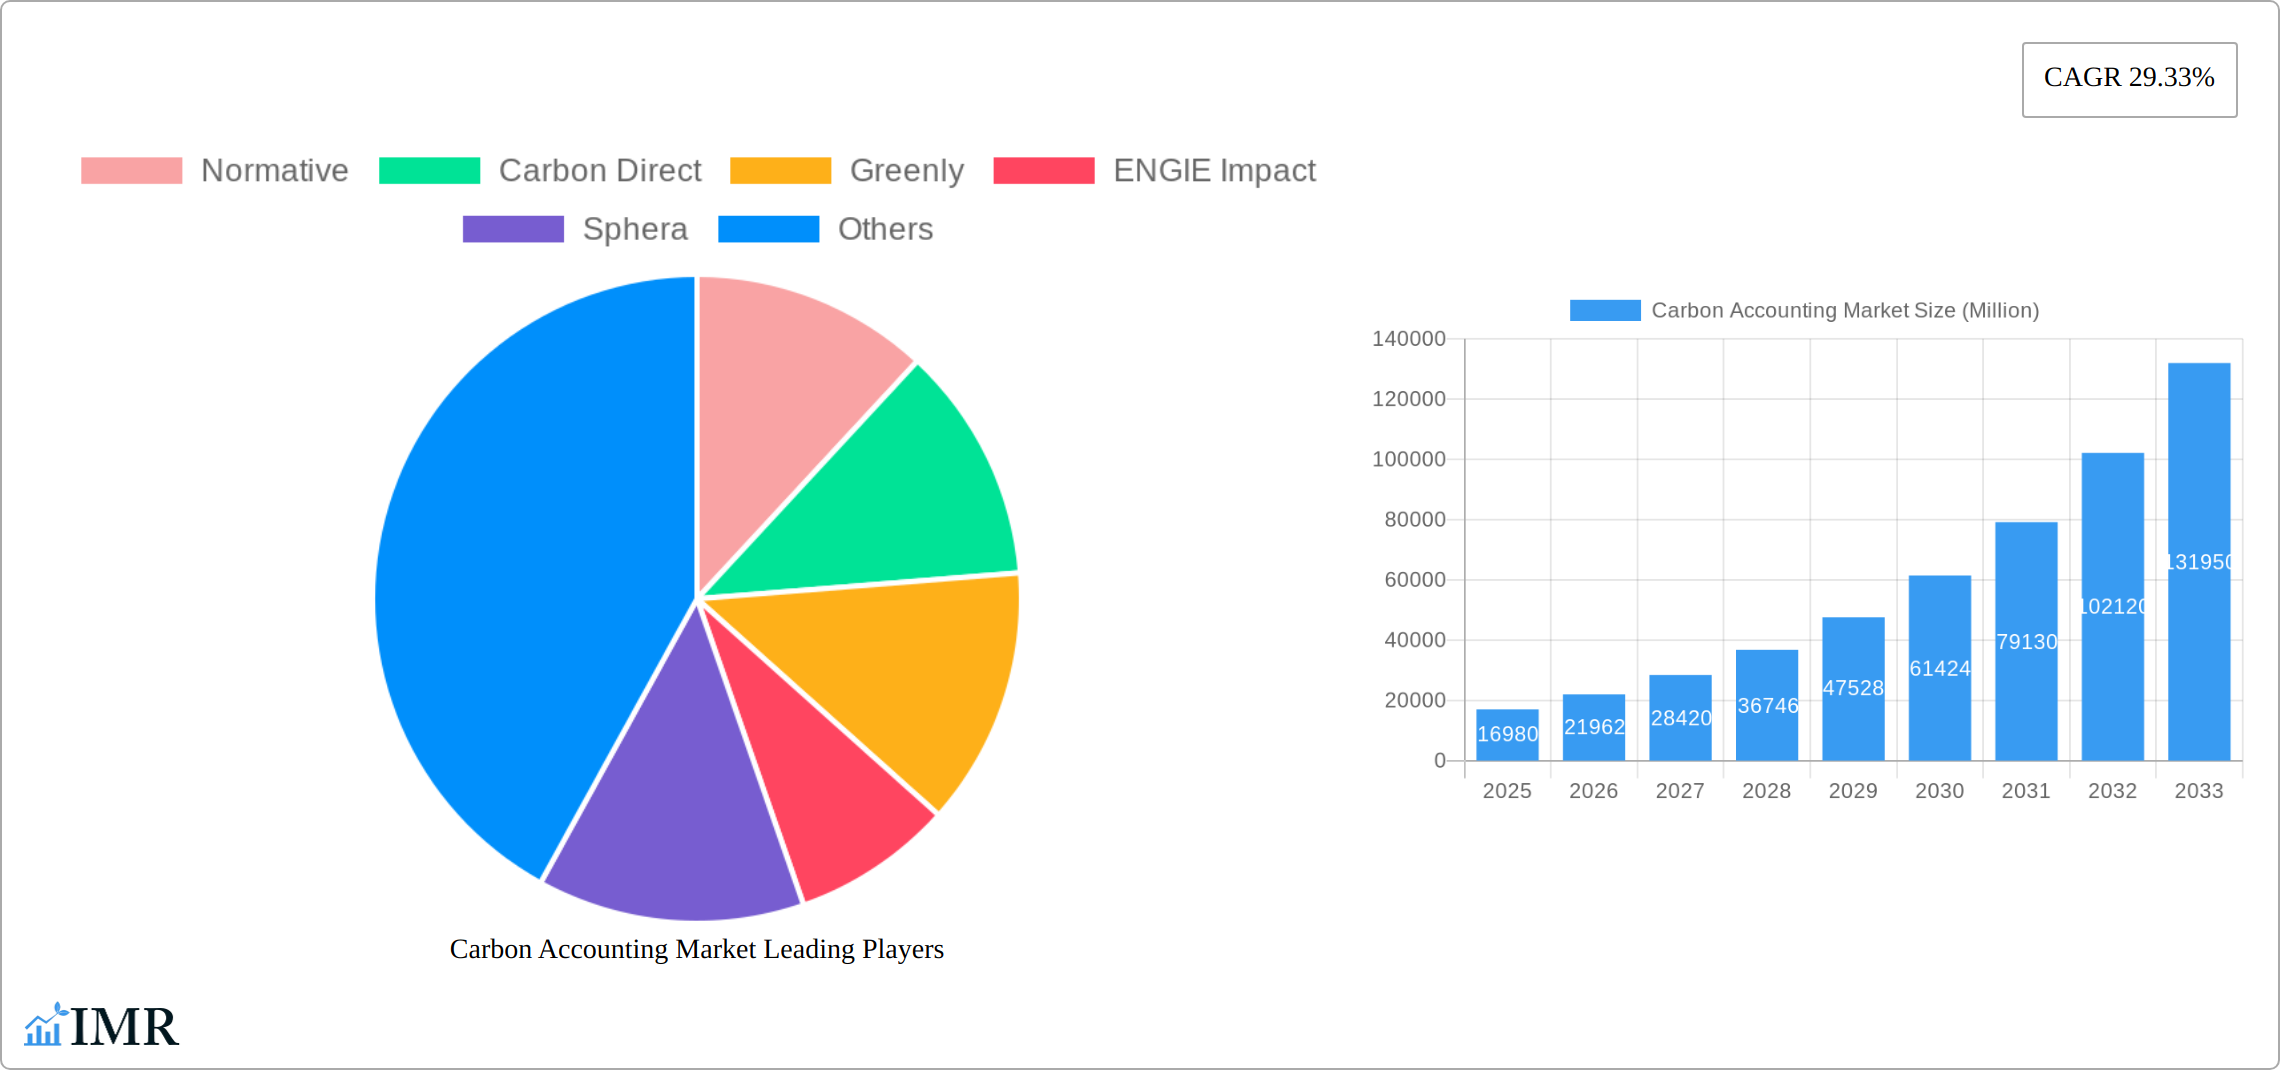
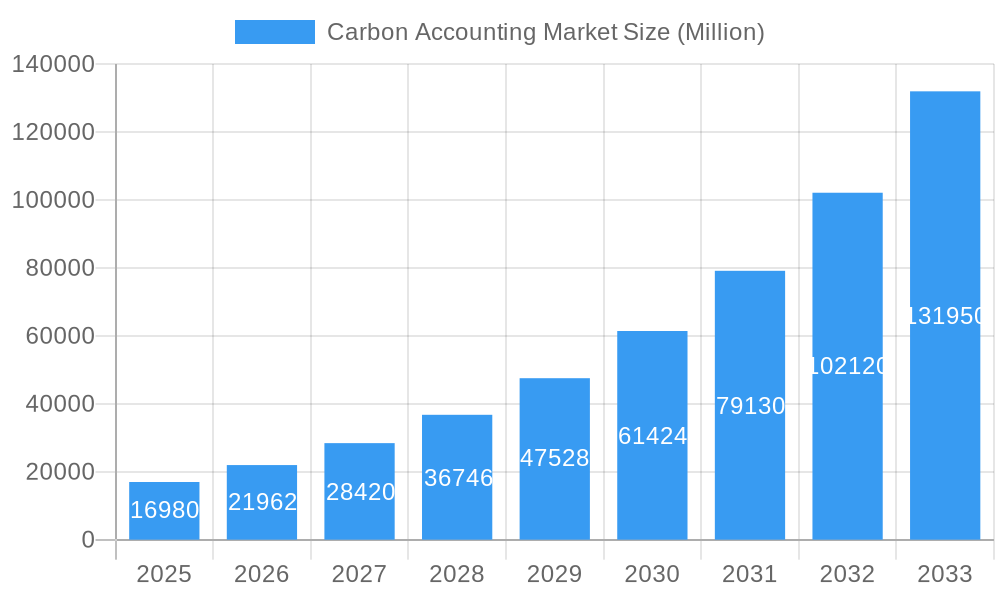
The global carbon accounting market is experiencing robust growth, projected to reach \$16.98 billion in 2025 and exhibiting a Compound Annual Growth Rate (CAGR) of 29.33% from 2025 to 2033. This expansion is driven by increasing regulatory pressure on businesses to measure and report their carbon footprint, coupled with growing corporate social responsibility (CSR) initiatives and a heightened awareness of climate change among consumers and investors. The demand for accurate and reliable carbon accounting solutions is fueling the adoption of both cloud-based and on-premise software across diverse sectors. Key end-user industries, including oil and gas, power utilities, and construction & infrastructure, are leading the market growth due to their significant carbon emissions and the stringent regulatory frameworks they face. The emergence of innovative technologies, such as AI-powered carbon accounting platforms, further enhances accuracy and efficiency, attracting businesses seeking streamlined solutions for emissions management.
Carbon Accounting Market Market Size (In Billion)
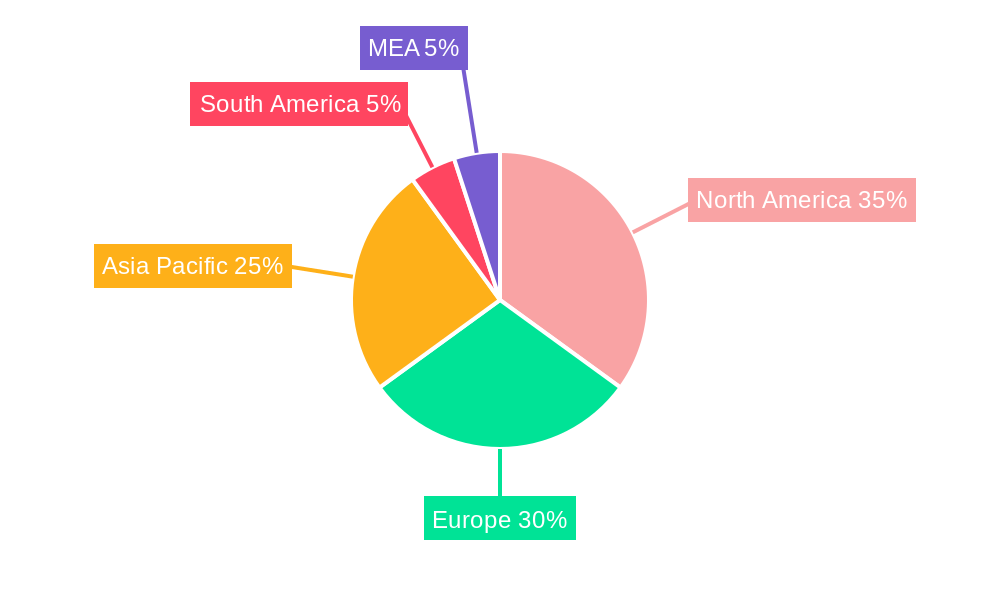
The market segmentation reveals a dynamic landscape with strong growth potential in various regions. North America and Europe currently hold significant market share, driven by early adoption of carbon accounting practices and well-established regulatory frameworks. However, rapid economic growth and increasing environmental awareness in the Asia-Pacific region, particularly in China and India, present lucrative opportunities for market expansion. Competitive forces are shaping the market, with established players alongside emerging technology providers vying for market share. This competitive landscape fuels innovation and drives the development of more sophisticated and user-friendly carbon accounting solutions, further propelling market growth. While challenges remain, such as the complexity of data collection and the need for standardized methodologies, the overall trajectory suggests a consistently expanding market fueled by the imperative to address climate change.
Carbon Accounting Market Company Market Share
Carbon Accounting Market: A Comprehensive Report (2019-2033)
This comprehensive report provides a detailed analysis of the Carbon Accounting Market, encompassing market dynamics, growth trends, regional segmentation, product landscape, key players, and future outlook. The study period covers 2019-2033, with 2025 as the base and estimated year. The report is crucial for businesses, investors, and researchers seeking a deep understanding of this rapidly evolving market. The parent market is Environmental, Social, and Governance (ESG) software, and the child market is Carbon Accounting software.
Carbon Accounting Market Dynamics & Structure
The carbon accounting market is characterized by increasing market concentration, driven by technological innovation and stringent regulatory frameworks. The market is witnessing significant mergers and acquisitions (M&A) activity, with a projected xx% increase in deal volume from 2024 to 2025. Technological innovation, primarily in AI-powered solutions and cloud-based platforms, is a key driver, albeit facing barriers such as data integration challenges and high initial investment costs. The market is segmented by end-users (Oil and Gas, Power Utilities, Construction and Infrastructure, Telecommunication, Food and Beverages, Other End Users) and type (Cloud-Based, On-Premise). Competitive product substitutes, such as traditional manual accounting methods, are gradually being phased out due to their limitations in scale and accuracy.
- Market Concentration: High, with top 5 players holding approximately xx% market share in 2024.
- Technological Innovation: AI-powered analytics, blockchain for data integrity, and automated reporting are key drivers.
- Regulatory Frameworks: Increasingly stringent regulations globally, pushing adoption across various industries.
- M&A Activity: Projected xx M&A deals in 2025, indicating consolidation and expansion.
- End-User Demographics: Strong growth in adoption across Oil & Gas and Power Utilities, followed by Construction & Infrastructure.
- Innovation Barriers: Data standardization issues, high implementation costs, and lack of skilled professionals.
Carbon Accounting Market Growth Trends & Insights
The global carbon accounting market is experiencing substantial growth, projected to reach xx Million by 2033, exhibiting a CAGR of xx% during the forecast period (2025-2033). This growth is fueled by rising environmental awareness, escalating regulatory pressure, and increased corporate social responsibility initiatives. Market penetration is expected to increase from xx% in 2024 to xx% in 2033, driven by the adoption of cloud-based solutions and user-friendly interfaces. Technological disruptions, such as the integration of AI and machine learning, are further accelerating market expansion. Consumer behavior shifts, reflecting a growing preference for sustainable practices, are significantly impacting market demand.
Dominant Regions, Countries, or Segments in Carbon Accounting Market
North America continues to assert its dominance in the global carbon accounting market, propelled by a robust regulatory framework, advanced technological infrastructure, and a history of early adoption. Europe follows closely, driven by ambitious environmental policies and a surging commitment to corporate sustainability, while the Asia-Pacific region is experiencing rapid expansion due to increasing industrialization and heightened climate change awareness. Among end-user segments, the Oil and Gas and Power Utilities sectors remain the primary adopters, largely influenced by stringent regulatory mandates and the critical need to meticulously manage their carbon footprints. Cloud-based solutions are the prevailing choice, capturing approximately 70-75% of the total market share. Their inherent scalability, cost-effectiveness, and ease of accessibility make them the preferred option for organizations of all sizes.
- North America: Leads the market due to a strong and evolving regulatory environment, high technological maturity, and a proactive approach to sustainability initiatives.
- Europe: Exhibits substantial growth driven by increasingly rigorous environmental regulations and a deeply ingrained focus on achieving corporate sustainability goals.
- Asia-Pacific: Witnesses significant market expansion fueled by rapid industrialization, escalating environmental concerns, and a growing understanding of the imperative for carbon management.
- End-User Segments: The Oil & Gas and Power Utilities sectors demonstrate the highest adoption rates, directly attributable to pressing regulatory requirements and the strategic need for proactive emissions management.
- Deployment Type: Cloud-based solutions are the market leaders, offering unparalleled scalability, cost efficiencies, and widespread accessibility.
Carbon Accounting Market Product Landscape
The carbon accounting software market is characterized by a rich and evolving product landscape. Offerings range from straightforward carbon footprint calculators designed for simplicity, to highly sophisticated platforms that leverage the power of Artificial Intelligence (AI) and Machine Learning (ML) to deliver enhanced accuracy and deeper data insights. These comprehensive solutions empower organizations with essential functionalities, including streamlined emissions data collection, precise calculation methodologies, compliant reporting capabilities, and robust verification processes. Furthermore, they provide advanced analytics to pinpoint actionable opportunities for emissions reduction. Key differentiators and selling propositions prominently feature intuitive, user-friendly interfaces, stringent data security protocols, and seamless integration with existing Enterprise Resource Planning (ERP) systems, ensuring a cohesive operational flow. The ongoing technological advancements are strategically focused on refining data accuracy, automating complex reporting procedures, and enabling real-time monitoring of carbon emissions, offering businesses unprecedented visibility and control.
Key Drivers, Barriers & Challenges in Carbon Accounting Market
Key Drivers:
- The intensifying global regulatory pressure on emissions reporting and climate disclosure is a primary catalyst for market growth.
- A significant surge in corporate sustainability initiatives and the growing prevalence of Environmental, Social, and Governance (ESG) reporting mandates are driving adoption.
- Continuous technological advancements are significantly enhancing the accuracy, automation, and accessibility of emissions data and analysis.
- Increasing demand from investors and consumers for greater environmental transparency and accountability is compelling businesses to adopt carbon accounting practices.
- The growing awareness of climate-related risks and opportunities is prompting businesses to proactively manage their environmental impact.
Challenges & Restraints:
- The substantial initial investment costs associated with implementing comprehensive carbon accounting solutions can be a significant barrier for some organizations.
- Complexities in data integration across disparate departments, legacy systems, and various data sources can hinder efficient deployment and ongoing management.
- A persistent shortage of skilled professionals with the expertise to effectively deploy, manage, and interpret carbon accounting systems poses a challenge.
- Intense competitive pressures and a fragmented market landscape can make it difficult for new entrants to gain traction and for established players to differentiate themselves.
- Ensuring data quality and consistency across different reporting frameworks and geographical locations can be a considerable undertaking.
Emerging Opportunities in Carbon Accounting Market
Significant emerging opportunities are present in currently underserved markets, particularly within the Small and Medium-sized Enterprises (SMEs) segment, which is increasingly recognizing the value and necessity of adopting carbon accounting solutions. Innovative applications, such as the seamless integration of carbon accounting into comprehensive supply chain management systems and detailed product lifecycle assessments, present substantial avenues for future growth and value creation. Furthermore, evolving consumer preferences, which increasingly favor environmentally responsible products and services, are a powerful driving force behind the demand for transparent and credible carbon accounting practices across all industries.
Growth Accelerators in the Carbon Accounting Market Industry
Strategic partnerships between technology providers and consulting firms are accelerating market growth by creating comprehensive solutions. Market expansion into developing economies, driven by increasing environmental regulations and growing awareness of sustainability, is a significant catalyst. Technological breakthroughs, particularly in AI-powered analytics and blockchain technology for data integrity, will further fuel market expansion.
Key Players Shaping the Carbon Accounting Market Market
- Normative
- Carbon Direct
- Greenly
- ENGIE Impact
- Sphera
- SINAI Technologies
- Persefoni AI
- Emitwise
- International Business Machines Corporation
- Diligent Corporation
Notable Milestones in Carbon Accounting Market Sector
- March 2024: Greenly successfully secured USD 52 million in Series B funding. This investment is earmarked for further enhancing its sophisticated carbon accounting methodologies and accelerating its global market expansion.
- March 2024: Green Project Technologies unveiled its Green Project White Label solution. This innovative offering empowers Environmental, Social, and Governance (ESG) service providers to seamlessly integrate advanced carbon accounting capabilities into their existing service portfolios, thereby expanding their value proposition.
- February 2024: Persefoni announced a significant partnership with Microsoft, integrating its carbon accounting platform with Microsoft's cloud services to offer enhanced emissions tracking and management solutions.
- January 2024: Watershed launched its new feature for Scope 3 emissions modeling, providing businesses with more granular insights into their indirect carbon impact across the value chain.
In-Depth Carbon Accounting Market Market Outlook
The carbon accounting market is poised for significant long-term growth, driven by persistent regulatory pressures, increasing corporate sustainability initiatives, and technological advancements. Strategic opportunities exist in developing customized solutions for specific industries, expanding into emerging markets, and leveraging AI and machine learning to enhance data accuracy and decision-making capabilities. The market's future potential is considerable, with continued expansion anticipated across diverse sectors and geographical regions.
Carbon Accounting Market Segmentation
-
1. Type
- 1.1. Cloud Based
- 1.2. On Premise
-
2. End Users
- 2.1. Oil and Gas
- 2.2. Power Utilities
- 2.3. Construction and Infrastructure
- 2.4. Telecommunication
- 2.5. Food and Beverages
- 2.6. Other End Users
Carbon Accounting Market Segmentation By Geography
-
1. North America
- 1.1. United States
- 1.2. Canada
- 1.3. Rest of North America
-
2. Europe
- 2.1. Germany
- 2.2. France
- 2.3. United Kingdom
- 2.4. Italy
- 2.5. Spain
- 2.6. NORDIC
- 2.7. Russia
- 2.8. Turkey
- 2.9. Rest of Europe
-
3. Asia Pacific
- 3.1. China
- 3.2. India
- 3.3. Australia
- 3.4. Japan
- 3.5. South Korea
- 3.6. Malaysia
- 3.7. Thailand
- 3.8. Indonesia
- 3.9. Vietnam
- 3.10. Rest of Asia Pacific
-
4. Middle East and Africa
- 4.1. Saudi Arabia
- 4.2. United Arab Emirates
- 4.3. Nigeria
- 4.4. Egypt
- 4.5. Qatar
- 4.6. South Africa
- 4.7. Rest of Middle East and Africa
-
5. South America
- 5.1. Brazil
- 5.2. Argentina
- 5.3. Colombia
- 5.4. Rest of South America
Carbon Accounting Market Regional Market Share
Geographic Coverage of Carbon Accounting Market
Carbon Accounting Market REPORT HIGHLIGHTS
| Aspects | Details |
|---|---|
| Study Period | 2020-2034 |
| Base Year | 2025 |
| Estimated Year | 2026 |
| Forecast Period | 2026-2034 |
| Historical Period | 2020-2025 |
| Growth Rate | CAGR of 29.33% from 2020-2034 |
| Segmentation |
|
Table of Contents
- 1. Introduction
- 1.1. Research Scope
- 1.2. Market Segmentation
- 1.3. Research Objective
- 1.4. Definitions and Assumptions
- 2. Executive Summary
- 2.1. Market Snapshot
- 3. Market Dynamics
- 3.1. Market Drivers
- 3.2. Market Restrains
- 3.3. Market Trends
- 3.4. Market Opportunities
- 4. Market Factor Analysis
- 4.1. Porters Five Forces
- 4.1.1. Bargaining Power of Suppliers
- 4.1.2. Bargaining Power of Buyers
- 4.1.3. Threat of New Entrants
- 4.1.4. Threat of Substitutes
- 4.1.5. Competitive Rivalry
- 4.2. PESTEL analysis
- 4.3. BCG Analysis
- 4.3.1. Stars (High Growth, High Market Share)
- 4.3.2. Cash Cows (Low Growth, High Market Share)
- 4.3.3. Question Mark (High Growth, Low Market Share)
- 4.3.4. Dogs (Low Growth, Low Market Share)
- 4.4. Ansoff Matrix Analysis
- 4.5. Supply Chain Analysis
- 4.6. Regulatory Landscape
- 4.7. Current Market Potential and Opportunity Assessment (TAM–SAM–SOM Framework)
- 4.8. IMR Analyst Note
- 4.1. Porters Five Forces
- 5. Market Analysis, Insights and Forecast 2021-2033
- 5.1. Market Analysis, Insights and Forecast - by Type
- 5.1.1. Cloud Based
- 5.1.2. On Premise
- 5.2. Market Analysis, Insights and Forecast - by End Users
- 5.2.1. Oil and Gas
- 5.2.2. Power Utilities
- 5.2.3. Construction and Infrastructure
- 5.2.4. Telecommunication
- 5.2.5. Food and Beverages
- 5.2.6. Other End Users
- 5.3. Market Analysis, Insights and Forecast - by Region
- 5.3.1. North America
- 5.3.2. Europe
- 5.3.3. Asia Pacific
- 5.3.4. Middle East and Africa
- 5.3.5. South America
- 5.1. Market Analysis, Insights and Forecast - by Type
- 6. Global Carbon Accounting Market Analysis, Insights and Forecast, 2021-2033
- 6.1. Market Analysis, Insights and Forecast - by Type
- 6.1.1. Cloud Based
- 6.1.2. On Premise
- 6.2. Market Analysis, Insights and Forecast - by End Users
- 6.2.1. Oil and Gas
- 6.2.2. Power Utilities
- 6.2.3. Construction and Infrastructure
- 6.2.4. Telecommunication
- 6.2.5. Food and Beverages
- 6.2.6. Other End Users
- 6.1. Market Analysis, Insights and Forecast - by Type
- 7. North America Carbon Accounting Market Analysis, Insights and Forecast, 2020-2032
- 7.1. Market Analysis, Insights and Forecast - by Type
- 7.1.1. Cloud Based
- 7.1.2. On Premise
- 7.2. Market Analysis, Insights and Forecast - by End Users
- 7.2.1. Oil and Gas
- 7.2.2. Power Utilities
- 7.2.3. Construction and Infrastructure
- 7.2.4. Telecommunication
- 7.2.5. Food and Beverages
- 7.2.6. Other End Users
- 7.1. Market Analysis, Insights and Forecast - by Type
- 8. Europe Carbon Accounting Market Analysis, Insights and Forecast, 2020-2032
- 8.1. Market Analysis, Insights and Forecast - by Type
- 8.1.1. Cloud Based
- 8.1.2. On Premise
- 8.2. Market Analysis, Insights and Forecast - by End Users
- 8.2.1. Oil and Gas
- 8.2.2. Power Utilities
- 8.2.3. Construction and Infrastructure
- 8.2.4. Telecommunication
- 8.2.5. Food and Beverages
- 8.2.6. Other End Users
- 8.1. Market Analysis, Insights and Forecast - by Type
- 9. Asia Pacific Carbon Accounting Market Analysis, Insights and Forecast, 2020-2032
- 9.1. Market Analysis, Insights and Forecast - by Type
- 9.1.1. Cloud Based
- 9.1.2. On Premise
- 9.2. Market Analysis, Insights and Forecast - by End Users
- 9.2.1. Oil and Gas
- 9.2.2. Power Utilities
- 9.2.3. Construction and Infrastructure
- 9.2.4. Telecommunication
- 9.2.5. Food and Beverages
- 9.2.6. Other End Users
- 9.1. Market Analysis, Insights and Forecast - by Type
- 10. Middle East and Africa Carbon Accounting Market Analysis, Insights and Forecast, 2020-2032
- 10.1. Market Analysis, Insights and Forecast - by Type
- 10.1.1. Cloud Based
- 10.1.2. On Premise
- 10.2. Market Analysis, Insights and Forecast - by End Users
- 10.2.1. Oil and Gas
- 10.2.2. Power Utilities
- 10.2.3. Construction and Infrastructure
- 10.2.4. Telecommunication
- 10.2.5. Food and Beverages
- 10.2.6. Other End Users
- 10.1. Market Analysis, Insights and Forecast - by Type
- 11. South America Carbon Accounting Market Analysis, Insights and Forecast, 2020-2032
- 11.1. Market Analysis, Insights and Forecast - by Type
- 11.1.1. Cloud Based
- 11.1.2. On Premise
- 11.2. Market Analysis, Insights and Forecast - by End Users
- 11.2.1. Oil and Gas
- 11.2.2. Power Utilities
- 11.2.3. Construction and Infrastructure
- 11.2.4. Telecommunication
- 11.2.5. Food and Beverages
- 11.2.6. Other End Users
- 11.1. Market Analysis, Insights and Forecast - by Type
- 12. Competitive Analysis
- 12.1. Company Profiles
- 12.1.1 Normative
- 12.1.1.1. Company Overview
- 12.1.1.2. Products
- 12.1.1.3. Company Financials
- 12.1.1.4. SWOT Analysis
- 12.1.2 Carbon Direct
- 12.1.2.1. Company Overview
- 12.1.2.2. Products
- 12.1.2.3. Company Financials
- 12.1.2.4. SWOT Analysis
- 12.1.3 Greenly
- 12.1.3.1. Company Overview
- 12.1.3.2. Products
- 12.1.3.3. Company Financials
- 12.1.3.4. SWOT Analysis
- 12.1.4 ENGIE Impact
- 12.1.4.1. Company Overview
- 12.1.4.2. Products
- 12.1.4.3. Company Financials
- 12.1.4.4. SWOT Analysis
- 12.1.5 Sphera
- 12.1.5.1. Company Overview
- 12.1.5.2. Products
- 12.1.5.3. Company Financials
- 12.1.5.4. SWOT Analysis
- 12.1.6 SINAI Technologies
- 12.1.6.1. Company Overview
- 12.1.6.2. Products
- 12.1.6.3. Company Financials
- 12.1.6.4. SWOT Analysis
- 12.1.7 Persefoni AI
- 12.1.7.1. Company Overview
- 12.1.7.2. Products
- 12.1.7.3. Company Financials
- 12.1.7.4. SWOT Analysis
- 12.1.8 Emitwise
- 12.1.8.1. Company Overview
- 12.1.8.2. Products
- 12.1.8.3. Company Financials
- 12.1.8.4. SWOT Analysis
- 12.1.9 International Business Machines Corporation
- 12.1.9.1. Company Overview
- 12.1.9.2. Products
- 12.1.9.3. Company Financials
- 12.1.9.4. SWOT Analysis
- 12.1.10 Diligent Corporation
- 12.1.10.1. Company Overview
- 12.1.10.2. Products
- 12.1.10.3. Company Financials
- 12.1.10.4. SWOT Analysis
- 12.1.1 Normative
- 12.2. Market Entropy
- 12.2.1 Company's Key Areas Served
- 12.2.2 Recent Developments
- 12.3. Company Market Share Analysis 2025
- 12.3.1 Top 5 Companies Market Share Analysis
- 12.3.2 Top 3 Companies Market Share Analysis
- 12.4. List of Potential Customers
- 13. Research Methodology
List of Figures
- Figure 1: Global Carbon Accounting Market Revenue Breakdown (Million, %) by Region 2025 & 2033
- Figure 2: North America Carbon Accounting Market Revenue (Million), by Type 2025 & 2033
- Figure 3: North America Carbon Accounting Market Revenue Share (%), by Type 2025 & 2033
- Figure 4: North America Carbon Accounting Market Revenue (Million), by End Users 2025 & 2033
- Figure 5: North America Carbon Accounting Market Revenue Share (%), by End Users 2025 & 2033
- Figure 6: North America Carbon Accounting Market Revenue (Million), by Country 2025 & 2033
- Figure 7: North America Carbon Accounting Market Revenue Share (%), by Country 2025 & 2033
- Figure 8: Europe Carbon Accounting Market Revenue (Million), by Type 2025 & 2033
- Figure 9: Europe Carbon Accounting Market Revenue Share (%), by Type 2025 & 2033
- Figure 10: Europe Carbon Accounting Market Revenue (Million), by End Users 2025 & 2033
- Figure 11: Europe Carbon Accounting Market Revenue Share (%), by End Users 2025 & 2033
- Figure 12: Europe Carbon Accounting Market Revenue (Million), by Country 2025 & 2033
- Figure 13: Europe Carbon Accounting Market Revenue Share (%), by Country 2025 & 2033
- Figure 14: Asia Pacific Carbon Accounting Market Revenue (Million), by Type 2025 & 2033
- Figure 15: Asia Pacific Carbon Accounting Market Revenue Share (%), by Type 2025 & 2033
- Figure 16: Asia Pacific Carbon Accounting Market Revenue (Million), by End Users 2025 & 2033
- Figure 17: Asia Pacific Carbon Accounting Market Revenue Share (%), by End Users 2025 & 2033
- Figure 18: Asia Pacific Carbon Accounting Market Revenue (Million), by Country 2025 & 2033
- Figure 19: Asia Pacific Carbon Accounting Market Revenue Share (%), by Country 2025 & 2033
- Figure 20: Middle East and Africa Carbon Accounting Market Revenue (Million), by Type 2025 & 2033
- Figure 21: Middle East and Africa Carbon Accounting Market Revenue Share (%), by Type 2025 & 2033
- Figure 22: Middle East and Africa Carbon Accounting Market Revenue (Million), by End Users 2025 & 2033
- Figure 23: Middle East and Africa Carbon Accounting Market Revenue Share (%), by End Users 2025 & 2033
- Figure 24: Middle East and Africa Carbon Accounting Market Revenue (Million), by Country 2025 & 2033
- Figure 25: Middle East and Africa Carbon Accounting Market Revenue Share (%), by Country 2025 & 2033
- Figure 26: South America Carbon Accounting Market Revenue (Million), by Type 2025 & 2033
- Figure 27: South America Carbon Accounting Market Revenue Share (%), by Type 2025 & 2033
- Figure 28: South America Carbon Accounting Market Revenue (Million), by End Users 2025 & 2033
- Figure 29: South America Carbon Accounting Market Revenue Share (%), by End Users 2025 & 2033
- Figure 30: South America Carbon Accounting Market Revenue (Million), by Country 2025 & 2033
- Figure 31: South America Carbon Accounting Market Revenue Share (%), by Country 2025 & 2033
List of Tables
- Table 1: Global Carbon Accounting Market Revenue Million Forecast, by Type 2020 & 2033
- Table 2: Global Carbon Accounting Market Revenue Million Forecast, by End Users 2020 & 2033
- Table 3: Global Carbon Accounting Market Revenue Million Forecast, by Region 2020 & 2033
- Table 4: Global Carbon Accounting Market Revenue Million Forecast, by Type 2020 & 2033
- Table 5: Global Carbon Accounting Market Revenue Million Forecast, by End Users 2020 & 2033
- Table 6: Global Carbon Accounting Market Revenue Million Forecast, by Country 2020 & 2033
- Table 7: United States Carbon Accounting Market Revenue (Million) Forecast, by Application 2020 & 2033
- Table 8: Canada Carbon Accounting Market Revenue (Million) Forecast, by Application 2020 & 2033
- Table 9: Rest of North America Carbon Accounting Market Revenue (Million) Forecast, by Application 2020 & 2033
- Table 10: Global Carbon Accounting Market Revenue Million Forecast, by Type 2020 & 2033
- Table 11: Global Carbon Accounting Market Revenue Million Forecast, by End Users 2020 & 2033
- Table 12: Global Carbon Accounting Market Revenue Million Forecast, by Country 2020 & 2033
- Table 13: Germany Carbon Accounting Market Revenue (Million) Forecast, by Application 2020 & 2033
- Table 14: France Carbon Accounting Market Revenue (Million) Forecast, by Application 2020 & 2033
- Table 15: United Kingdom Carbon Accounting Market Revenue (Million) Forecast, by Application 2020 & 2033
- Table 16: Italy Carbon Accounting Market Revenue (Million) Forecast, by Application 2020 & 2033
- Table 17: Spain Carbon Accounting Market Revenue (Million) Forecast, by Application 2020 & 2033
- Table 18: NORDIC Carbon Accounting Market Revenue (Million) Forecast, by Application 2020 & 2033
- Table 19: Russia Carbon Accounting Market Revenue (Million) Forecast, by Application 2020 & 2033
- Table 20: Turkey Carbon Accounting Market Revenue (Million) Forecast, by Application 2020 & 2033
- Table 21: Rest of Europe Carbon Accounting Market Revenue (Million) Forecast, by Application 2020 & 2033
- Table 22: Global Carbon Accounting Market Revenue Million Forecast, by Type 2020 & 2033
- Table 23: Global Carbon Accounting Market Revenue Million Forecast, by End Users 2020 & 2033
- Table 24: Global Carbon Accounting Market Revenue Million Forecast, by Country 2020 & 2033
- Table 25: China Carbon Accounting Market Revenue (Million) Forecast, by Application 2020 & 2033
- Table 26: India Carbon Accounting Market Revenue (Million) Forecast, by Application 2020 & 2033
- Table 27: Australia Carbon Accounting Market Revenue (Million) Forecast, by Application 2020 & 2033
- Table 28: Japan Carbon Accounting Market Revenue (Million) Forecast, by Application 2020 & 2033
- Table 29: South Korea Carbon Accounting Market Revenue (Million) Forecast, by Application 2020 & 2033
- Table 30: Malaysia Carbon Accounting Market Revenue (Million) Forecast, by Application 2020 & 2033
- Table 31: Thailand Carbon Accounting Market Revenue (Million) Forecast, by Application 2020 & 2033
- Table 32: Indonesia Carbon Accounting Market Revenue (Million) Forecast, by Application 2020 & 2033
- Table 33: Vietnam Carbon Accounting Market Revenue (Million) Forecast, by Application 2020 & 2033
- Table 34: Rest of Asia Pacific Carbon Accounting Market Revenue (Million) Forecast, by Application 2020 & 2033
- Table 35: Global Carbon Accounting Market Revenue Million Forecast, by Type 2020 & 2033
- Table 36: Global Carbon Accounting Market Revenue Million Forecast, by End Users 2020 & 2033
- Table 37: Global Carbon Accounting Market Revenue Million Forecast, by Country 2020 & 2033
- Table 38: Saudi Arabia Carbon Accounting Market Revenue (Million) Forecast, by Application 2020 & 2033
- Table 39: United Arab Emirates Carbon Accounting Market Revenue (Million) Forecast, by Application 2020 & 2033
- Table 40: Nigeria Carbon Accounting Market Revenue (Million) Forecast, by Application 2020 & 2033
- Table 41: Egypt Carbon Accounting Market Revenue (Million) Forecast, by Application 2020 & 2033
- Table 42: Qatar Carbon Accounting Market Revenue (Million) Forecast, by Application 2020 & 2033
- Table 43: South Africa Carbon Accounting Market Revenue (Million) Forecast, by Application 2020 & 2033
- Table 44: Rest of Middle East and Africa Carbon Accounting Market Revenue (Million) Forecast, by Application 2020 & 2033
- Table 45: Global Carbon Accounting Market Revenue Million Forecast, by Type 2020 & 2033
- Table 46: Global Carbon Accounting Market Revenue Million Forecast, by End Users 2020 & 2033
- Table 47: Global Carbon Accounting Market Revenue Million Forecast, by Country 2020 & 2033
- Table 48: Brazil Carbon Accounting Market Revenue (Million) Forecast, by Application 2020 & 2033
- Table 49: Argentina Carbon Accounting Market Revenue (Million) Forecast, by Application 2020 & 2033
- Table 50: Colombia Carbon Accounting Market Revenue (Million) Forecast, by Application 2020 & 2033
- Table 51: Rest of South America Carbon Accounting Market Revenue (Million) Forecast, by Application 2020 & 2033
Frequently Asked Questions
1. What is the projected Compound Annual Growth Rate (CAGR) of the Carbon Accounting Market?
The projected CAGR is approximately 29.33%.
2. Which companies are prominent players in the Carbon Accounting Market?
Key companies in the market include Normative, Carbon Direct, Greenly, ENGIE Impact, Sphera, SINAI Technologies, Persefoni AI, Emitwise, International Business Machines Corporation, Diligent Corporation.
3. What are the main segments of the Carbon Accounting Market?
The market segments include Type, End Users.
4. Can you provide details about the market size?
The market size is estimated to be USD 16.98 Million as of 2022.
5. What are some drivers contributing to market growth?
4.; Corporate Sustainability Goals4.; Stringent Regultions and Compliance.
6. What are the notable trends driving market growth?
The Power Utilities Segment to Witness Significant Growth.
7. Are there any restraints impacting market growth?
4.; High Complexity in Carbon Accounting.
8. Can you provide examples of recent developments in the market?
March 2024: Greenly, a significant carbon accounting startup, announced that it secured funding for its series B round. The company raised USD 52 million in its Series B round. Investors aim to develop more precise carbon accounting methodologies and accurately deploy these solutions to increase the company’s market share globally.
9. What pricing options are available for accessing the report?
Pricing options include single-user, multi-user, and enterprise licenses priced at USD 4750, USD 5250, and USD 8750 respectively.
10. Is the market size provided in terms of value or volume?
The market size is provided in terms of value, measured in Million.
11. Are there any specific market keywords associated with the report?
Yes, the market keyword associated with the report is "Carbon Accounting Market," which aids in identifying and referencing the specific market segment covered.
12. How do I determine which pricing option suits my needs best?
The pricing options vary based on user requirements and access needs. Individual users may opt for single-user licenses, while businesses requiring broader access may choose multi-user or enterprise licenses for cost-effective access to the report.
13. Are there any additional resources or data provided in the Carbon Accounting Market report?
While the report offers comprehensive insights, it's advisable to review the specific contents or supplementary materials provided to ascertain if additional resources or data are available.
14. How can I stay updated on further developments or reports in the Carbon Accounting Market?
To stay informed about further developments, trends, and reports in the Carbon Accounting Market, consider subscribing to industry newsletters, following relevant companies and organizations, or regularly checking reputable industry news sources and publications.
Methodology
Step 1 - Identification of Relevant Samples Size from Population Database


Step 2 - Approaches for Defining Global Market Size (Value, Volume* & Price*)

Note*: In applicable scenarios
Step 3 - Data Sources
Primary Research
- Web Analytics
- Survey Reports
- Research Institute
- Latest Research Reports
- Opinion Leaders
Secondary Research
- Annual Reports
- White Paper
- Latest Press Release
- Industry Association
- Paid Database
- Investor Presentations

Step 4 - Data Triangulation
Involves using different sources of information in order to increase the validity of a study
These sources are likely to be stakeholders in a program - participants, other researchers, program staff, other community members, and so on.
Then we put all data in single framework & apply various statistical tools to find out the dynamic on the market.
During the analysis stage, feedback from the stakeholder groups would be compared to determine areas of agreement as well as areas of divergence