

Key Insights
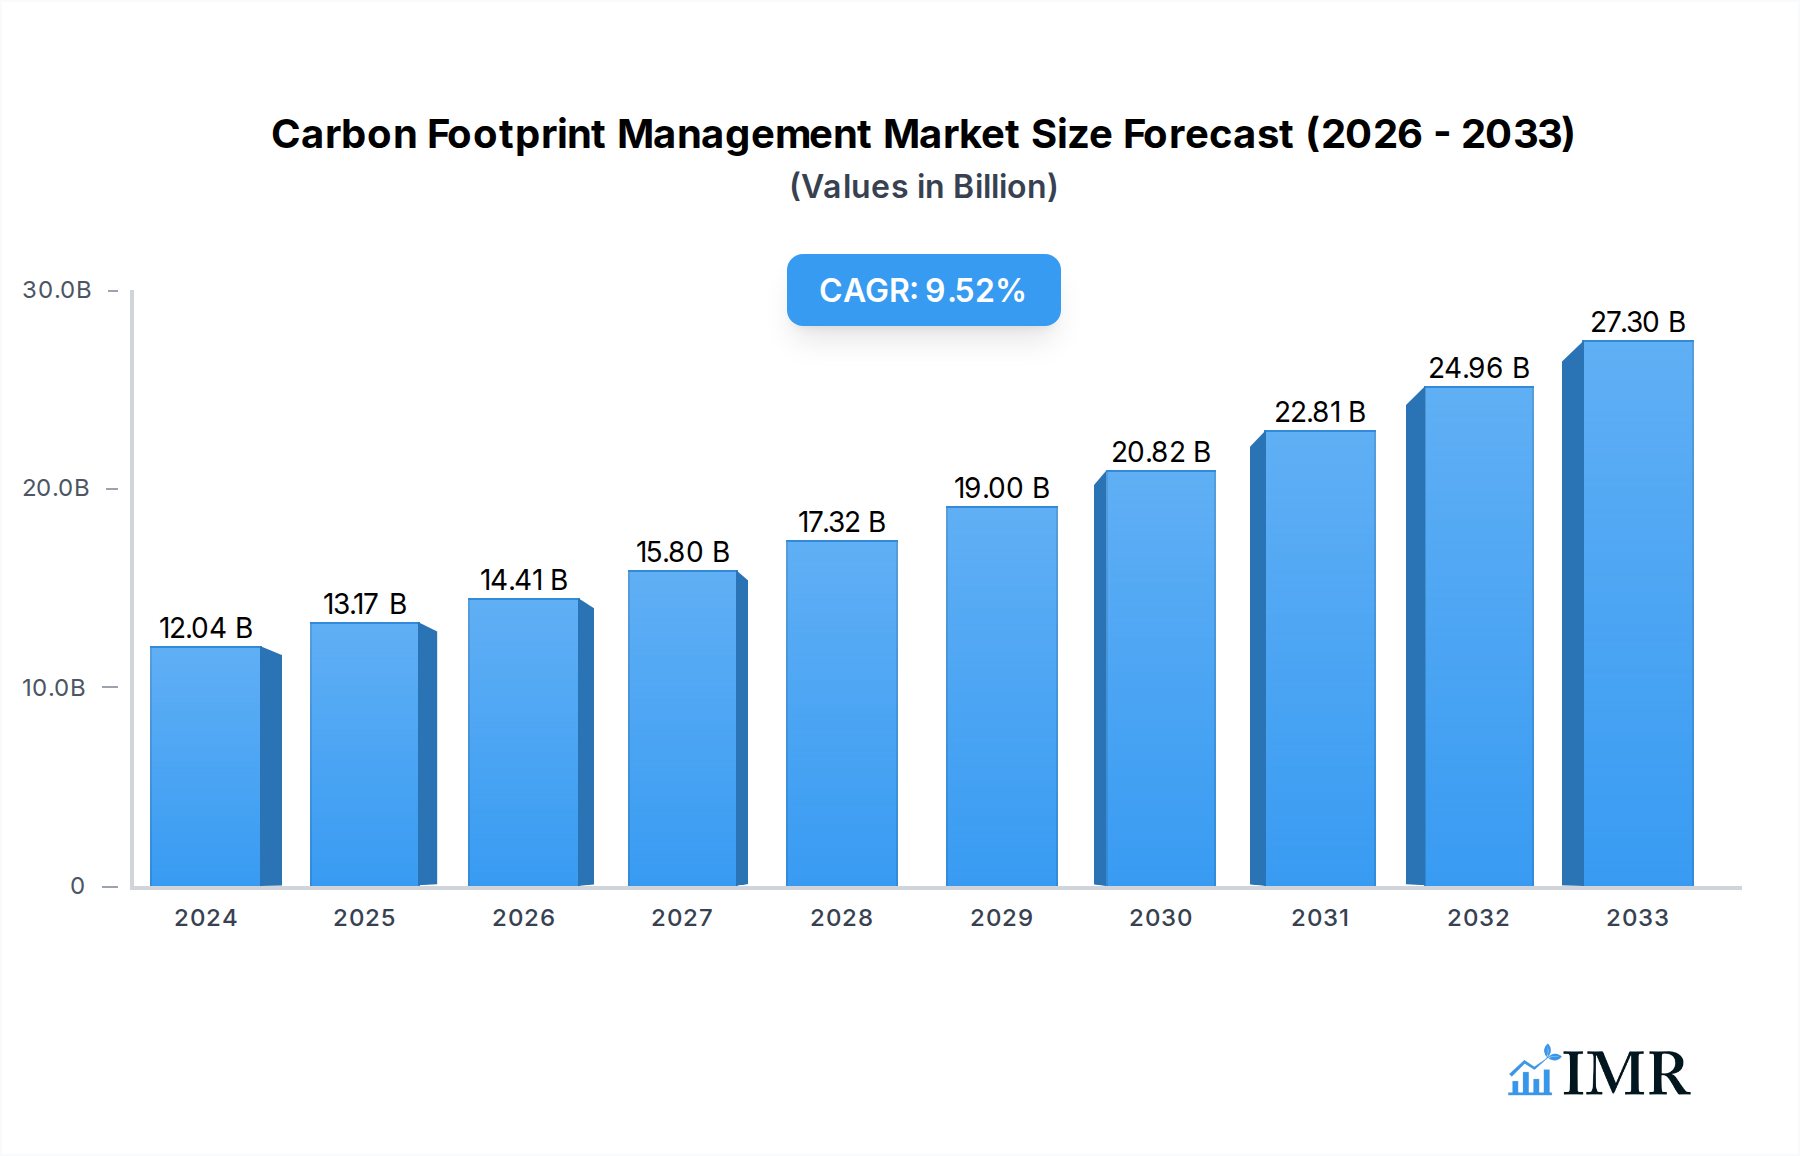
The global Carbon Footprint Management market is projected for significant expansion, reaching an estimated $12.04 billion in 2024. This growth is driven by an increasing global awareness of climate change and the imperative for businesses to reduce their environmental impact. Regulatory mandates from governments worldwide, coupled with growing investor pressure for Environmental, Social, and Governance (ESG) performance, are compelling organizations to adopt sophisticated carbon footprint management solutions. The market is experiencing a robust Compound Annual Growth Rate (CAGR) of 9.3%, indicating a sustained upward trajectory throughout the forecast period. Key drivers include the need for enhanced corporate sustainability reporting, the pursuit of operational efficiencies through resource optimization, and the desire to build stronger brand reputations among environmentally conscious consumers. The software segment is expected to lead the market, offering advanced analytics, reporting tools, and carbon accounting capabilities, while services will support implementation, consulting, and ongoing management of carbon reduction strategies.

Carbon Footprint Management Market Size (In Billion)
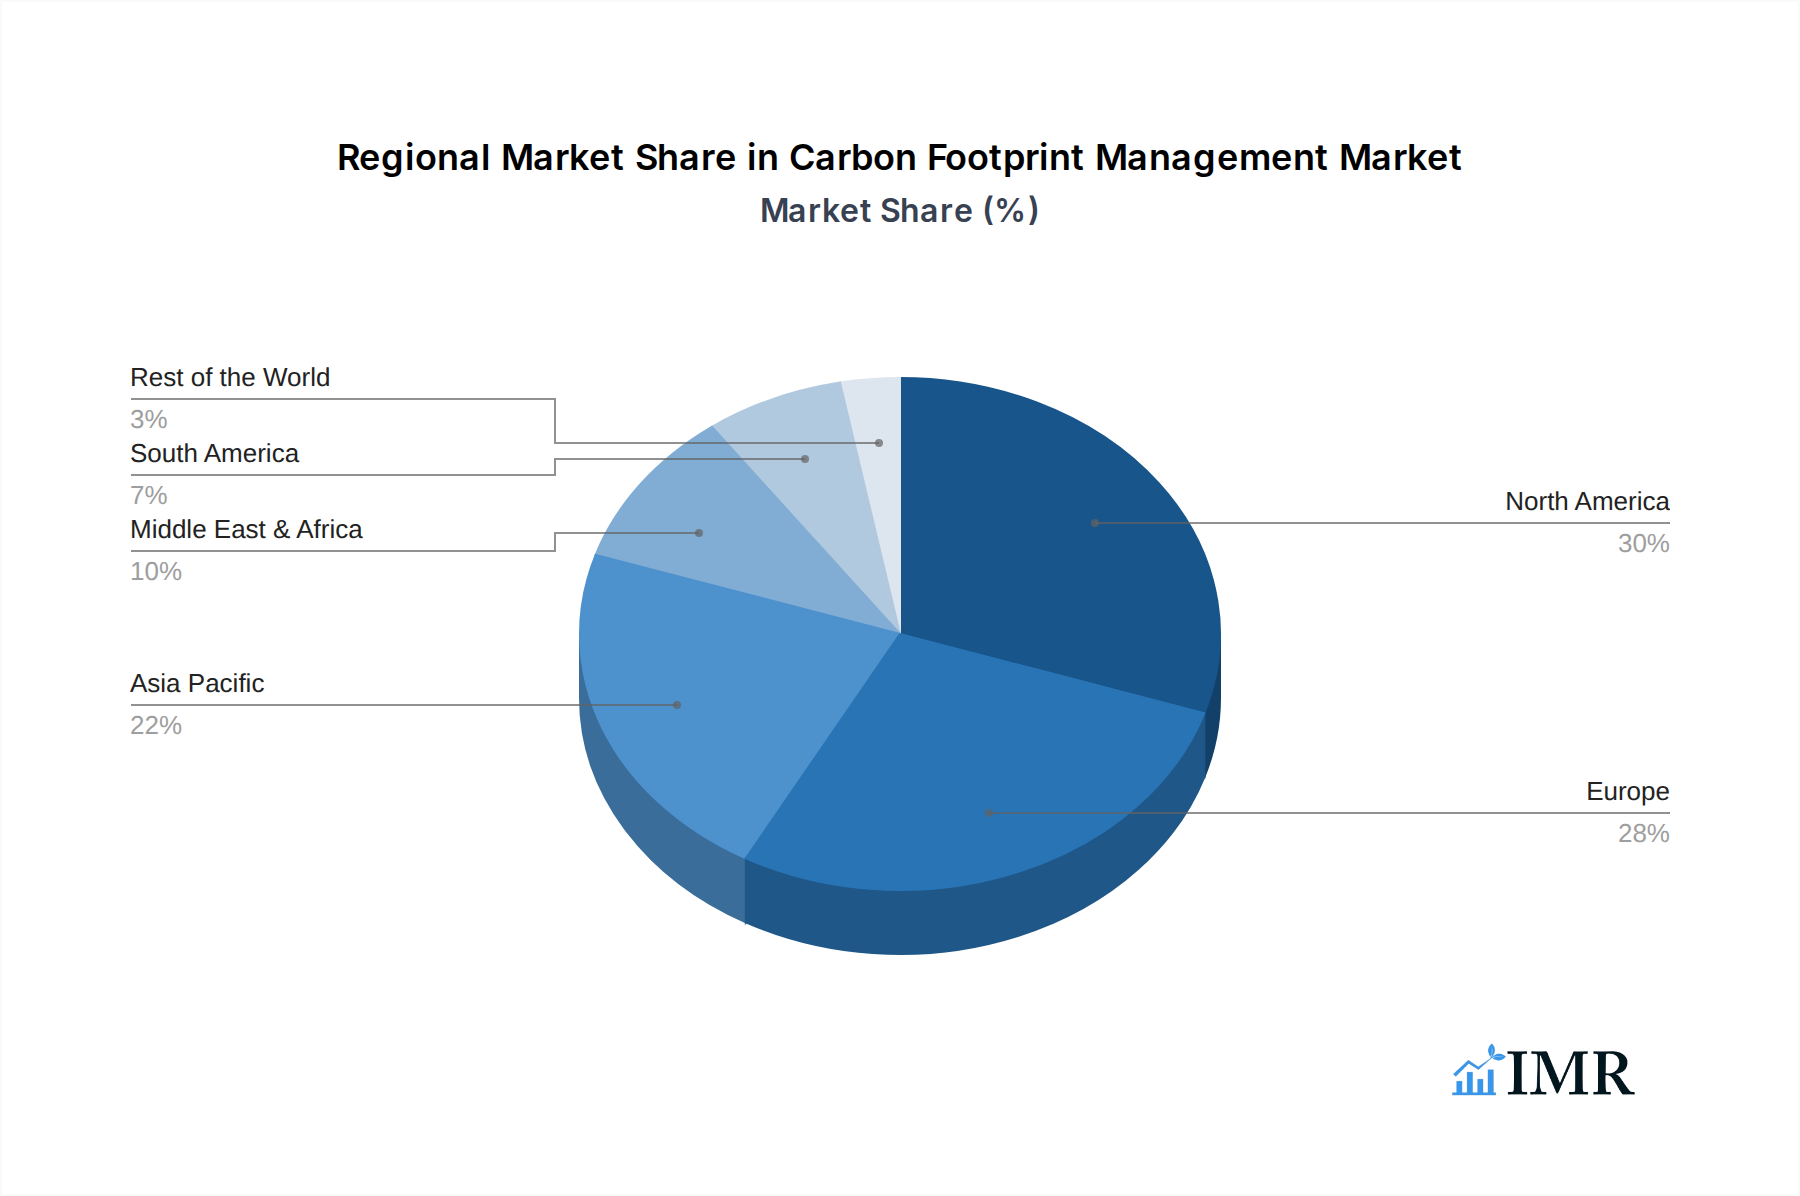
The expanding scope of carbon footprint management is evident across diverse industries. The Manufacturing and Energy & Utilities sectors are at the forefront, facing direct scrutiny and stringent regulations regarding emissions. The Residential & Commercial Buildings, Transportation & Logistics, and IT & Telecom sectors are also showing accelerated adoption, driven by both compliance needs and the realization of cost savings through energy efficiency and sustainable practices. Geographically, North America and Europe currently dominate the market, owing to established regulatory frameworks and a mature corporate sustainability landscape. However, the Asia Pacific region is poised for the most substantial growth, fueled by rapid industrialization, increasing environmental consciousness, and proactive government policies aimed at achieving carbon neutrality. Challenges such as the complexity of data collection and integration, as well as the initial investment costs for comprehensive solutions, are being progressively addressed through technological advancements and the availability of specialized service providers, further bolstering market expansion.
Carbon Footprint Management Company Market Share
Carbon Footprint Management Market Report: Navigating Sustainability and Corporate Responsibility
This comprehensive market research report offers an in-depth analysis of the global Carbon Footprint Management market, a rapidly expanding sector driven by increasing environmental consciousness, stringent regulations, and corporate sustainability initiatives. The report covers a detailed study period from 2019 to 2033, with a base year of 2025, providing granular insights into market dynamics, growth trends, regional dominance, product landscapes, and key players. Designed for industry professionals, sustainability officers, investors, and policymakers, this report equips stakeholders with the strategic intelligence needed to navigate the evolving carbon management landscape and capitalize on emerging opportunities.
Carbon Footprint Management Market Dynamics & Structure
The Carbon Footprint Management market is characterized by a moderately concentrated structure, with leading players like Schneider Electric and IHS Markit holding significant market shares. Technological innovation serves as a primary driver, fueled by advancements in data analytics, IoT integration for real-time emissions tracking, and sophisticated AI algorithms for predictive modeling and optimization. The evolving global regulatory frameworks, including carbon pricing mechanisms, emissions trading schemes, and mandatory reporting standards, are compelling businesses to adopt robust carbon management solutions. Competitive product substitutes are emerging, ranging from in-house developed tracking systems to consulting services, but dedicated software and comprehensive service platforms offer greater efficiency and compliance assurance. End-user demographics are diversifying, with a growing demand from SMEs alongside large enterprises across all sectors. Mergers and acquisitions (M&A) are a prominent trend as established companies seek to consolidate their market position, acquire innovative technologies, and expand their service offerings.
- Market Concentration: Moderately concentrated, with a few key players dominating a significant portion of the market.
- Technological Innovation: Driven by AI, IoT, big data analytics, and cloud-based platforms.
- Regulatory Frameworks: Increasingly stringent global regulations and reporting requirements.
- Competitive Substitutes: In-house solutions and consulting services, though integrated platforms offer superior functionality.
- End-User Diversification: Growing adoption across large enterprises and small-to-medium enterprises (SMEs).
- M&A Trends: Active consolidation through acquisitions to enhance capabilities and market reach.
Carbon Footprint Management Growth Trends & Insights
The global Carbon Footprint Management market is poised for significant expansion, projected to grow from approximately \$15.7 billion in 2024 to an estimated \$48.9 billion by 2033, exhibiting a Compound Annual Growth Rate (CAGR) of 13.5%. This robust growth is underpinned by a confluence of factors including escalating investor demand for ESG (Environmental, Social, and Governance) performance, increasing public and consumer awareness of climate change impacts, and the growing imperative for businesses to demonstrate their commitment to sustainability. Adoption rates for carbon management solutions are accelerating across industries as organizations recognize the financial and reputational benefits of effective emissions tracking, reduction, and reporting. Technological disruptions, such as the integration of blockchain for supply chain transparency in emissions data and the development of more user-friendly, AI-powered analytics tools, are further accelerating market penetration. Consumer behavior shifts, with a preference for brands demonstrating strong environmental responsibility, are compelling businesses to prioritize their carbon footprint. The market penetration is currently at approximately 25% of its potential, indicating substantial room for further growth.
Dominant Regions, Countries, or Segments in Carbon Footprint Management
North America currently dominates the Carbon Footprint Management market, driven by stringent environmental regulations, a strong focus on corporate social responsibility, and the presence of a large number of multinational corporations with advanced sustainability programs. The United States, in particular, plays a pivotal role, with significant investments in green technologies and a well-established framework for emissions reporting. Europe follows closely, with the European Union’s ambitious climate targets and initiatives like the Emissions Trading System (ETS) compelling widespread adoption of carbon management solutions. The Manufacturing segment emerges as a dominant application within the parent market, accounting for approximately 28% of the market share. This dominance is attributed to the inherent energy intensity and significant emissions associated with manufacturing processes, necessitating robust tracking and reduction strategies. Companies in this sector are actively seeking software and services to optimize energy consumption, identify emission hotspots, and comply with industry-specific environmental mandates. The Software type segment, representing about 60% of the market, is also a key driver of growth, offering scalable, data-driven solutions for emissions monitoring, analysis, and reporting.
- Dominant Region: North America, followed by Europe.
- Key Country: United States within North America.
- Dominant Application Segment: Manufacturing (approx. 28% market share).
- Key Drivers: High energy consumption, regulatory compliance, operational efficiency mandates.
- Dominant Type Segment: Software (approx. 60% market share).
- Key Drivers: Scalability, data-driven insights, automated reporting, integration capabilities.
- Growth Potential: Significant untapped potential in emerging economies and other application segments like Energy and Utilities and Transportation and Logistics.
Carbon Footprint Management Product Landscape
The Carbon Footprint Management product landscape is characterized by continuous innovation aimed at enhancing data accuracy, streamlining reporting processes, and providing actionable insights for emission reduction. Solutions now feature advanced analytics capabilities, enabling granular tracking of Scope 1, 2, and 3 emissions across entire value chains. Integration with existing enterprise resource planning (ERP) systems and IoT devices is a common differentiator, facilitating real-time data capture and automated updates. Key advancements include AI-powered predictive modeling for identifying emission reduction opportunities and sophisticated visualization tools that present complex data in easily digestible formats. Performance metrics are increasingly focused on ease of use, reporting accuracy, scalability, and the ability to support various international sustainability reporting standards. Unique selling propositions often revolve around the comprehensiveness of the platform, its ability to provide tailored solutions for specific industry needs, and strong customer support.
Key Drivers, Barriers & Challenges in Carbon Footprint Management
Key Drivers:
- Regulatory Compliance: Increasing global and national mandates for emissions reporting and reduction are compelling adoption.
- Corporate Sustainability Goals: Growing commitment from businesses to achieve net-zero targets and enhance ESG performance.
- Investor and Stakeholder Pressure: Demand for transparency and demonstrable climate action from investors, consumers, and employees.
- Technological Advancements: Improved data analytics, AI, and IoT capabilities are making carbon management more efficient and effective.
- Cost Savings: Identification of energy efficiency opportunities leading to operational cost reductions.
Barriers & Challenges:
- Data Collection and Accuracy: Challenges in gathering accurate and comprehensive emissions data, especially for Scope 3 emissions, are significant.
- Integration Complexity: Integrating new carbon management software with legacy IT systems can be complex and costly.
- Lack of Standardization: Inconsistent reporting frameworks and methodologies across different regions and industries.
- Initial Investment Costs: The upfront cost of implementing sophisticated carbon management software and services can be a barrier for smaller organizations.
- Internal Expertise: A shortage of skilled professionals with expertise in carbon accounting and management.
- Supply Chain Complexity: Measuring and managing emissions across extended and intricate supply chains presents a considerable challenge.
Emerging Opportunities in Carbon Footprint Management
Emerging opportunities in the Carbon Footprint Management sector lie in the development of specialized solutions for emerging industries like the circular economy and sustainable agriculture. The increasing focus on Scope 3 emissions presents a significant opportunity for platforms that can effectively map and manage supply chain emissions through advanced data analytics and collaboration tools. Furthermore, the growing demand for carbon accounting software that integrates with renewable energy management systems and smart grid technologies offers substantial growth potential. The rise of ESG investing and the pressure to achieve net-zero targets are also creating demand for more sophisticated reporting and verification tools, including blockchain-based solutions for enhanced transparency and traceability of carbon credits.
Growth Accelerators in the Carbon Footprint Management Industry
Several key catalysts are accelerating growth in the Carbon Footprint Management industry. Technological breakthroughs, particularly in Artificial Intelligence and Machine Learning, are enabling more accurate emissions forecasting, anomaly detection, and personalized reduction strategies. Strategic partnerships between software providers and consulting firms are expanding market reach and offering comprehensive solutions that address both technological and strategic aspects of carbon management. Furthermore, the increasing adoption of climate disclosure frameworks, such as the Task Force on Climate-related Financial Disclosures (TCFD), is standardizing reporting requirements and driving demand for robust management systems. Government incentives and subsidies for adopting green technologies also play a crucial role in accelerating the transition towards sustainable business practices.
Key Players Shaping the Carbon Footprint Management Market
- Schneider Electric
- IHS Markit
- Enablon
- Ecova
- Enviance
- Firstcarbon Solutions
- Greenstone
- ProcessMAP
- Thinkstep
- Verisae
Notable Milestones in Carbon Footprint Management Sector
- 2019: Increased adoption of Science Based Targets initiative (SBTi) by corporations globally.
- 2020: Growing emphasis on Scope 3 emissions reporting due to supply chain disruptions and heightened awareness.
- 2021: Launch of advanced AI-powered analytics in carbon management platforms for predictive insights.
- 2022: Increased M&A activity as larger companies acquire specialized carbon management technology firms.
- 2023: Introduction of more integrated ESG reporting software, combining carbon management with other sustainability metrics.
- 2024 (Est.): Further development of industry-specific carbon accounting solutions and enhanced focus on supply chain transparency.
In-Depth Carbon Footprint Management Market Outlook
The future market outlook for Carbon Footprint Management is exceptionally strong, driven by an irreversible global commitment to sustainability. Growth accelerators such as continued technological innovation in AI and IoT, strategic collaborations between technology providers and industry experts, and proactive market expansion into underserved regions will propel the market forward. The increasing regulatory push for net-zero targets and the growing demand for transparent ESG reporting will solidify the necessity of comprehensive carbon management solutions. Businesses that proactively invest in robust carbon footprint management systems will not only ensure compliance but also unlock significant opportunities for operational efficiencies, enhanced brand reputation, and long-term competitive advantage in the evolving global economy.
Carbon Footprint Management Segmentation
-
1. Application
- 1.1. Manufacturing
- 1.2. Energy and Utilities
- 1.3. Residential and Commercial Buildings
- 1.4. Transportation and Logistics
- 1.5. IT and Telecom
-
2. Types
- 2.1. Software
- 2.2. Service
Carbon Footprint Management Segmentation By Geography
-
1. North America
- 1.1. United States
- 1.2. Canada
- 1.3. Mexico
-
2. South America
- 2.1. Brazil
- 2.2. Argentina
- 2.3. Rest of South America
-
3. Europe
- 3.1. United Kingdom
- 3.2. Germany
- 3.3. France
- 3.4. Italy
- 3.5. Spain
- 3.6. Russia
- 3.7. Benelux
- 3.8. Nordics
- 3.9. Rest of Europe
-
4. Middle East & Africa
- 4.1. Turkey
- 4.2. Israel
- 4.3. GCC
- 4.4. North Africa
- 4.5. South Africa
- 4.6. Rest of Middle East & Africa
-
5. Asia Pacific
- 5.1. China
- 5.2. India
- 5.3. Japan
- 5.4. South Korea
- 5.5. ASEAN
- 5.6. Oceania
- 5.7. Rest of Asia Pacific
Carbon Footprint Management Regional Market Share
Geographic Coverage of Carbon Footprint Management
Carbon Footprint Management REPORT HIGHLIGHTS
| Aspects | Details |
|---|---|
| Study Period | 2020-2034 |
| Base Year | 2025 |
| Estimated Year | 2026 |
| Forecast Period | 2026-2034 |
| Historical Period | 2020-2025 |
| Growth Rate | CAGR of 9.3% from 2020-2034 |
| Segmentation |
|
Table of Contents
- 1. Introduction
- 1.1. Research Scope
- 1.2. Market Segmentation
- 1.3. Research Objective
- 1.4. Definitions and Assumptions
- 2. Executive Summary
- 2.1. Market Snapshot
- 3. Market Dynamics
- 3.1. Market Drivers
- 3.2. Market Restrains
- 3.3. Market Trends
- 3.4. Market Opportunities
- 4. Market Factor Analysis
- 4.1. Porters Five Forces
- 4.1.1. Bargaining Power of Suppliers
- 4.1.2. Bargaining Power of Buyers
- 4.1.3. Threat of New Entrants
- 4.1.4. Threat of Substitutes
- 4.1.5. Competitive Rivalry
- 4.2. PESTEL analysis
- 4.3. BCG Analysis
- 4.3.1. Stars (High Growth, High Market Share)
- 4.3.2. Cash Cows (Low Growth, High Market Share)
- 4.3.3. Question Mark (High Growth, Low Market Share)
- 4.3.4. Dogs (Low Growth, Low Market Share)
- 4.4. Ansoff Matrix Analysis
- 4.5. Supply Chain Analysis
- 4.6. Regulatory Landscape
- 4.7. Current Market Potential and Opportunity Assessment (TAM–SAM–SOM Framework)
- 4.8. IMR Analyst Note
- 4.1. Porters Five Forces
- 5. Market Analysis, Insights and Forecast 2021-2033
- 5.1. Market Analysis, Insights and Forecast - by Application
- 5.1.1. Manufacturing
- 5.1.2. Energy and Utilities
- 5.1.3. Residential and Commercial Buildings
- 5.1.4. Transportation and Logistics
- 5.1.5. IT and Telecom
- 5.2. Market Analysis, Insights and Forecast - by Types
- 5.2.1. Software
- 5.2.2. Service
- 5.3. Market Analysis, Insights and Forecast - by Region
- 5.3.1. North America
- 5.3.2. South America
- 5.3.3. Europe
- 5.3.4. Middle East & Africa
- 5.3.5. Asia Pacific
- 5.1. Market Analysis, Insights and Forecast - by Application
- 6. Global Carbon Footprint Management Analysis, Insights and Forecast, 2021-2033
- 6.1. Market Analysis, Insights and Forecast - by Application
- 6.1.1. Manufacturing
- 6.1.2. Energy and Utilities
- 6.1.3. Residential and Commercial Buildings
- 6.1.4. Transportation and Logistics
- 6.1.5. IT and Telecom
- 6.2. Market Analysis, Insights and Forecast - by Types
- 6.2.1. Software
- 6.2.2. Service
- 6.1. Market Analysis, Insights and Forecast - by Application
- 7. North America Carbon Footprint Management Analysis, Insights and Forecast, 2020-2032
- 7.1. Market Analysis, Insights and Forecast - by Application
- 7.1.1. Manufacturing
- 7.1.2. Energy and Utilities
- 7.1.3. Residential and Commercial Buildings
- 7.1.4. Transportation and Logistics
- 7.1.5. IT and Telecom
- 7.2. Market Analysis, Insights and Forecast - by Types
- 7.2.1. Software
- 7.2.2. Service
- 7.1. Market Analysis, Insights and Forecast - by Application
- 8. South America Carbon Footprint Management Analysis, Insights and Forecast, 2020-2032
- 8.1. Market Analysis, Insights and Forecast - by Application
- 8.1.1. Manufacturing
- 8.1.2. Energy and Utilities
- 8.1.3. Residential and Commercial Buildings
- 8.1.4. Transportation and Logistics
- 8.1.5. IT and Telecom
- 8.2. Market Analysis, Insights and Forecast - by Types
- 8.2.1. Software
- 8.2.2. Service
- 8.1. Market Analysis, Insights and Forecast - by Application
- 9. Europe Carbon Footprint Management Analysis, Insights and Forecast, 2020-2032
- 9.1. Market Analysis, Insights and Forecast - by Application
- 9.1.1. Manufacturing
- 9.1.2. Energy and Utilities
- 9.1.3. Residential and Commercial Buildings
- 9.1.4. Transportation and Logistics
- 9.1.5. IT and Telecom
- 9.2. Market Analysis, Insights and Forecast - by Types
- 9.2.1. Software
- 9.2.2. Service
- 9.1. Market Analysis, Insights and Forecast - by Application
- 10. Middle East & Africa Carbon Footprint Management Analysis, Insights and Forecast, 2020-2032
- 10.1. Market Analysis, Insights and Forecast - by Application
- 10.1.1. Manufacturing
- 10.1.2. Energy and Utilities
- 10.1.3. Residential and Commercial Buildings
- 10.1.4. Transportation and Logistics
- 10.1.5. IT and Telecom
- 10.2. Market Analysis, Insights and Forecast - by Types
- 10.2.1. Software
- 10.2.2. Service
- 10.1. Market Analysis, Insights and Forecast - by Application
- 11. Asia Pacific Carbon Footprint Management Analysis, Insights and Forecast, 2020-2032
- 11.1. Market Analysis, Insights and Forecast - by Application
- 11.1.1. Manufacturing
- 11.1.2. Energy and Utilities
- 11.1.3. Residential and Commercial Buildings
- 11.1.4. Transportation and Logistics
- 11.1.5. IT and Telecom
- 11.2. Market Analysis, Insights and Forecast - by Types
- 11.2.1. Software
- 11.2.2. Service
- 11.1. Market Analysis, Insights and Forecast - by Application
- 12. Competitive Analysis
- 12.1. Company Profiles
- 12.1.1 Ecova
- 12.1.1.1. Company Overview
- 12.1.1.2. Products
- 12.1.1.3. Company Financials
- 12.1.1.4. SWOT Analysis
- 12.1.2 Enablon
- 12.1.2.1. Company Overview
- 12.1.2.2. Products
- 12.1.2.3. Company Financials
- 12.1.2.4. SWOT Analysis
- 12.1.3 Enviance
- 12.1.3.1. Company Overview
- 12.1.3.2. Products
- 12.1.3.3. Company Financials
- 12.1.3.4. SWOT Analysis
- 12.1.4 Firstcarbon Solutions
- 12.1.4.1. Company Overview
- 12.1.4.2. Products
- 12.1.4.3. Company Financials
- 12.1.4.4. SWOT Analysis
- 12.1.5 Greenstone
- 12.1.5.1. Company Overview
- 12.1.5.2. Products
- 12.1.5.3. Company Financials
- 12.1.5.4. SWOT Analysis
- 12.1.6 IHS Markit
- 12.1.6.1. Company Overview
- 12.1.6.2. Products
- 12.1.6.3. Company Financials
- 12.1.6.4. SWOT Analysis
- 12.1.7 ProcessMAP
- 12.1.7.1. Company Overview
- 12.1.7.2. Products
- 12.1.7.3. Company Financials
- 12.1.7.4. SWOT Analysis
- 12.1.8 Schneider Electric
- 12.1.8.1. Company Overview
- 12.1.8.2. Products
- 12.1.8.3. Company Financials
- 12.1.8.4. SWOT Analysis
- 12.1.9 Thinkstep
- 12.1.9.1. Company Overview
- 12.1.9.2. Products
- 12.1.9.3. Company Financials
- 12.1.9.4. SWOT Analysis
- 12.1.10 Verisae
- 12.1.10.1. Company Overview
- 12.1.10.2. Products
- 12.1.10.3. Company Financials
- 12.1.10.4. SWOT Analysis
- 12.1.1 Ecova
- 12.2. Market Entropy
- 12.2.1 Company's Key Areas Served
- 12.2.2 Recent Developments
- 12.3. Company Market Share Analysis 2025
- 12.3.1 Top 5 Companies Market Share Analysis
- 12.3.2 Top 3 Companies Market Share Analysis
- 12.4. List of Potential Customers
- 13. Research Methodology
List of Figures
- Figure 1: Global Carbon Footprint Management Revenue Breakdown (undefined, %) by Region 2025 & 2033
- Figure 2: North America Carbon Footprint Management Revenue (undefined), by Application 2025 & 2033
- Figure 3: North America Carbon Footprint Management Revenue Share (%), by Application 2025 & 2033
- Figure 4: North America Carbon Footprint Management Revenue (undefined), by Types 2025 & 2033
- Figure 5: North America Carbon Footprint Management Revenue Share (%), by Types 2025 & 2033
- Figure 6: North America Carbon Footprint Management Revenue (undefined), by Country 2025 & 2033
- Figure 7: North America Carbon Footprint Management Revenue Share (%), by Country 2025 & 2033
- Figure 8: South America Carbon Footprint Management Revenue (undefined), by Application 2025 & 2033
- Figure 9: South America Carbon Footprint Management Revenue Share (%), by Application 2025 & 2033
- Figure 10: South America Carbon Footprint Management Revenue (undefined), by Types 2025 & 2033
- Figure 11: South America Carbon Footprint Management Revenue Share (%), by Types 2025 & 2033
- Figure 12: South America Carbon Footprint Management Revenue (undefined), by Country 2025 & 2033
- Figure 13: South America Carbon Footprint Management Revenue Share (%), by Country 2025 & 2033
- Figure 14: Europe Carbon Footprint Management Revenue (undefined), by Application 2025 & 2033
- Figure 15: Europe Carbon Footprint Management Revenue Share (%), by Application 2025 & 2033
- Figure 16: Europe Carbon Footprint Management Revenue (undefined), by Types 2025 & 2033
- Figure 17: Europe Carbon Footprint Management Revenue Share (%), by Types 2025 & 2033
- Figure 18: Europe Carbon Footprint Management Revenue (undefined), by Country 2025 & 2033
- Figure 19: Europe Carbon Footprint Management Revenue Share (%), by Country 2025 & 2033
- Figure 20: Middle East & Africa Carbon Footprint Management Revenue (undefined), by Application 2025 & 2033
- Figure 21: Middle East & Africa Carbon Footprint Management Revenue Share (%), by Application 2025 & 2033
- Figure 22: Middle East & Africa Carbon Footprint Management Revenue (undefined), by Types 2025 & 2033
- Figure 23: Middle East & Africa Carbon Footprint Management Revenue Share (%), by Types 2025 & 2033
- Figure 24: Middle East & Africa Carbon Footprint Management Revenue (undefined), by Country 2025 & 2033
- Figure 25: Middle East & Africa Carbon Footprint Management Revenue Share (%), by Country 2025 & 2033
- Figure 26: Asia Pacific Carbon Footprint Management Revenue (undefined), by Application 2025 & 2033
- Figure 27: Asia Pacific Carbon Footprint Management Revenue Share (%), by Application 2025 & 2033
- Figure 28: Asia Pacific Carbon Footprint Management Revenue (undefined), by Types 2025 & 2033
- Figure 29: Asia Pacific Carbon Footprint Management Revenue Share (%), by Types 2025 & 2033
- Figure 30: Asia Pacific Carbon Footprint Management Revenue (undefined), by Country 2025 & 2033
- Figure 31: Asia Pacific Carbon Footprint Management Revenue Share (%), by Country 2025 & 2033
List of Tables
- Table 1: Global Carbon Footprint Management Revenue undefined Forecast, by Application 2020 & 2033
- Table 2: Global Carbon Footprint Management Revenue undefined Forecast, by Types 2020 & 2033
- Table 3: Global Carbon Footprint Management Revenue undefined Forecast, by Region 2020 & 2033
- Table 4: Global Carbon Footprint Management Revenue undefined Forecast, by Application 2020 & 2033
- Table 5: Global Carbon Footprint Management Revenue undefined Forecast, by Types 2020 & 2033
- Table 6: Global Carbon Footprint Management Revenue undefined Forecast, by Country 2020 & 2033
- Table 7: United States Carbon Footprint Management Revenue (undefined) Forecast, by Application 2020 & 2033
- Table 8: Canada Carbon Footprint Management Revenue (undefined) Forecast, by Application 2020 & 2033
- Table 9: Mexico Carbon Footprint Management Revenue (undefined) Forecast, by Application 2020 & 2033
- Table 10: Global Carbon Footprint Management Revenue undefined Forecast, by Application 2020 & 2033
- Table 11: Global Carbon Footprint Management Revenue undefined Forecast, by Types 2020 & 2033
- Table 12: Global Carbon Footprint Management Revenue undefined Forecast, by Country 2020 & 2033
- Table 13: Brazil Carbon Footprint Management Revenue (undefined) Forecast, by Application 2020 & 2033
- Table 14: Argentina Carbon Footprint Management Revenue (undefined) Forecast, by Application 2020 & 2033
- Table 15: Rest of South America Carbon Footprint Management Revenue (undefined) Forecast, by Application 2020 & 2033
- Table 16: Global Carbon Footprint Management Revenue undefined Forecast, by Application 2020 & 2033
- Table 17: Global Carbon Footprint Management Revenue undefined Forecast, by Types 2020 & 2033
- Table 18: Global Carbon Footprint Management Revenue undefined Forecast, by Country 2020 & 2033
- Table 19: United Kingdom Carbon Footprint Management Revenue (undefined) Forecast, by Application 2020 & 2033
- Table 20: Germany Carbon Footprint Management Revenue (undefined) Forecast, by Application 2020 & 2033
- Table 21: France Carbon Footprint Management Revenue (undefined) Forecast, by Application 2020 & 2033
- Table 22: Italy Carbon Footprint Management Revenue (undefined) Forecast, by Application 2020 & 2033
- Table 23: Spain Carbon Footprint Management Revenue (undefined) Forecast, by Application 2020 & 2033
- Table 24: Russia Carbon Footprint Management Revenue (undefined) Forecast, by Application 2020 & 2033
- Table 25: Benelux Carbon Footprint Management Revenue (undefined) Forecast, by Application 2020 & 2033
- Table 26: Nordics Carbon Footprint Management Revenue (undefined) Forecast, by Application 2020 & 2033
- Table 27: Rest of Europe Carbon Footprint Management Revenue (undefined) Forecast, by Application 2020 & 2033
- Table 28: Global Carbon Footprint Management Revenue undefined Forecast, by Application 2020 & 2033
- Table 29: Global Carbon Footprint Management Revenue undefined Forecast, by Types 2020 & 2033
- Table 30: Global Carbon Footprint Management Revenue undefined Forecast, by Country 2020 & 2033
- Table 31: Turkey Carbon Footprint Management Revenue (undefined) Forecast, by Application 2020 & 2033
- Table 32: Israel Carbon Footprint Management Revenue (undefined) Forecast, by Application 2020 & 2033
- Table 33: GCC Carbon Footprint Management Revenue (undefined) Forecast, by Application 2020 & 2033
- Table 34: North Africa Carbon Footprint Management Revenue (undefined) Forecast, by Application 2020 & 2033
- Table 35: South Africa Carbon Footprint Management Revenue (undefined) Forecast, by Application 2020 & 2033
- Table 36: Rest of Middle East & Africa Carbon Footprint Management Revenue (undefined) Forecast, by Application 2020 & 2033
- Table 37: Global Carbon Footprint Management Revenue undefined Forecast, by Application 2020 & 2033
- Table 38: Global Carbon Footprint Management Revenue undefined Forecast, by Types 2020 & 2033
- Table 39: Global Carbon Footprint Management Revenue undefined Forecast, by Country 2020 & 2033
- Table 40: China Carbon Footprint Management Revenue (undefined) Forecast, by Application 2020 & 2033
- Table 41: India Carbon Footprint Management Revenue (undefined) Forecast, by Application 2020 & 2033
- Table 42: Japan Carbon Footprint Management Revenue (undefined) Forecast, by Application 2020 & 2033
- Table 43: South Korea Carbon Footprint Management Revenue (undefined) Forecast, by Application 2020 & 2033
- Table 44: ASEAN Carbon Footprint Management Revenue (undefined) Forecast, by Application 2020 & 2033
- Table 45: Oceania Carbon Footprint Management Revenue (undefined) Forecast, by Application 2020 & 2033
- Table 46: Rest of Asia Pacific Carbon Footprint Management Revenue (undefined) Forecast, by Application 2020 & 2033
Frequently Asked Questions
1. What is the projected Compound Annual Growth Rate (CAGR) of the Carbon Footprint Management?
The projected CAGR is approximately 9.3%.
2. Which companies are prominent players in the Carbon Footprint Management?
Key companies in the market include Ecova, Enablon, Enviance, Firstcarbon Solutions, Greenstone, IHS Markit, ProcessMAP, Schneider Electric, Thinkstep, Verisae.
3. What are the main segments of the Carbon Footprint Management?
The market segments include Application, Types.
4. Can you provide details about the market size?
The market size is estimated to be USD XXX N/A as of 2022.
5. What are some drivers contributing to market growth?
N/A
6. What are the notable trends driving market growth?
N/A
7. Are there any restraints impacting market growth?
N/A
8. Can you provide examples of recent developments in the market?
N/A
9. What pricing options are available for accessing the report?
Pricing options include single-user, multi-user, and enterprise licenses priced at USD 3350.00, USD 5025.00, and USD 6700.00 respectively.
10. Is the market size provided in terms of value or volume?
The market size is provided in terms of value, measured in N/A.
11. Are there any specific market keywords associated with the report?
Yes, the market keyword associated with the report is "Carbon Footprint Management," which aids in identifying and referencing the specific market segment covered.
12. How do I determine which pricing option suits my needs best?
The pricing options vary based on user requirements and access needs. Individual users may opt for single-user licenses, while businesses requiring broader access may choose multi-user or enterprise licenses for cost-effective access to the report.
13. Are there any additional resources or data provided in the Carbon Footprint Management report?
While the report offers comprehensive insights, it's advisable to review the specific contents or supplementary materials provided to ascertain if additional resources or data are available.
14. How can I stay updated on further developments or reports in the Carbon Footprint Management?
To stay informed about further developments, trends, and reports in the Carbon Footprint Management, consider subscribing to industry newsletters, following relevant companies and organizations, or regularly checking reputable industry news sources and publications.
Methodology
Step 1 - Identification of Relevant Samples Size from Population Database


Step 2 - Approaches for Defining Global Market Size (Value, Volume* & Price*)

Note*: In applicable scenarios
Step 3 - Data Sources
Primary Research
- Web Analytics
- Survey Reports
- Research Institute
- Latest Research Reports
- Opinion Leaders
Secondary Research
- Annual Reports
- White Paper
- Latest Press Release
- Industry Association
- Paid Database
- Investor Presentations

Step 4 - Data Triangulation
Involves using different sources of information in order to increase the validity of a study
These sources are likely to be stakeholders in a program - participants, other researchers, program staff, other community members, and so on.
Then we put all data in single framework & apply various statistical tools to find out the dynamic on the market.
During the analysis stage, feedback from the stakeholder groups would be compared to determine areas of agreement as well as areas of divergence