

Key Insights
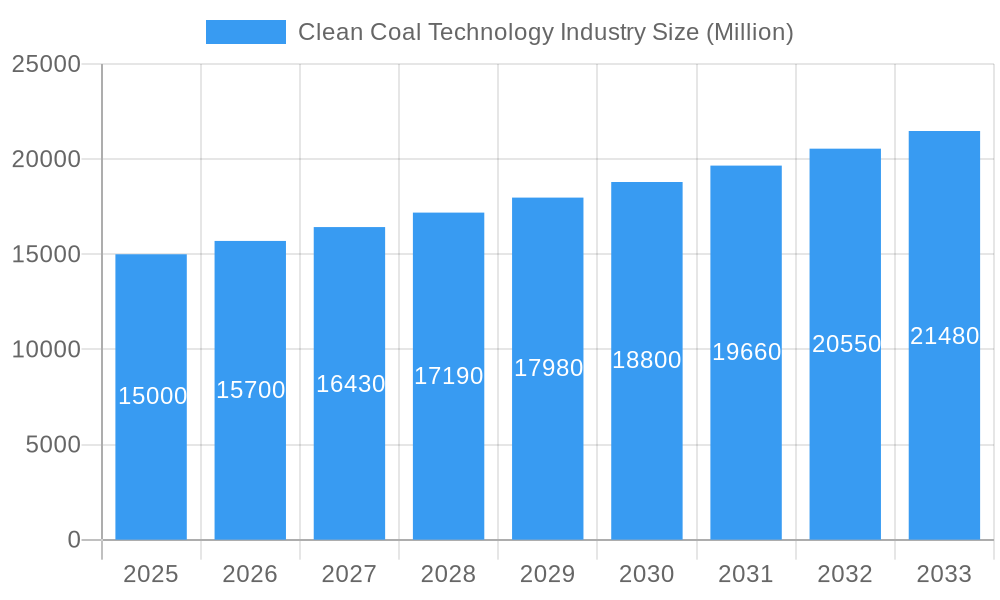
The clean coal technology market is poised for substantial expansion, with an estimated size of $4.57 billion in the base year 2025. Projections indicate a robust Compound Annual Growth Rate (CAGR) of 6.39% from 2025 to 2033. This growth is propelled by escalating global energy requirements and stringent environmental mandates designed to curtail greenhouse gas emissions and air pollution from coal-fired power plants. Leading technologies contributing to market expansion include Carbon Capture and Storage (CCS), advanced combustion methods, Flue Gas Desulfurization (FGD), and Selective Catalytic Reduction (SCR). While power generation remains the primary application, significant growth is anticipated in industrial processes and, to a lesser extent, residential and commercial heating, as clean coal technologies gain economic viability and wider adoption. Despite technological progress and supportive government policies, challenges persist, including high implementation capital costs, the energy demands of CCS, and potential public apprehension regarding coal-based energy, even with improved environmental performance. Regional disparities are evident, with North America and Asia Pacific currently dominating market share due to established coal infrastructure and ongoing investments. However, Europe and other regions are expected to witness increased adoption, driven by stricter emission standards and a global shift towards cleaner energy solutions.
Clean Coal Technology Industry Market Size (In Billion)
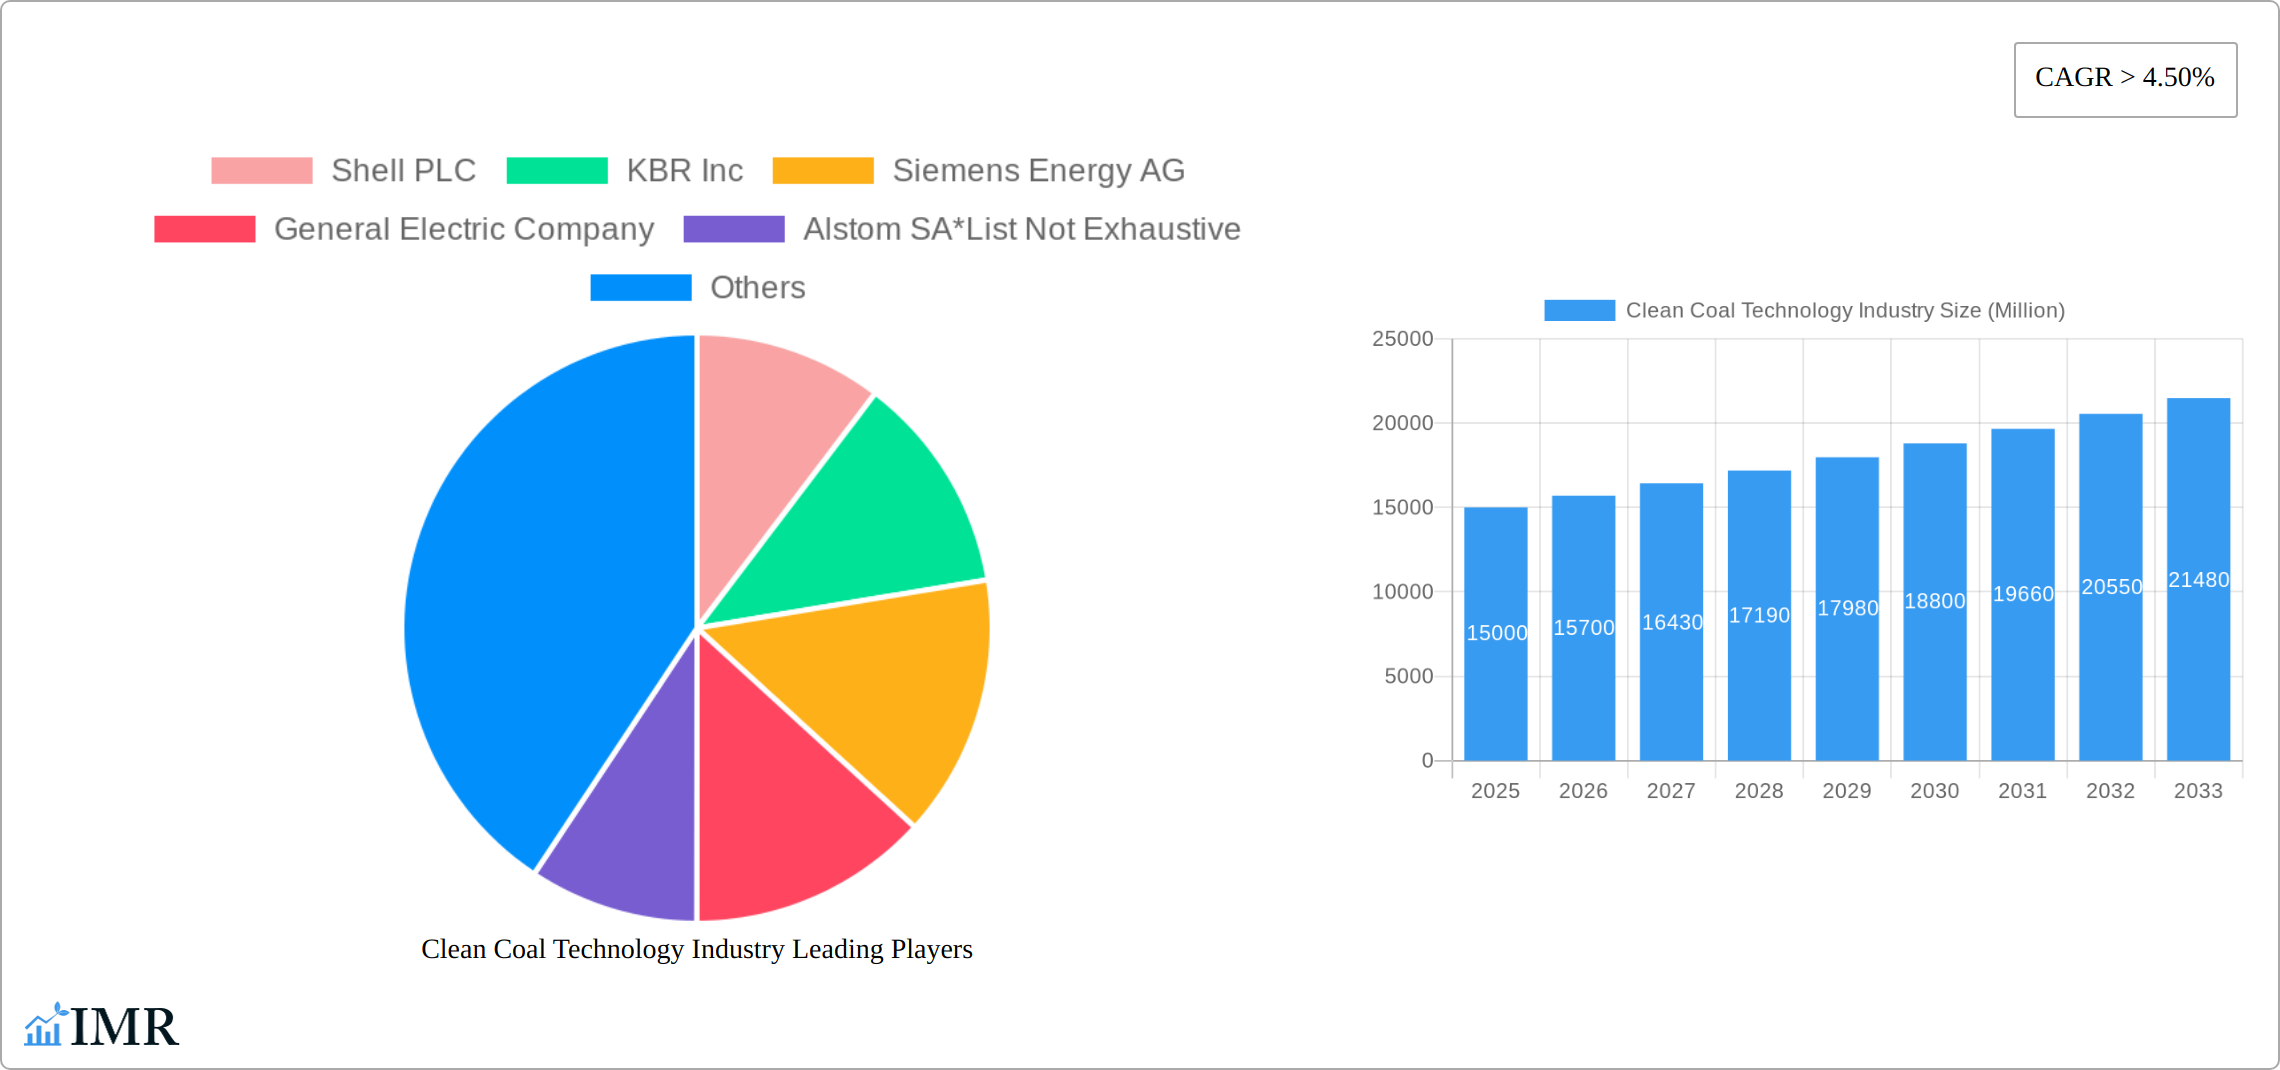
The competitive arena features prominent industry leaders such as Shell PLC, KBR Inc., Siemens Energy AG, General Electric Company, and Alstom SA. These entities are actively engaged in the development and deployment of advanced clean coal technologies, often through strategic collaborations on significant projects. Future market trends will be influenced by advancements in CCS technology, the cost-competitiveness of clean coal solutions against renewable energy alternatives, and the evolving regulatory landscape. Government incentives, carbon pricing, and technological breakthroughs are anticipated to shape the market's trajectory throughout the forecast period. The successful integration of clean coal technologies is critical for mitigating coal's environmental impact while ensuring a stable energy supply.
Clean Coal Technology Industry Company Market Share
Clean Coal Technology Industry Market Report: 2019-2033
This comprehensive report provides an in-depth analysis of the Clean Coal Technology (CCT) industry, encompassing market dynamics, growth trends, regional landscapes, and key players. With a focus on the period 2019-2033, including a base year of 2025 and a forecast period of 2025-2033, this report offers invaluable insights for industry professionals, investors, and policymakers. The report covers parent markets like energy production and child markets including power generation, industrial processes, and residential/commercial heating. The total market size is estimated at xx Million in 2025.
Clean Coal Technology Industry Market Dynamics & Structure
The Clean Coal Technology market is characterized by moderate concentration, with several major players holding significant market share. Technological innovation, driven by the need for cleaner energy sources and stricter environmental regulations, is a key market driver. The market is also shaped by regulatory frameworks, including carbon emission standards and incentives for clean energy adoption. Competitive product substitutes, such as renewable energy sources, pose a significant challenge, although CCT technologies continue to play a crucial role in bridging the gap towards a low-carbon future. Mergers and acquisitions (M&A) activity is moderate, reflecting strategic consolidation within the industry.
- Market Concentration: Moderate, with top 5 players holding approximately xx% market share in 2025.
- Technological Innovation: Focus on improving efficiency of CCS, advanced combustion, and FGD technologies.
- Regulatory Framework: Stringent emission standards driving adoption of CCT in key regions.
- Competitive Substitutes: Renewable energy sources (solar, wind) represent the primary competition.
- M&A Trends: Strategic acquisitions to expand technology portfolios and geographic reach; xx deals recorded in 2019-2024.
- End-User Demographics: Primarily power generation companies, followed by industrial process users.
Clean Coal Technology Industry Growth Trends & Insights
The Clean Coal Technology (CCT) market demonstrated robust growth between 2019 and 2024, achieving a CAGR of [Insert Specific CAGR Percentage]%. This expansion is fueled by several key factors: the consistently rising global demand for electricity, industrial growth in developing nations, and the increasingly stringent environmental regulations being implemented worldwide. The adoption rate of CCT technologies varies considerably across different geographical regions. Countries with well-established power generation infrastructure and stricter emission control standards generally exhibit higher adoption rates. Significant advancements in carbon capture, utilization, and storage (CCUS) technology, alongside the development of more efficient combustion processes, are further accelerating market growth. Moreover, evolving consumer preferences towards environmentally responsible energy sources are significantly impacting the market's trajectory. The market is projected to maintain its upward trajectory throughout the forecast period (2025-2033), reaching an estimated value of [Insert Projected Market Value in Millions] by 2033, with a projected CAGR of [Insert Projected CAGR Percentage]%. This growth is contingent upon several factors, including continued investment in R&D, supportive government policies, and the successful integration of CCT with other clean energy technologies.
Dominant Regions, Countries, or Segments in Clean Coal Technology Industry
The power generation application segment dominates the Clean Coal Technology market, accounting for approximately xx% of the total market share in 2025. Within technologies, FGD and SCR hold the largest market share due to their established presence and cost-effectiveness. Geographically, Asia-Pacific is the leading region, driven by robust energy demand and investments in new power plants. North America and Europe also exhibit significant market presence, propelled by stringent environmental regulations and government support for clean energy initiatives.
- Key Drivers:
- Stringent emission regulations in developed countries.
- Increasing power demand in developing economies.
- Government incentives and subsidies for clean energy technologies.
- Growing awareness of environmental concerns.
- Dominance Factors:
- Established infrastructure in developed regions.
- Abundant coal reserves in several countries.
- High adoption rate of FGD and SCR technologies.
Clean Coal Technology Industry Product Landscape
The Clean Coal Technology market offers a range of solutions, including CCS, advanced combustion technologies, FGD, and SCR systems. These technologies are continually being improved to enhance efficiency, reduce costs, and minimize environmental impact. Key advancements include the development of more efficient carbon capture methods, improved flue gas treatment technologies, and the integration of renewable energy sources. The competitive landscape is characterized by ongoing innovation, with companies focusing on delivering high-performance, cost-effective solutions that meet the evolving needs of the industry.
Key Drivers, Barriers & Challenges in Clean Coal Technology Industry
Key Drivers:
- Stringent environmental regulations globally pushing for cleaner energy.
- Growing demand for electricity, particularly in developing nations.
- Technological advancements improving the efficiency and cost-effectiveness of CCT.
- Government incentives and funding programs supporting CCT adoption.
Key Challenges & Restraints:
- High capital costs associated with implementing CCT technologies.
- Technological limitations in achieving high carbon capture rates.
- Potential for CCS leakage and environmental risks.
- Regulatory uncertainty and inconsistent policy frameworks across regions. The implementation of effective and consistent regulatory frameworks is crucial for mitigating some of these risks.
Emerging Opportunities in Clean Coal Technology Industry
Several promising opportunities are emerging within the CCT sector. The integration of CCT with renewable energy sources, such as solar and wind power, is creating hybrid power generation systems that offer enhanced reliability and reduced reliance on fossil fuels. Significant opportunities also exist in the development of next-generation CCUS technologies focused on improving capture rates while simultaneously reducing costs. Furthermore, exploring the application of CCT in smaller-scale power plants and industrial processes, which were previously underserved, offers considerable untapped market potential. Finally, a growing emphasis on carbon utilization—transforming captured CO2 into valuable products like building materials or fuels—presents a new avenue for driving further market expansion and creating a more circular economy.
Growth Accelerators in the Clean Coal Technology Industry
Technological breakthroughs in carbon capture and utilization, along with strategic partnerships between energy companies, technology providers, and research institutions, are crucial growth catalysts. Expanding CCT deployment into emerging markets with significant coal-fired power capacity represents another major growth accelerator. Furthermore, government policies promoting clean energy and carbon reduction targets will stimulate demand for CCT solutions.
Key Players Shaping the Clean Coal Technology Industry Market
- Shell PLC
- KBR Inc
- Siemens Energy AG
- General Electric Company
- Alstom SA
- List Not Exhaustive
Notable Milestones in Clean Coal Technology Industry Sector
- October 2021: Adani Power Limited announced plans to commission the Godda Ultra Super Critical coal thermal power project (1,600 MW capacity), showcasing significant investment in advanced coal technologies.
- February 2022: The Indian Institute of Chemical Technology (IICT) announced a collaborative project with Northern Coalfields Limits (NCL) for R&D in sustainable mining and CCT, highlighting the increasing focus on research and innovation within the sector.
- [Add more recent milestones with dates and brief descriptions]
In-Depth Clean Coal Technology Industry Market Outlook
The Clean Coal Technology market is poised for sustained growth, driven by the escalating global demand for cleaner and more sustainable energy solutions and the continuous development of increasingly efficient and cost-effective technologies. Strategic alliances and partnerships, coupled with technological advancements and supportive government policies (including carbon pricing mechanisms and incentives for clean energy adoption), will play pivotal roles in unlocking the substantial market potential of CCT in the years to come. The future focus will increasingly shift towards seamlessly integrating CCT with renewable energy sources to create more sustainable and resilient energy systems, mitigating the environmental impact of electricity generation while ensuring energy security.
Clean Coal Technology Industry Segmentation
- 1. Production Analysis
- 2. Consumption Analysis
- 3. Import Market Analysis (Value & Volume)
- 4. Export Market Analysis (Value & Volume)
- 5. Price Trend Analysis
Clean Coal Technology Industry Segmentation By Geography
- 1. North America
- 2. Europe
- 3. Asia Pacific
- 4. Middle East and Africa
- 5. South America
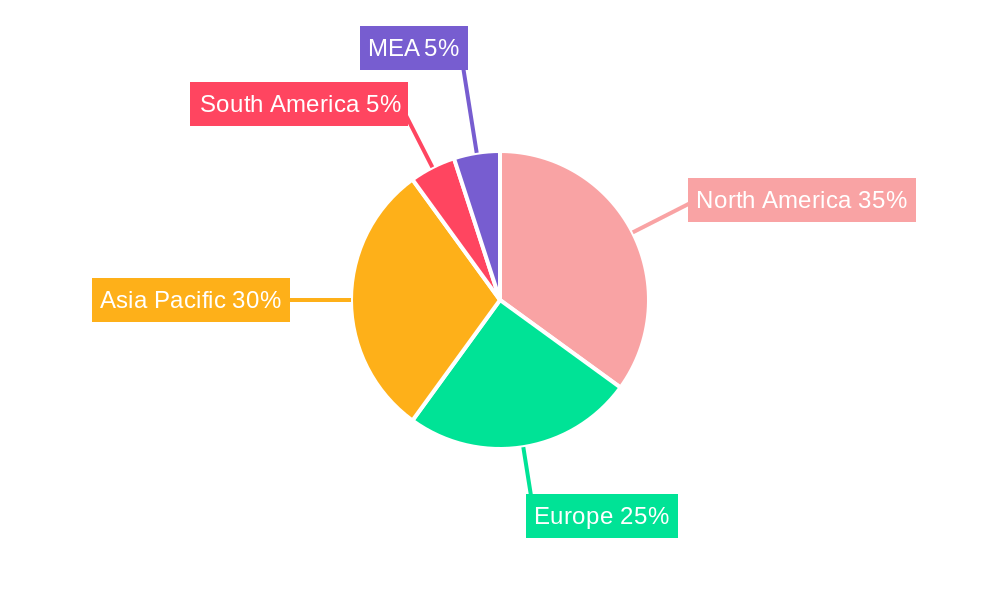
Clean Coal Technology Industry Regional Market Share
Geographic Coverage of Clean Coal Technology Industry
Clean Coal Technology Industry REPORT HIGHLIGHTS
| Aspects | Details |
|---|---|
| Study Period | 2020-2034 |
| Base Year | 2025 |
| Estimated Year | 2026 |
| Forecast Period | 2026-2034 |
| Historical Period | 2020-2025 |
| Growth Rate | CAGR of 6.39% from 2020-2034 |
| Segmentation |
|
Table of Contents
- 1. Introduction
- 1.1. Research Scope
- 1.2. Market Segmentation
- 1.3. Research Objective
- 1.4. Definitions and Assumptions
- 2. Executive Summary
- 2.1. Market Snapshot
- 3. Market Dynamics
- 3.1. Market Drivers
- 3.2. Market Restrains
- 3.3. Market Trends
- 3.4. Market Opportunities
- 4. Market Factor Analysis
- 4.1. Porters Five Forces
- 4.1.1. Bargaining Power of Suppliers
- 4.1.2. Bargaining Power of Buyers
- 4.1.3. Threat of New Entrants
- 4.1.4. Threat of Substitutes
- 4.1.5. Competitive Rivalry
- 4.2. PESTEL analysis
- 4.3. BCG Analysis
- 4.3.1. Stars (High Growth, High Market Share)
- 4.3.2. Cash Cows (Low Growth, High Market Share)
- 4.3.3. Question Mark (High Growth, Low Market Share)
- 4.3.4. Dogs (Low Growth, Low Market Share)
- 4.4. Ansoff Matrix Analysis
- 4.5. Supply Chain Analysis
- 4.6. Regulatory Landscape
- 4.7. Current Market Potential and Opportunity Assessment (TAM–SAM–SOM Framework)
- 4.8. IMR Analyst Note
- 4.1. Porters Five Forces
- 5. Market Analysis, Insights and Forecast 2021-2033
- 5.1. Market Analysis, Insights and Forecast - by Production Analysis
- 5.2. Market Analysis, Insights and Forecast - by Consumption Analysis
- 5.3. Market Analysis, Insights and Forecast - by Import Market Analysis (Value & Volume)
- 5.4. Market Analysis, Insights and Forecast - by Export Market Analysis (Value & Volume)
- 5.5. Market Analysis, Insights and Forecast - by Price Trend Analysis
- 5.6. Market Analysis, Insights and Forecast - by Region
- 5.6.1. North America
- 5.6.2. Europe
- 5.6.3. Asia Pacific
- 5.6.4. Middle East and Africa
- 5.6.5. South America
- 6. Global Clean Coal Technology Industry Analysis, Insights and Forecast, 2021-2033
- 6.1. Market Analysis, Insights and Forecast - by Production Analysis
- 6.2. Market Analysis, Insights and Forecast - by Consumption Analysis
- 6.3. Market Analysis, Insights and Forecast - by Import Market Analysis (Value & Volume)
- 6.4. Market Analysis, Insights and Forecast - by Export Market Analysis (Value & Volume)
- 6.5. Market Analysis, Insights and Forecast - by Price Trend Analysis
- 7. North America Clean Coal Technology Industry Analysis, Insights and Forecast, 2020-2032
- 7.1. Market Analysis, Insights and Forecast - by Production Analysis
- 7.2. Market Analysis, Insights and Forecast - by Consumption Analysis
- 7.3. Market Analysis, Insights and Forecast - by Import Market Analysis (Value & Volume)
- 7.4. Market Analysis, Insights and Forecast - by Export Market Analysis (Value & Volume)
- 7.5. Market Analysis, Insights and Forecast - by Price Trend Analysis
- 8. Europe Clean Coal Technology Industry Analysis, Insights and Forecast, 2020-2032
- 8.1. Market Analysis, Insights and Forecast - by Production Analysis
- 8.2. Market Analysis, Insights and Forecast - by Consumption Analysis
- 8.3. Market Analysis, Insights and Forecast - by Import Market Analysis (Value & Volume)
- 8.4. Market Analysis, Insights and Forecast - by Export Market Analysis (Value & Volume)
- 8.5. Market Analysis, Insights and Forecast - by Price Trend Analysis
- 9. Asia Pacific Clean Coal Technology Industry Analysis, Insights and Forecast, 2020-2032
- 9.1. Market Analysis, Insights and Forecast - by Production Analysis
- 9.2. Market Analysis, Insights and Forecast - by Consumption Analysis
- 9.3. Market Analysis, Insights and Forecast - by Import Market Analysis (Value & Volume)
- 9.4. Market Analysis, Insights and Forecast - by Export Market Analysis (Value & Volume)
- 9.5. Market Analysis, Insights and Forecast - by Price Trend Analysis
- 10. Middle East and Africa Clean Coal Technology Industry Analysis, Insights and Forecast, 2020-2032
- 10.1. Market Analysis, Insights and Forecast - by Production Analysis
- 10.2. Market Analysis, Insights and Forecast - by Consumption Analysis
- 10.3. Market Analysis, Insights and Forecast - by Import Market Analysis (Value & Volume)
- 10.4. Market Analysis, Insights and Forecast - by Export Market Analysis (Value & Volume)
- 10.5. Market Analysis, Insights and Forecast - by Price Trend Analysis
- 11. South America Clean Coal Technology Industry Analysis, Insights and Forecast, 2020-2032
- 11.1. Market Analysis, Insights and Forecast - by Production Analysis
- 11.2. Market Analysis, Insights and Forecast - by Consumption Analysis
- 11.3. Market Analysis, Insights and Forecast - by Import Market Analysis (Value & Volume)
- 11.4. Market Analysis, Insights and Forecast - by Export Market Analysis (Value & Volume)
- 11.5. Market Analysis, Insights and Forecast - by Price Trend Analysis
- 12. Competitive Analysis
- 12.1. Company Profiles
- 12.1.1 Shell PLC
- 12.1.1.1. Company Overview
- 12.1.1.2. Products
- 12.1.1.3. Company Financials
- 12.1.1.4. SWOT Analysis
- 12.1.2 KBR Inc
- 12.1.2.1. Company Overview
- 12.1.2.2. Products
- 12.1.2.3. Company Financials
- 12.1.2.4. SWOT Analysis
- 12.1.3 Siemens Energy AG
- 12.1.3.1. Company Overview
- 12.1.3.2. Products
- 12.1.3.3. Company Financials
- 12.1.3.4. SWOT Analysis
- 12.1.4 General Electric Company
- 12.1.4.1. Company Overview
- 12.1.4.2. Products
- 12.1.4.3. Company Financials
- 12.1.4.4. SWOT Analysis
- 12.1.5 Alstom SA*List Not Exhaustive
- 12.1.5.1. Company Overview
- 12.1.5.2. Products
- 12.1.5.3. Company Financials
- 12.1.5.4. SWOT Analysis
- 12.1.1 Shell PLC
- 12.2. Market Entropy
- 12.2.1 Company's Key Areas Served
- 12.2.2 Recent Developments
- 12.3. Company Market Share Analysis 2025
- 12.3.1 Top 5 Companies Market Share Analysis
- 12.3.2 Top 3 Companies Market Share Analysis
- 12.4. List of Potential Customers
- 13. Research Methodology
List of Figures
- Figure 1: Global Clean Coal Technology Industry Revenue Breakdown (billion, %) by Region 2025 & 2033
- Figure 2: North America Clean Coal Technology Industry Revenue (billion), by Production Analysis 2025 & 2033
- Figure 3: North America Clean Coal Technology Industry Revenue Share (%), by Production Analysis 2025 & 2033
- Figure 4: North America Clean Coal Technology Industry Revenue (billion), by Consumption Analysis 2025 & 2033
- Figure 5: North America Clean Coal Technology Industry Revenue Share (%), by Consumption Analysis 2025 & 2033
- Figure 6: North America Clean Coal Technology Industry Revenue (billion), by Import Market Analysis (Value & Volume) 2025 & 2033
- Figure 7: North America Clean Coal Technology Industry Revenue Share (%), by Import Market Analysis (Value & Volume) 2025 & 2033
- Figure 8: North America Clean Coal Technology Industry Revenue (billion), by Export Market Analysis (Value & Volume) 2025 & 2033
- Figure 9: North America Clean Coal Technology Industry Revenue Share (%), by Export Market Analysis (Value & Volume) 2025 & 2033
- Figure 10: North America Clean Coal Technology Industry Revenue (billion), by Price Trend Analysis 2025 & 2033
- Figure 11: North America Clean Coal Technology Industry Revenue Share (%), by Price Trend Analysis 2025 & 2033
- Figure 12: North America Clean Coal Technology Industry Revenue (billion), by Country 2025 & 2033
- Figure 13: North America Clean Coal Technology Industry Revenue Share (%), by Country 2025 & 2033
- Figure 14: Europe Clean Coal Technology Industry Revenue (billion), by Production Analysis 2025 & 2033
- Figure 15: Europe Clean Coal Technology Industry Revenue Share (%), by Production Analysis 2025 & 2033
- Figure 16: Europe Clean Coal Technology Industry Revenue (billion), by Consumption Analysis 2025 & 2033
- Figure 17: Europe Clean Coal Technology Industry Revenue Share (%), by Consumption Analysis 2025 & 2033
- Figure 18: Europe Clean Coal Technology Industry Revenue (billion), by Import Market Analysis (Value & Volume) 2025 & 2033
- Figure 19: Europe Clean Coal Technology Industry Revenue Share (%), by Import Market Analysis (Value & Volume) 2025 & 2033
- Figure 20: Europe Clean Coal Technology Industry Revenue (billion), by Export Market Analysis (Value & Volume) 2025 & 2033
- Figure 21: Europe Clean Coal Technology Industry Revenue Share (%), by Export Market Analysis (Value & Volume) 2025 & 2033
- Figure 22: Europe Clean Coal Technology Industry Revenue (billion), by Price Trend Analysis 2025 & 2033
- Figure 23: Europe Clean Coal Technology Industry Revenue Share (%), by Price Trend Analysis 2025 & 2033
- Figure 24: Europe Clean Coal Technology Industry Revenue (billion), by Country 2025 & 2033
- Figure 25: Europe Clean Coal Technology Industry Revenue Share (%), by Country 2025 & 2033
- Figure 26: Asia Pacific Clean Coal Technology Industry Revenue (billion), by Production Analysis 2025 & 2033
- Figure 27: Asia Pacific Clean Coal Technology Industry Revenue Share (%), by Production Analysis 2025 & 2033
- Figure 28: Asia Pacific Clean Coal Technology Industry Revenue (billion), by Consumption Analysis 2025 & 2033
- Figure 29: Asia Pacific Clean Coal Technology Industry Revenue Share (%), by Consumption Analysis 2025 & 2033
- Figure 30: Asia Pacific Clean Coal Technology Industry Revenue (billion), by Import Market Analysis (Value & Volume) 2025 & 2033
- Figure 31: Asia Pacific Clean Coal Technology Industry Revenue Share (%), by Import Market Analysis (Value & Volume) 2025 & 2033
- Figure 32: Asia Pacific Clean Coal Technology Industry Revenue (billion), by Export Market Analysis (Value & Volume) 2025 & 2033
- Figure 33: Asia Pacific Clean Coal Technology Industry Revenue Share (%), by Export Market Analysis (Value & Volume) 2025 & 2033
- Figure 34: Asia Pacific Clean Coal Technology Industry Revenue (billion), by Price Trend Analysis 2025 & 2033
- Figure 35: Asia Pacific Clean Coal Technology Industry Revenue Share (%), by Price Trend Analysis 2025 & 2033
- Figure 36: Asia Pacific Clean Coal Technology Industry Revenue (billion), by Country 2025 & 2033
- Figure 37: Asia Pacific Clean Coal Technology Industry Revenue Share (%), by Country 2025 & 2033
- Figure 38: Middle East and Africa Clean Coal Technology Industry Revenue (billion), by Production Analysis 2025 & 2033
- Figure 39: Middle East and Africa Clean Coal Technology Industry Revenue Share (%), by Production Analysis 2025 & 2033
- Figure 40: Middle East and Africa Clean Coal Technology Industry Revenue (billion), by Consumption Analysis 2025 & 2033
- Figure 41: Middle East and Africa Clean Coal Technology Industry Revenue Share (%), by Consumption Analysis 2025 & 2033
- Figure 42: Middle East and Africa Clean Coal Technology Industry Revenue (billion), by Import Market Analysis (Value & Volume) 2025 & 2033
- Figure 43: Middle East and Africa Clean Coal Technology Industry Revenue Share (%), by Import Market Analysis (Value & Volume) 2025 & 2033
- Figure 44: Middle East and Africa Clean Coal Technology Industry Revenue (billion), by Export Market Analysis (Value & Volume) 2025 & 2033
- Figure 45: Middle East and Africa Clean Coal Technology Industry Revenue Share (%), by Export Market Analysis (Value & Volume) 2025 & 2033
- Figure 46: Middle East and Africa Clean Coal Technology Industry Revenue (billion), by Price Trend Analysis 2025 & 2033
- Figure 47: Middle East and Africa Clean Coal Technology Industry Revenue Share (%), by Price Trend Analysis 2025 & 2033
- Figure 48: Middle East and Africa Clean Coal Technology Industry Revenue (billion), by Country 2025 & 2033
- Figure 49: Middle East and Africa Clean Coal Technology Industry Revenue Share (%), by Country 2025 & 2033
- Figure 50: South America Clean Coal Technology Industry Revenue (billion), by Production Analysis 2025 & 2033
- Figure 51: South America Clean Coal Technology Industry Revenue Share (%), by Production Analysis 2025 & 2033
- Figure 52: South America Clean Coal Technology Industry Revenue (billion), by Consumption Analysis 2025 & 2033
- Figure 53: South America Clean Coal Technology Industry Revenue Share (%), by Consumption Analysis 2025 & 2033
- Figure 54: South America Clean Coal Technology Industry Revenue (billion), by Import Market Analysis (Value & Volume) 2025 & 2033
- Figure 55: South America Clean Coal Technology Industry Revenue Share (%), by Import Market Analysis (Value & Volume) 2025 & 2033
- Figure 56: South America Clean Coal Technology Industry Revenue (billion), by Export Market Analysis (Value & Volume) 2025 & 2033
- Figure 57: South America Clean Coal Technology Industry Revenue Share (%), by Export Market Analysis (Value & Volume) 2025 & 2033
- Figure 58: South America Clean Coal Technology Industry Revenue (billion), by Price Trend Analysis 2025 & 2033
- Figure 59: South America Clean Coal Technology Industry Revenue Share (%), by Price Trend Analysis 2025 & 2033
- Figure 60: South America Clean Coal Technology Industry Revenue (billion), by Country 2025 & 2033
- Figure 61: South America Clean Coal Technology Industry Revenue Share (%), by Country 2025 & 2033
List of Tables
- Table 1: Global Clean Coal Technology Industry Revenue billion Forecast, by Production Analysis 2020 & 2033
- Table 2: Global Clean Coal Technology Industry Revenue billion Forecast, by Consumption Analysis 2020 & 2033
- Table 3: Global Clean Coal Technology Industry Revenue billion Forecast, by Import Market Analysis (Value & Volume) 2020 & 2033
- Table 4: Global Clean Coal Technology Industry Revenue billion Forecast, by Export Market Analysis (Value & Volume) 2020 & 2033
- Table 5: Global Clean Coal Technology Industry Revenue billion Forecast, by Price Trend Analysis 2020 & 2033
- Table 6: Global Clean Coal Technology Industry Revenue billion Forecast, by Region 2020 & 2033
- Table 7: Global Clean Coal Technology Industry Revenue billion Forecast, by Production Analysis 2020 & 2033
- Table 8: Global Clean Coal Technology Industry Revenue billion Forecast, by Consumption Analysis 2020 & 2033
- Table 9: Global Clean Coal Technology Industry Revenue billion Forecast, by Import Market Analysis (Value & Volume) 2020 & 2033
- Table 10: Global Clean Coal Technology Industry Revenue billion Forecast, by Export Market Analysis (Value & Volume) 2020 & 2033
- Table 11: Global Clean Coal Technology Industry Revenue billion Forecast, by Price Trend Analysis 2020 & 2033
- Table 12: Global Clean Coal Technology Industry Revenue billion Forecast, by Country 2020 & 2033
- Table 13: Global Clean Coal Technology Industry Revenue billion Forecast, by Production Analysis 2020 & 2033
- Table 14: Global Clean Coal Technology Industry Revenue billion Forecast, by Consumption Analysis 2020 & 2033
- Table 15: Global Clean Coal Technology Industry Revenue billion Forecast, by Import Market Analysis (Value & Volume) 2020 & 2033
- Table 16: Global Clean Coal Technology Industry Revenue billion Forecast, by Export Market Analysis (Value & Volume) 2020 & 2033
- Table 17: Global Clean Coal Technology Industry Revenue billion Forecast, by Price Trend Analysis 2020 & 2033
- Table 18: Global Clean Coal Technology Industry Revenue billion Forecast, by Country 2020 & 2033
- Table 19: Global Clean Coal Technology Industry Revenue billion Forecast, by Production Analysis 2020 & 2033
- Table 20: Global Clean Coal Technology Industry Revenue billion Forecast, by Consumption Analysis 2020 & 2033
- Table 21: Global Clean Coal Technology Industry Revenue billion Forecast, by Import Market Analysis (Value & Volume) 2020 & 2033
- Table 22: Global Clean Coal Technology Industry Revenue billion Forecast, by Export Market Analysis (Value & Volume) 2020 & 2033
- Table 23: Global Clean Coal Technology Industry Revenue billion Forecast, by Price Trend Analysis 2020 & 2033
- Table 24: Global Clean Coal Technology Industry Revenue billion Forecast, by Country 2020 & 2033
- Table 25: Global Clean Coal Technology Industry Revenue billion Forecast, by Production Analysis 2020 & 2033
- Table 26: Global Clean Coal Technology Industry Revenue billion Forecast, by Consumption Analysis 2020 & 2033
- Table 27: Global Clean Coal Technology Industry Revenue billion Forecast, by Import Market Analysis (Value & Volume) 2020 & 2033
- Table 28: Global Clean Coal Technology Industry Revenue billion Forecast, by Export Market Analysis (Value & Volume) 2020 & 2033
- Table 29: Global Clean Coal Technology Industry Revenue billion Forecast, by Price Trend Analysis 2020 & 2033
- Table 30: Global Clean Coal Technology Industry Revenue billion Forecast, by Country 2020 & 2033
- Table 31: Global Clean Coal Technology Industry Revenue billion Forecast, by Production Analysis 2020 & 2033
- Table 32: Global Clean Coal Technology Industry Revenue billion Forecast, by Consumption Analysis 2020 & 2033
- Table 33: Global Clean Coal Technology Industry Revenue billion Forecast, by Import Market Analysis (Value & Volume) 2020 & 2033
- Table 34: Global Clean Coal Technology Industry Revenue billion Forecast, by Export Market Analysis (Value & Volume) 2020 & 2033
- Table 35: Global Clean Coal Technology Industry Revenue billion Forecast, by Price Trend Analysis 2020 & 2033
- Table 36: Global Clean Coal Technology Industry Revenue billion Forecast, by Country 2020 & 2033
Frequently Asked Questions
1. What is the projected Compound Annual Growth Rate (CAGR) of the Clean Coal Technology Industry?
The projected CAGR is approximately 6.39%.
2. Which companies are prominent players in the Clean Coal Technology Industry?
Key companies in the market include Shell PLC, KBR Inc, Siemens Energy AG, General Electric Company, Alstom SA*List Not Exhaustive.
3. What are the main segments of the Clean Coal Technology Industry?
The market segments include Production Analysis, Consumption Analysis, Import Market Analysis (Value & Volume), Export Market Analysis (Value & Volume), Price Trend Analysis.
4. Can you provide details about the market size?
The market size is estimated to be USD 4.57 billion as of 2022.
5. What are some drivers contributing to market growth?
4.; Modernization and Upgrades of Existing Military Aircraft Fleets4.; Increasing Defense Budgets.
6. What are the notable trends driving market growth?
Growth in Power Consumption is Likely to Drive the Market.
7. Are there any restraints impacting market growth?
4.; Shift Toward Unmanned Aircraft.
8. Can you provide examples of recent developments in the market?
In February 2022, the Indian Institute of Chemical Technology (IICT) announced a collaborative project of approximately INR 7.31 core with Northern Coalfields Limits (NCL), Madhya Pradesh (MP), to take up research and development in the field of sustainable mining and clean coal technologies (CCT).
9. What pricing options are available for accessing the report?
Pricing options include single-user, multi-user, and enterprise licenses priced at USD 4750, USD 5250, and USD 8750 respectively.
10. Is the market size provided in terms of value or volume?
The market size is provided in terms of value, measured in billion.
11. Are there any specific market keywords associated with the report?
Yes, the market keyword associated with the report is "Clean Coal Technology Industry," which aids in identifying and referencing the specific market segment covered.
12. How do I determine which pricing option suits my needs best?
The pricing options vary based on user requirements and access needs. Individual users may opt for single-user licenses, while businesses requiring broader access may choose multi-user or enterprise licenses for cost-effective access to the report.
13. Are there any additional resources or data provided in the Clean Coal Technology Industry report?
While the report offers comprehensive insights, it's advisable to review the specific contents or supplementary materials provided to ascertain if additional resources or data are available.
14. How can I stay updated on further developments or reports in the Clean Coal Technology Industry?
To stay informed about further developments, trends, and reports in the Clean Coal Technology Industry, consider subscribing to industry newsletters, following relevant companies and organizations, or regularly checking reputable industry news sources and publications.
Methodology
Step 1 - Identification of Relevant Samples Size from Population Database


Step 2 - Approaches for Defining Global Market Size (Value, Volume* & Price*)

Note*: In applicable scenarios
Step 3 - Data Sources
Primary Research
- Web Analytics
- Survey Reports
- Research Institute
- Latest Research Reports
- Opinion Leaders
Secondary Research
- Annual Reports
- White Paper
- Latest Press Release
- Industry Association
- Paid Database
- Investor Presentations

Step 4 - Data Triangulation
Involves using different sources of information in order to increase the validity of a study
These sources are likely to be stakeholders in a program - participants, other researchers, program staff, other community members, and so on.
Then we put all data in single framework & apply various statistical tools to find out the dynamic on the market.
During the analysis stage, feedback from the stakeholder groups would be compared to determine areas of agreement as well as areas of divergence