

Key Insights
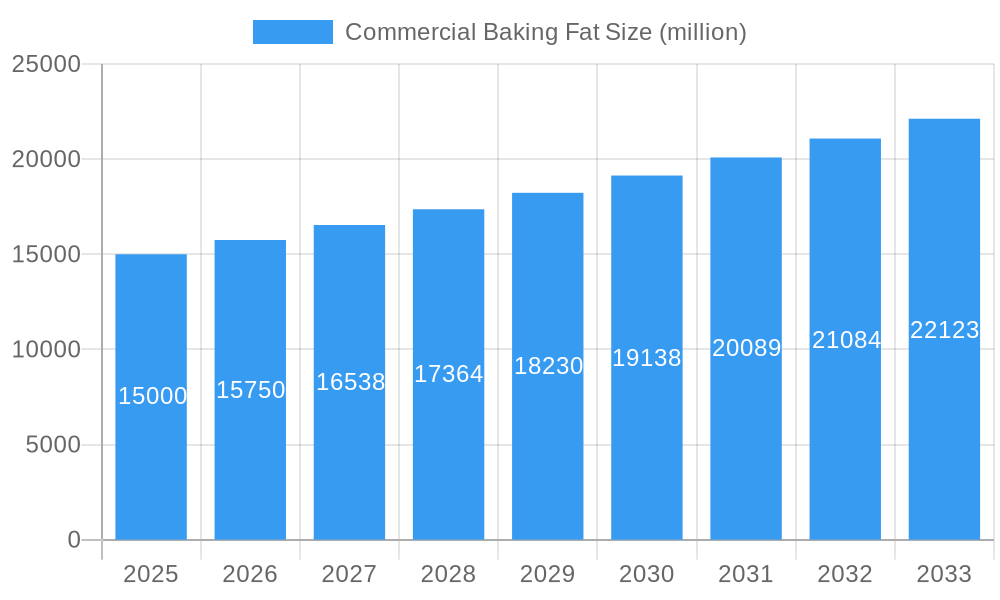
The global commercial baking fat market is poised for significant expansion, driven by escalating demand from the bakery and food processing sectors. Valued at $13.19 billion in 2025, the market is projected to grow at a Compound Annual Growth Rate (CAGR) of 9.42% from 2025 to 2033. This robust growth is attributed to the rising global consumption of baked goods, the increasing preference for convenience foods, and the demand for functional and healthier baking ingredients. Technological advancements and the development of innovative baking fats with enhanced properties further support market growth. Key industry players are strategically expanding their market presence through established distribution channels and strong brand equity. Emerging challenges include raw material price volatility and consumer concerns regarding saturated fats, prompting a shift towards plant-based alternatives.
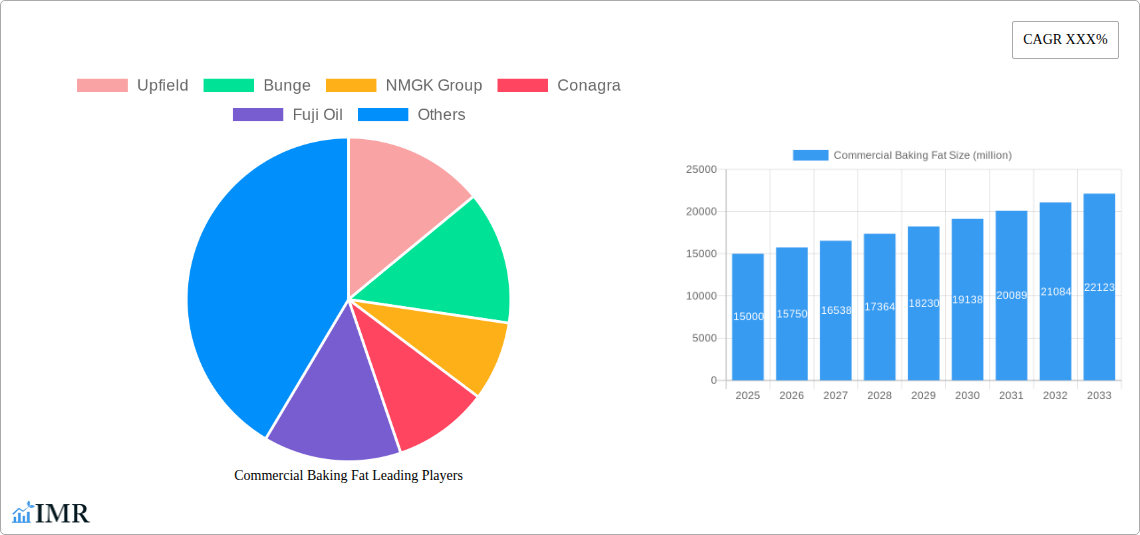
Commercial Baking Fat Market Size (In Billion)
Market segmentation indicates substantial contributions from shortenings, margarines, and specialized fats designed for diverse baking applications. Geographic trends show North America and Europe leading market share, with the Asia-Pacific region demonstrating rapid growth due to urbanization and economic development. The competitive environment is characterized by consolidation, with leading companies prioritizing mergers, acquisitions, product innovation, and strategic alliances. Future market dynamics will be influenced by evolving consumer preferences for healthier fat options, the integration of automation in baking processes, and evolving food safety regulations. Companies are investing in research and development to deliver sustainable and eco-friendly baking fat solutions, aligning with global sustainability trends.
Commercial Baking Fat Company Market Share
Commercial Baking Fat Market Report: 2019-2033
This comprehensive report provides an in-depth analysis of the global commercial baking fat market, covering the period from 2019 to 2033. It delves into market dynamics, growth trends, regional dominance, product landscapes, and key player strategies, offering invaluable insights for industry professionals, investors, and stakeholders. The report utilizes data from the historical period (2019-2024), base year (2025), and estimated year (2025) to project market trends until 2033. The total market value in 2025 is estimated at xx million units.
Commercial Baking Fat Market Dynamics & Structure
This section analyzes the structure and dynamics of the commercial baking fat market, encompassing market concentration, technological innovation, regulatory landscapes, competitive substitutes, and M&A activities. The market is moderately fragmented, with several significant players and numerous regional producers.
- Market Concentration: The top five players (Upfield, Bunge, Cargill, ADM, and AAK) hold an estimated xx% market share in 2025.
- Technological Innovation: Continuous innovation focuses on improving fat functionality (e.g., shortening, plasticity, and flavor stability), reducing trans fat content, and enhancing sustainability (e.g., palm oil alternatives). However, high R&D costs present a barrier to entry for smaller players.
- Regulatory Frameworks: Stringent regulations regarding trans fats and labeling requirements are shaping market trends, driving demand for healthier alternatives. This has led to increased demand for products complying with regional health regulations.
- Competitive Product Substitutes: The market faces competition from other fat alternatives like vegetable oils, margarines, and interesterified fats, each having unique applications impacting overall market growth.
- End-User Demographics: The primary end-users are large-scale commercial bakeries, food manufacturers, and food service providers. Growth is driven by increasing demand for convenience foods and baked goods.
- M&A Trends: The past five years have witnessed xx M&A deals, primarily focused on consolidation and expansion into new markets or product categories. This consolidation is expected to continue.
Commercial Baking Fat Growth Trends & Insights
The global commercial baking fat market experienced significant growth during the historical period (2019-2024), fueled by rising consumer demand for baked goods and processed foods. The market is projected to maintain a robust CAGR of xx% during the forecast period (2025-2033), reaching xx million units by 2033. This growth is attributed to several factors, including increased urbanization, changing dietary habits, and the expansion of the food service industry.
- Market Size Evolution: The market experienced consistent growth from 2019 to 2024, with annual growth rates ranging from xx% to xx%.
- Adoption Rates: Adoption of healthier and sustainably sourced baking fats is increasing due to growing health awareness and consumer demand.
- Technological Disruptions: Advancements in interesterification and fractionation technologies are leading to newer product formulations.
- Consumer Behavior Shifts: Consumers are increasingly favoring healthier and more natural food products, impacting the demand for specific types of baking fat.
Dominant Regions, Countries, or Segments in Commercial Baking Fat
North America and Asia-Pacific are the leading regions in the commercial baking fat market, driven by robust food processing sectors and expanding bakery industries.
- North America: High per capita consumption of baked goods and strong presence of major food manufacturers.
- Asia-Pacific: Rapidly growing economies, increasing population, and expanding middle class are key growth drivers. China and India are the largest markets within this region.
- Europe: Mature market with strong health and sustainability awareness impacting consumer preference towards healthier ingredients.
- Key Drivers: Economic growth, increasing disposable incomes, and changes in consumer preferences towards processed food, which fuel the high demand for commercial baking fat.
Commercial Baking Fat Product Landscape
The commercial baking fat market offers diverse products catering to specific baking needs. Products are categorized by their source (e.g., palm, soybean, sunflower), level of saturation, and functional properties. Recent innovations include low-trans fat options, plant-based alternatives, and fats designed to improve texture and shelf life. Manufacturers are highlighting sustainability certifications and improved functionality in their marketing campaigns.
Key Drivers, Barriers & Challenges in Commercial Baking Fat
Key Drivers:
- Rising demand for bakery products globally.
- Increasing consumer preference for convenient, ready-to-eat food.
- Growth of the food service and fast-food industries.
- Technological advances leading to improved fat functionality and sustainability.
Challenges:
- Fluctuating raw material prices and availability.
- Stringent regulatory requirements and labeling restrictions.
- Growing competition from alternative fats and oils.
- Sustainability concerns associated with palm oil production and impact on supply chain stability.
Emerging Opportunities in Commercial Baking Fat
- Growing demand for clean label products with reduced additives and healthier ingredients.
- Expansion into emerging markets with growing populations and rising disposable incomes.
- Increased focus on sustainable and ethically sourced raw materials, particularly palm oil alternatives.
- Development of customized baking fats for specific applications, improving performance and shelf life.
Growth Accelerators in the Commercial Baking Fat Industry
Strategic partnerships to secure sustainable raw materials, R&D investments to develop innovative products, and expansion into new geographical markets are crucial growth drivers. Focus on delivering tailored solutions that address the unique needs of end-users will further accelerate market growth.
Key Players Shaping the Commercial Baking Fat Market
- Upfield
- Bunge
- NMGK Group
- Conagra
- Fuji Oil
- BRF
- Yildiz Holding
- Grupo Lala
- Cargill
- ADM
- JM Smucker
- AAK
- Wilmar International
- COFCO
- Uni-President
- AB Mauri
- Saputo
- NamChow
- PT. Bonanza Megah
- Mengniu Dairy
- Yili Group
- Bright Dairy & Food
Notable Milestones in Commercial Baking Fat Sector
- 2020: Increased focus on sustainable palm oil sourcing by leading producers.
- 2021: Launch of several new low-trans fat baking fats.
- 2022: Acquisition of a smaller baking fat producer by a major player.
- 2023: Increased focus on plant-based and non-GMO alternatives.
In-Depth Commercial Baking Fat Market Outlook
The commercial baking fat market is poised for continued growth, driven by favorable market trends and industry innovations. Strategic investments in R&D and sustainable sourcing will shape the future of this market. Opportunities exist in developing customized solutions, tapping into emerging markets, and addressing consumer preferences for healthier and more sustainable products. The focus on innovation and sustainability will be key for future success in the commercial baking fat market.
Commercial Baking Fat Segmentation
-
1. Application
- 1.1. Bread
- 1.2. Baked Goods
-
2. Type
- 2.1. Solid
- 2.2. Liquid
Commercial Baking Fat Segmentation By Geography
-
1. North America
- 1.1. United States
- 1.2. Canada
- 1.3. Mexico
-
2. South America
- 2.1. Brazil
- 2.2. Argentina
- 2.3. Rest of South America
-
3. Europe
- 3.1. United Kingdom
- 3.2. Germany
- 3.3. France
- 3.4. Italy
- 3.5. Spain
- 3.6. Russia
- 3.7. Benelux
- 3.8. Nordics
- 3.9. Rest of Europe
-
4. Middle East & Africa
- 4.1. Turkey
- 4.2. Israel
- 4.3. GCC
- 4.4. North Africa
- 4.5. South Africa
- 4.6. Rest of Middle East & Africa
-
5. Asia Pacific
- 5.1. China
- 5.2. India
- 5.3. Japan
- 5.4. South Korea
- 5.5. ASEAN
- 5.6. Oceania
- 5.7. Rest of Asia Pacific

Commercial Baking Fat Regional Market Share
Geographic Coverage of Commercial Baking Fat
Commercial Baking Fat REPORT HIGHLIGHTS
| Aspects | Details |
|---|---|
| Study Period | 2020-2034 |
| Base Year | 2025 |
| Estimated Year | 2026 |
| Forecast Period | 2026-2034 |
| Historical Period | 2020-2025 |
| Growth Rate | CAGR of 9.42% from 2020-2034 |
| Segmentation |
|
Table of Contents
- 1. Introduction
- 1.1. Research Scope
- 1.2. Market Segmentation
- 1.3. Research Objective
- 1.4. Definitions and Assumptions
- 2. Executive Summary
- 2.1. Market Snapshot
- 3. Market Dynamics
- 3.1. Market Drivers
- 3.2. Market Restrains
- 3.3. Market Trends
- 3.4. Market Opportunities
- 4. Market Factor Analysis
- 4.1. Porters Five Forces
- 4.1.1. Bargaining Power of Suppliers
- 4.1.2. Bargaining Power of Buyers
- 4.1.3. Threat of New Entrants
- 4.1.4. Threat of Substitutes
- 4.1.5. Competitive Rivalry
- 4.2. PESTEL analysis
- 4.3. BCG Analysis
- 4.3.1. Stars (High Growth, High Market Share)
- 4.3.2. Cash Cows (Low Growth, High Market Share)
- 4.3.3. Question Mark (High Growth, Low Market Share)
- 4.3.4. Dogs (Low Growth, Low Market Share)
- 4.4. Ansoff Matrix Analysis
- 4.5. Supply Chain Analysis
- 4.6. Regulatory Landscape
- 4.7. Current Market Potential and Opportunity Assessment (TAM–SAM–SOM Framework)
- 4.8. IMR Analyst Note
- 4.1. Porters Five Forces
- 5. Market Analysis, Insights and Forecast 2021-2033
- 5.1. Market Analysis, Insights and Forecast - by Application
- 5.1.1. Bread
- 5.1.2. Baked Goods
- 5.2. Market Analysis, Insights and Forecast - by Type
- 5.2.1. Solid
- 5.2.2. Liquid
- 5.3. Market Analysis, Insights and Forecast - by Region
- 5.3.1. North America
- 5.3.2. South America
- 5.3.3. Europe
- 5.3.4. Middle East & Africa
- 5.3.5. Asia Pacific
- 5.1. Market Analysis, Insights and Forecast - by Application
- 6. Global Commercial Baking Fat Analysis, Insights and Forecast, 2021-2033
- 6.1. Market Analysis, Insights and Forecast - by Application
- 6.1.1. Bread
- 6.1.2. Baked Goods
- 6.2. Market Analysis, Insights and Forecast - by Type
- 6.2.1. Solid
- 6.2.2. Liquid
- 6.1. Market Analysis, Insights and Forecast - by Application
- 7. North America Commercial Baking Fat Analysis, Insights and Forecast, 2020-2032
- 7.1. Market Analysis, Insights and Forecast - by Application
- 7.1.1. Bread
- 7.1.2. Baked Goods
- 7.2. Market Analysis, Insights and Forecast - by Type
- 7.2.1. Solid
- 7.2.2. Liquid
- 7.1. Market Analysis, Insights and Forecast - by Application
- 8. South America Commercial Baking Fat Analysis, Insights and Forecast, 2020-2032
- 8.1. Market Analysis, Insights and Forecast - by Application
- 8.1.1. Bread
- 8.1.2. Baked Goods
- 8.2. Market Analysis, Insights and Forecast - by Type
- 8.2.1. Solid
- 8.2.2. Liquid
- 8.1. Market Analysis, Insights and Forecast - by Application
- 9. Europe Commercial Baking Fat Analysis, Insights and Forecast, 2020-2032
- 9.1. Market Analysis, Insights and Forecast - by Application
- 9.1.1. Bread
- 9.1.2. Baked Goods
- 9.2. Market Analysis, Insights and Forecast - by Type
- 9.2.1. Solid
- 9.2.2. Liquid
- 9.1. Market Analysis, Insights and Forecast - by Application
- 10. Middle East & Africa Commercial Baking Fat Analysis, Insights and Forecast, 2020-2032
- 10.1. Market Analysis, Insights and Forecast - by Application
- 10.1.1. Bread
- 10.1.2. Baked Goods
- 10.2. Market Analysis, Insights and Forecast - by Type
- 10.2.1. Solid
- 10.2.2. Liquid
- 10.1. Market Analysis, Insights and Forecast - by Application
- 11. Asia Pacific Commercial Baking Fat Analysis, Insights and Forecast, 2020-2032
- 11.1. Market Analysis, Insights and Forecast - by Application
- 11.1.1. Bread
- 11.1.2. Baked Goods
- 11.2. Market Analysis, Insights and Forecast - by Type
- 11.2.1. Solid
- 11.2.2. Liquid
- 11.1. Market Analysis, Insights and Forecast - by Application
- 12. Competitive Analysis
- 12.1. Company Profiles
- 12.1.1 Upfield
- 12.1.1.1. Company Overview
- 12.1.1.2. Products
- 12.1.1.3. Company Financials
- 12.1.1.4. SWOT Analysis
- 12.1.2 Bunge
- 12.1.2.1. Company Overview
- 12.1.2.2. Products
- 12.1.2.3. Company Financials
- 12.1.2.4. SWOT Analysis
- 12.1.3 NMGK Group
- 12.1.3.1. Company Overview
- 12.1.3.2. Products
- 12.1.3.3. Company Financials
- 12.1.3.4. SWOT Analysis
- 12.1.4 Conagra
- 12.1.4.1. Company Overview
- 12.1.4.2. Products
- 12.1.4.3. Company Financials
- 12.1.4.4. SWOT Analysis
- 12.1.5 Fuji Oil
- 12.1.5.1. Company Overview
- 12.1.5.2. Products
- 12.1.5.3. Company Financials
- 12.1.5.4. SWOT Analysis
- 12.1.6 BRF
- 12.1.6.1. Company Overview
- 12.1.6.2. Products
- 12.1.6.3. Company Financials
- 12.1.6.4. SWOT Analysis
- 12.1.7 Yildiz Holding
- 12.1.7.1. Company Overview
- 12.1.7.2. Products
- 12.1.7.3. Company Financials
- 12.1.7.4. SWOT Analysis
- 12.1.8 Grupo Lala
- 12.1.8.1. Company Overview
- 12.1.8.2. Products
- 12.1.8.3. Company Financials
- 12.1.8.4. SWOT Analysis
- 12.1.9 Cargill
- 12.1.9.1. Company Overview
- 12.1.9.2. Products
- 12.1.9.3. Company Financials
- 12.1.9.4. SWOT Analysis
- 12.1.10 ADM
- 12.1.10.1. Company Overview
- 12.1.10.2. Products
- 12.1.10.3. Company Financials
- 12.1.10.4. SWOT Analysis
- 12.1.11 JM Smucker
- 12.1.11.1. Company Overview
- 12.1.11.2. Products
- 12.1.11.3. Company Financials
- 12.1.11.4. SWOT Analysis
- 12.1.12 AAK
- 12.1.12.1. Company Overview
- 12.1.12.2. Products
- 12.1.12.3. Company Financials
- 12.1.12.4. SWOT Analysis
- 12.1.13 Wilmar International
- 12.1.13.1. Company Overview
- 12.1.13.2. Products
- 12.1.13.3. Company Financials
- 12.1.13.4. SWOT Analysis
- 12.1.14 COFCO
- 12.1.14.1. Company Overview
- 12.1.14.2. Products
- 12.1.14.3. Company Financials
- 12.1.14.4. SWOT Analysis
- 12.1.15 Uni-President
- 12.1.15.1. Company Overview
- 12.1.15.2. Products
- 12.1.15.3. Company Financials
- 12.1.15.4. SWOT Analysis
- 12.1.16 AB Mauri
- 12.1.16.1. Company Overview
- 12.1.16.2. Products
- 12.1.16.3. Company Financials
- 12.1.16.4. SWOT Analysis
- 12.1.17 Saputo
- 12.1.17.1. Company Overview
- 12.1.17.2. Products
- 12.1.17.3. Company Financials
- 12.1.17.4. SWOT Analysis
- 12.1.18 NamChow
- 12.1.18.1. Company Overview
- 12.1.18.2. Products
- 12.1.18.3. Company Financials
- 12.1.18.4. SWOT Analysis
- 12.1.19 PT. Bonanza Megah
- 12.1.19.1. Company Overview
- 12.1.19.2. Products
- 12.1.19.3. Company Financials
- 12.1.19.4. SWOT Analysis
- 12.1.20 Mengniu Dairy
- 12.1.20.1. Company Overview
- 12.1.20.2. Products
- 12.1.20.3. Company Financials
- 12.1.20.4. SWOT Analysis
- 12.1.21 Yili Group
- 12.1.21.1. Company Overview
- 12.1.21.2. Products
- 12.1.21.3. Company Financials
- 12.1.21.4. SWOT Analysis
- 12.1.22 Bright Dairy & Food
- 12.1.22.1. Company Overview
- 12.1.22.2. Products
- 12.1.22.3. Company Financials
- 12.1.22.4. SWOT Analysis
- 12.1.1 Upfield
- 12.2. Market Entropy
- 12.2.1 Company's Key Areas Served
- 12.2.2 Recent Developments
- 12.3. Company Market Share Analysis 2025
- 12.3.1 Top 5 Companies Market Share Analysis
- 12.3.2 Top 3 Companies Market Share Analysis
- 12.4. List of Potential Customers
- 13. Research Methodology
List of Figures
- Figure 1: Global Commercial Baking Fat Revenue Breakdown (billion, %) by Region 2025 & 2033
- Figure 2: Global Commercial Baking Fat Volume Breakdown (K, %) by Region 2025 & 2033
- Figure 3: North America Commercial Baking Fat Revenue (billion), by Application 2025 & 2033
- Figure 4: North America Commercial Baking Fat Volume (K), by Application 2025 & 2033
- Figure 5: North America Commercial Baking Fat Revenue Share (%), by Application 2025 & 2033
- Figure 6: North America Commercial Baking Fat Volume Share (%), by Application 2025 & 2033
- Figure 7: North America Commercial Baking Fat Revenue (billion), by Type 2025 & 2033
- Figure 8: North America Commercial Baking Fat Volume (K), by Type 2025 & 2033
- Figure 9: North America Commercial Baking Fat Revenue Share (%), by Type 2025 & 2033
- Figure 10: North America Commercial Baking Fat Volume Share (%), by Type 2025 & 2033
- Figure 11: North America Commercial Baking Fat Revenue (billion), by Country 2025 & 2033
- Figure 12: North America Commercial Baking Fat Volume (K), by Country 2025 & 2033
- Figure 13: North America Commercial Baking Fat Revenue Share (%), by Country 2025 & 2033
- Figure 14: North America Commercial Baking Fat Volume Share (%), by Country 2025 & 2033
- Figure 15: South America Commercial Baking Fat Revenue (billion), by Application 2025 & 2033
- Figure 16: South America Commercial Baking Fat Volume (K), by Application 2025 & 2033
- Figure 17: South America Commercial Baking Fat Revenue Share (%), by Application 2025 & 2033
- Figure 18: South America Commercial Baking Fat Volume Share (%), by Application 2025 & 2033
- Figure 19: South America Commercial Baking Fat Revenue (billion), by Type 2025 & 2033
- Figure 20: South America Commercial Baking Fat Volume (K), by Type 2025 & 2033
- Figure 21: South America Commercial Baking Fat Revenue Share (%), by Type 2025 & 2033
- Figure 22: South America Commercial Baking Fat Volume Share (%), by Type 2025 & 2033
- Figure 23: South America Commercial Baking Fat Revenue (billion), by Country 2025 & 2033
- Figure 24: South America Commercial Baking Fat Volume (K), by Country 2025 & 2033
- Figure 25: South America Commercial Baking Fat Revenue Share (%), by Country 2025 & 2033
- Figure 26: South America Commercial Baking Fat Volume Share (%), by Country 2025 & 2033
- Figure 27: Europe Commercial Baking Fat Revenue (billion), by Application 2025 & 2033
- Figure 28: Europe Commercial Baking Fat Volume (K), by Application 2025 & 2033
- Figure 29: Europe Commercial Baking Fat Revenue Share (%), by Application 2025 & 2033
- Figure 30: Europe Commercial Baking Fat Volume Share (%), by Application 2025 & 2033
- Figure 31: Europe Commercial Baking Fat Revenue (billion), by Type 2025 & 2033
- Figure 32: Europe Commercial Baking Fat Volume (K), by Type 2025 & 2033
- Figure 33: Europe Commercial Baking Fat Revenue Share (%), by Type 2025 & 2033
- Figure 34: Europe Commercial Baking Fat Volume Share (%), by Type 2025 & 2033
- Figure 35: Europe Commercial Baking Fat Revenue (billion), by Country 2025 & 2033
- Figure 36: Europe Commercial Baking Fat Volume (K), by Country 2025 & 2033
- Figure 37: Europe Commercial Baking Fat Revenue Share (%), by Country 2025 & 2033
- Figure 38: Europe Commercial Baking Fat Volume Share (%), by Country 2025 & 2033
- Figure 39: Middle East & Africa Commercial Baking Fat Revenue (billion), by Application 2025 & 2033
- Figure 40: Middle East & Africa Commercial Baking Fat Volume (K), by Application 2025 & 2033
- Figure 41: Middle East & Africa Commercial Baking Fat Revenue Share (%), by Application 2025 & 2033
- Figure 42: Middle East & Africa Commercial Baking Fat Volume Share (%), by Application 2025 & 2033
- Figure 43: Middle East & Africa Commercial Baking Fat Revenue (billion), by Type 2025 & 2033
- Figure 44: Middle East & Africa Commercial Baking Fat Volume (K), by Type 2025 & 2033
- Figure 45: Middle East & Africa Commercial Baking Fat Revenue Share (%), by Type 2025 & 2033
- Figure 46: Middle East & Africa Commercial Baking Fat Volume Share (%), by Type 2025 & 2033
- Figure 47: Middle East & Africa Commercial Baking Fat Revenue (billion), by Country 2025 & 2033
- Figure 48: Middle East & Africa Commercial Baking Fat Volume (K), by Country 2025 & 2033
- Figure 49: Middle East & Africa Commercial Baking Fat Revenue Share (%), by Country 2025 & 2033
- Figure 50: Middle East & Africa Commercial Baking Fat Volume Share (%), by Country 2025 & 2033
- Figure 51: Asia Pacific Commercial Baking Fat Revenue (billion), by Application 2025 & 2033
- Figure 52: Asia Pacific Commercial Baking Fat Volume (K), by Application 2025 & 2033
- Figure 53: Asia Pacific Commercial Baking Fat Revenue Share (%), by Application 2025 & 2033
- Figure 54: Asia Pacific Commercial Baking Fat Volume Share (%), by Application 2025 & 2033
- Figure 55: Asia Pacific Commercial Baking Fat Revenue (billion), by Type 2025 & 2033
- Figure 56: Asia Pacific Commercial Baking Fat Volume (K), by Type 2025 & 2033
- Figure 57: Asia Pacific Commercial Baking Fat Revenue Share (%), by Type 2025 & 2033
- Figure 58: Asia Pacific Commercial Baking Fat Volume Share (%), by Type 2025 & 2033
- Figure 59: Asia Pacific Commercial Baking Fat Revenue (billion), by Country 2025 & 2033
- Figure 60: Asia Pacific Commercial Baking Fat Volume (K), by Country 2025 & 2033
- Figure 61: Asia Pacific Commercial Baking Fat Revenue Share (%), by Country 2025 & 2033
- Figure 62: Asia Pacific Commercial Baking Fat Volume Share (%), by Country 2025 & 2033
List of Tables
- Table 1: Global Commercial Baking Fat Revenue billion Forecast, by Application 2020 & 2033
- Table 2: Global Commercial Baking Fat Volume K Forecast, by Application 2020 & 2033
- Table 3: Global Commercial Baking Fat Revenue billion Forecast, by Type 2020 & 2033
- Table 4: Global Commercial Baking Fat Volume K Forecast, by Type 2020 & 2033
- Table 5: Global Commercial Baking Fat Revenue billion Forecast, by Region 2020 & 2033
- Table 6: Global Commercial Baking Fat Volume K Forecast, by Region 2020 & 2033
- Table 7: Global Commercial Baking Fat Revenue billion Forecast, by Application 2020 & 2033
- Table 8: Global Commercial Baking Fat Volume K Forecast, by Application 2020 & 2033
- Table 9: Global Commercial Baking Fat Revenue billion Forecast, by Type 2020 & 2033
- Table 10: Global Commercial Baking Fat Volume K Forecast, by Type 2020 & 2033
- Table 11: Global Commercial Baking Fat Revenue billion Forecast, by Country 2020 & 2033
- Table 12: Global Commercial Baking Fat Volume K Forecast, by Country 2020 & 2033
- Table 13: United States Commercial Baking Fat Revenue (billion) Forecast, by Application 2020 & 2033
- Table 14: United States Commercial Baking Fat Volume (K) Forecast, by Application 2020 & 2033
- Table 15: Canada Commercial Baking Fat Revenue (billion) Forecast, by Application 2020 & 2033
- Table 16: Canada Commercial Baking Fat Volume (K) Forecast, by Application 2020 & 2033
- Table 17: Mexico Commercial Baking Fat Revenue (billion) Forecast, by Application 2020 & 2033
- Table 18: Mexico Commercial Baking Fat Volume (K) Forecast, by Application 2020 & 2033
- Table 19: Global Commercial Baking Fat Revenue billion Forecast, by Application 2020 & 2033
- Table 20: Global Commercial Baking Fat Volume K Forecast, by Application 2020 & 2033
- Table 21: Global Commercial Baking Fat Revenue billion Forecast, by Type 2020 & 2033
- Table 22: Global Commercial Baking Fat Volume K Forecast, by Type 2020 & 2033
- Table 23: Global Commercial Baking Fat Revenue billion Forecast, by Country 2020 & 2033
- Table 24: Global Commercial Baking Fat Volume K Forecast, by Country 2020 & 2033
- Table 25: Brazil Commercial Baking Fat Revenue (billion) Forecast, by Application 2020 & 2033
- Table 26: Brazil Commercial Baking Fat Volume (K) Forecast, by Application 2020 & 2033
- Table 27: Argentina Commercial Baking Fat Revenue (billion) Forecast, by Application 2020 & 2033
- Table 28: Argentina Commercial Baking Fat Volume (K) Forecast, by Application 2020 & 2033
- Table 29: Rest of South America Commercial Baking Fat Revenue (billion) Forecast, by Application 2020 & 2033
- Table 30: Rest of South America Commercial Baking Fat Volume (K) Forecast, by Application 2020 & 2033
- Table 31: Global Commercial Baking Fat Revenue billion Forecast, by Application 2020 & 2033
- Table 32: Global Commercial Baking Fat Volume K Forecast, by Application 2020 & 2033
- Table 33: Global Commercial Baking Fat Revenue billion Forecast, by Type 2020 & 2033
- Table 34: Global Commercial Baking Fat Volume K Forecast, by Type 2020 & 2033
- Table 35: Global Commercial Baking Fat Revenue billion Forecast, by Country 2020 & 2033
- Table 36: Global Commercial Baking Fat Volume K Forecast, by Country 2020 & 2033
- Table 37: United Kingdom Commercial Baking Fat Revenue (billion) Forecast, by Application 2020 & 2033
- Table 38: United Kingdom Commercial Baking Fat Volume (K) Forecast, by Application 2020 & 2033
- Table 39: Germany Commercial Baking Fat Revenue (billion) Forecast, by Application 2020 & 2033
- Table 40: Germany Commercial Baking Fat Volume (K) Forecast, by Application 2020 & 2033
- Table 41: France Commercial Baking Fat Revenue (billion) Forecast, by Application 2020 & 2033
- Table 42: France Commercial Baking Fat Volume (K) Forecast, by Application 2020 & 2033
- Table 43: Italy Commercial Baking Fat Revenue (billion) Forecast, by Application 2020 & 2033
- Table 44: Italy Commercial Baking Fat Volume (K) Forecast, by Application 2020 & 2033
- Table 45: Spain Commercial Baking Fat Revenue (billion) Forecast, by Application 2020 & 2033
- Table 46: Spain Commercial Baking Fat Volume (K) Forecast, by Application 2020 & 2033
- Table 47: Russia Commercial Baking Fat Revenue (billion) Forecast, by Application 2020 & 2033
- Table 48: Russia Commercial Baking Fat Volume (K) Forecast, by Application 2020 & 2033
- Table 49: Benelux Commercial Baking Fat Revenue (billion) Forecast, by Application 2020 & 2033
- Table 50: Benelux Commercial Baking Fat Volume (K) Forecast, by Application 2020 & 2033
- Table 51: Nordics Commercial Baking Fat Revenue (billion) Forecast, by Application 2020 & 2033
- Table 52: Nordics Commercial Baking Fat Volume (K) Forecast, by Application 2020 & 2033
- Table 53: Rest of Europe Commercial Baking Fat Revenue (billion) Forecast, by Application 2020 & 2033
- Table 54: Rest of Europe Commercial Baking Fat Volume (K) Forecast, by Application 2020 & 2033
- Table 55: Global Commercial Baking Fat Revenue billion Forecast, by Application 2020 & 2033
- Table 56: Global Commercial Baking Fat Volume K Forecast, by Application 2020 & 2033
- Table 57: Global Commercial Baking Fat Revenue billion Forecast, by Type 2020 & 2033
- Table 58: Global Commercial Baking Fat Volume K Forecast, by Type 2020 & 2033
- Table 59: Global Commercial Baking Fat Revenue billion Forecast, by Country 2020 & 2033
- Table 60: Global Commercial Baking Fat Volume K Forecast, by Country 2020 & 2033
- Table 61: Turkey Commercial Baking Fat Revenue (billion) Forecast, by Application 2020 & 2033
- Table 62: Turkey Commercial Baking Fat Volume (K) Forecast, by Application 2020 & 2033
- Table 63: Israel Commercial Baking Fat Revenue (billion) Forecast, by Application 2020 & 2033
- Table 64: Israel Commercial Baking Fat Volume (K) Forecast, by Application 2020 & 2033
- Table 65: GCC Commercial Baking Fat Revenue (billion) Forecast, by Application 2020 & 2033
- Table 66: GCC Commercial Baking Fat Volume (K) Forecast, by Application 2020 & 2033
- Table 67: North Africa Commercial Baking Fat Revenue (billion) Forecast, by Application 2020 & 2033
- Table 68: North Africa Commercial Baking Fat Volume (K) Forecast, by Application 2020 & 2033
- Table 69: South Africa Commercial Baking Fat Revenue (billion) Forecast, by Application 2020 & 2033
- Table 70: South Africa Commercial Baking Fat Volume (K) Forecast, by Application 2020 & 2033
- Table 71: Rest of Middle East & Africa Commercial Baking Fat Revenue (billion) Forecast, by Application 2020 & 2033
- Table 72: Rest of Middle East & Africa Commercial Baking Fat Volume (K) Forecast, by Application 2020 & 2033
- Table 73: Global Commercial Baking Fat Revenue billion Forecast, by Application 2020 & 2033
- Table 74: Global Commercial Baking Fat Volume K Forecast, by Application 2020 & 2033
- Table 75: Global Commercial Baking Fat Revenue billion Forecast, by Type 2020 & 2033
- Table 76: Global Commercial Baking Fat Volume K Forecast, by Type 2020 & 2033
- Table 77: Global Commercial Baking Fat Revenue billion Forecast, by Country 2020 & 2033
- Table 78: Global Commercial Baking Fat Volume K Forecast, by Country 2020 & 2033
- Table 79: China Commercial Baking Fat Revenue (billion) Forecast, by Application 2020 & 2033
- Table 80: China Commercial Baking Fat Volume (K) Forecast, by Application 2020 & 2033
- Table 81: India Commercial Baking Fat Revenue (billion) Forecast, by Application 2020 & 2033
- Table 82: India Commercial Baking Fat Volume (K) Forecast, by Application 2020 & 2033
- Table 83: Japan Commercial Baking Fat Revenue (billion) Forecast, by Application 2020 & 2033
- Table 84: Japan Commercial Baking Fat Volume (K) Forecast, by Application 2020 & 2033
- Table 85: South Korea Commercial Baking Fat Revenue (billion) Forecast, by Application 2020 & 2033
- Table 86: South Korea Commercial Baking Fat Volume (K) Forecast, by Application 2020 & 2033
- Table 87: ASEAN Commercial Baking Fat Revenue (billion) Forecast, by Application 2020 & 2033
- Table 88: ASEAN Commercial Baking Fat Volume (K) Forecast, by Application 2020 & 2033
- Table 89: Oceania Commercial Baking Fat Revenue (billion) Forecast, by Application 2020 & 2033
- Table 90: Oceania Commercial Baking Fat Volume (K) Forecast, by Application 2020 & 2033
- Table 91: Rest of Asia Pacific Commercial Baking Fat Revenue (billion) Forecast, by Application 2020 & 2033
- Table 92: Rest of Asia Pacific Commercial Baking Fat Volume (K) Forecast, by Application 2020 & 2033
Frequently Asked Questions
1. What is the projected Compound Annual Growth Rate (CAGR) of the Commercial Baking Fat?
The projected CAGR is approximately 9.42%.
2. Which companies are prominent players in the Commercial Baking Fat?
Key companies in the market include Upfield, Bunge, NMGK Group, Conagra, Fuji Oil, BRF, Yildiz Holding, Grupo Lala, Cargill, ADM, JM Smucker, AAK, Wilmar International, COFCO, Uni-President, AB Mauri, Saputo, NamChow, PT. Bonanza Megah, Mengniu Dairy, Yili Group, Bright Dairy & Food.
3. What are the main segments of the Commercial Baking Fat?
The market segments include Application, Type.
4. Can you provide details about the market size?
The market size is estimated to be USD 13.19 billion as of 2022.
5. What are some drivers contributing to market growth?
N/A
6. What are the notable trends driving market growth?
N/A
7. Are there any restraints impacting market growth?
N/A
8. Can you provide examples of recent developments in the market?
N/A
9. What pricing options are available for accessing the report?
Pricing options include single-user, multi-user, and enterprise licenses priced at USD 3950.00, USD 5925.00, and USD 7900.00 respectively.
10. Is the market size provided in terms of value or volume?
The market size is provided in terms of value, measured in billion and volume, measured in K.
11. Are there any specific market keywords associated with the report?
Yes, the market keyword associated with the report is "Commercial Baking Fat," which aids in identifying and referencing the specific market segment covered.
12. How do I determine which pricing option suits my needs best?
The pricing options vary based on user requirements and access needs. Individual users may opt for single-user licenses, while businesses requiring broader access may choose multi-user or enterprise licenses for cost-effective access to the report.
13. Are there any additional resources or data provided in the Commercial Baking Fat report?
While the report offers comprehensive insights, it's advisable to review the specific contents or supplementary materials provided to ascertain if additional resources or data are available.
14. How can I stay updated on further developments or reports in the Commercial Baking Fat?
To stay informed about further developments, trends, and reports in the Commercial Baking Fat, consider subscribing to industry newsletters, following relevant companies and organizations, or regularly checking reputable industry news sources and publications.
Methodology
Step 1 - Identification of Relevant Samples Size from Population Database


Step 2 - Approaches for Defining Global Market Size (Value, Volume* & Price*)

Note*: In applicable scenarios
Step 3 - Data Sources
Primary Research
- Web Analytics
- Survey Reports
- Research Institute
- Latest Research Reports
- Opinion Leaders
Secondary Research
- Annual Reports
- White Paper
- Latest Press Release
- Industry Association
- Paid Database
- Investor Presentations

Step 4 - Data Triangulation
Involves using different sources of information in order to increase the validity of a study
These sources are likely to be stakeholders in a program - participants, other researchers, program staff, other community members, and so on.
Then we put all data in single framework & apply various statistical tools to find out the dynamic on the market.
During the analysis stage, feedback from the stakeholder groups would be compared to determine areas of agreement as well as areas of divergence