

Key Insights
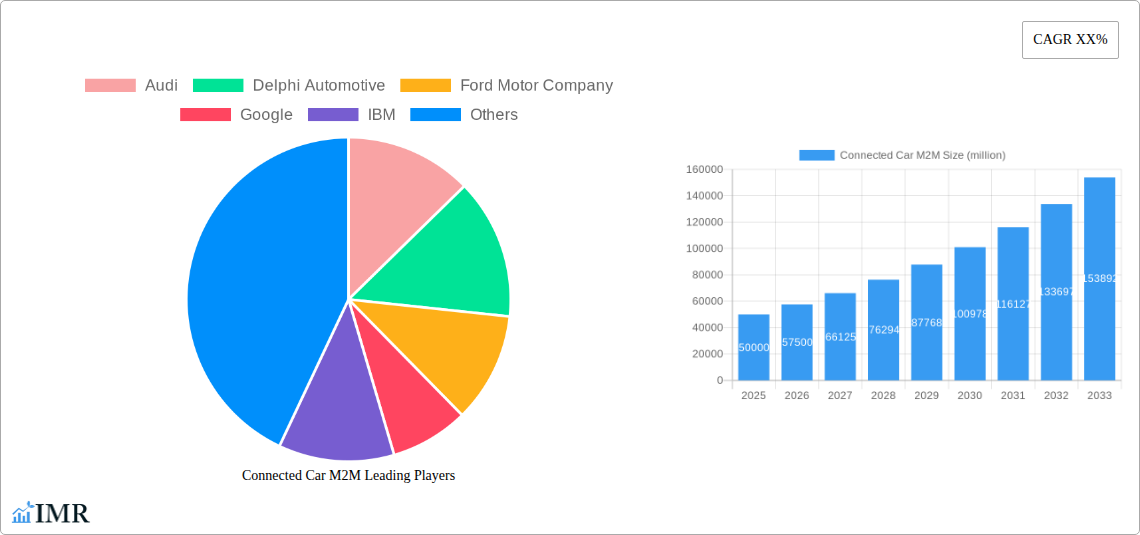
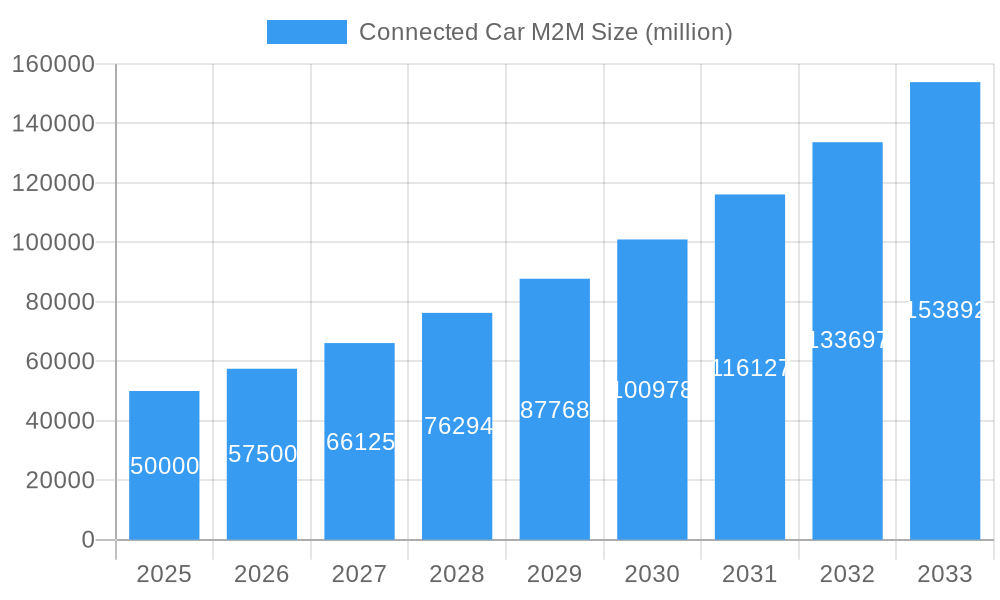
The connected car market, specifically the Machine-to-Machine (M2M) communication segment, is experiencing robust growth fueled by increasing vehicle connectivity, advancements in 5G technology, and the rising demand for enhanced safety and infotainment features. The market, estimated at $50 billion in 2025, is projected to experience a Compound Annual Growth Rate (CAGR) of 15% from 2025 to 2033, driven primarily by the integration of telematics, remote diagnostics, and over-the-air (OTA) updates. Major players like Audi, BMW, Ford, and Google are heavily investing in developing sophisticated M2M communication systems, pushing the boundaries of vehicle intelligence and automation. The increasing adoption of connected car services, coupled with stringent government regulations mandating safety features like emergency response systems, further propel market expansion. Growth is expected across all regions, with North America and Europe leading due to higher vehicle ownership and advanced technological infrastructure. However, challenges like data security concerns, high initial investment costs, and the need for robust network infrastructure in less developed regions could pose some restraints to growth.
Connected Car M2M Market Size (In Billion)
The segmentation within the connected car M2M market is broad, encompassing various communication technologies (e.g., cellular, Wi-Fi), application types (e.g., infotainment, fleet management, safety), and vehicle types (e.g., passenger cars, commercial vehicles). The competitive landscape is characterized by a mix of automotive manufacturers, Tier-1 suppliers, and technology companies. While established automakers focus on integrating M2M solutions into their vehicles, technology giants like Google and IBM are developing innovative platforms and services. Future growth will likely be driven by the increasing adoption of autonomous driving technologies, which rely heavily on robust M2M communication for real-time data exchange and coordination. The integration of artificial intelligence (AI) and machine learning (ML) will further enhance the capabilities of connected car M2M systems, leading to more personalized and proactive services for drivers. This synergistic interplay between established automotive players and tech innovators is set to define the trajectory of this dynamic market in the coming years.
Connected Car M2M Company Market Share
Connected Car M2M Market Report: 2019-2033
This comprehensive report provides an in-depth analysis of the Connected Car M2M market, encompassing market dynamics, growth trends, regional dominance, product landscapes, key players, and future outlook. The study period covers 2019-2033, with a base year of 2025 and a forecast period of 2025-2033. The report leverages extensive primary and secondary research to offer actionable insights for industry professionals, investors, and strategic decision-makers. The parent market is the broader automotive telematics market, while the child market focuses specifically on Machine-to-Machine (M2M) communication within connected vehicles. The global market size is projected to reach xx million units by 2033.
Connected Car M2M Market Dynamics & Structure
This section analyzes the competitive landscape, technological advancements, regulatory influences, and market trends shaping the Connected Car M2M sector. We delve into market concentration, examining the market share of key players such as Audi, BMW, Ford Motor Company, GM, and Toyota. The report also assesses the impact of mergers and acquisitions (M&A) activity, estimating xx M&A deals within the forecast period.
- Market Concentration: Highly fragmented with a few dominant players holding significant market share. The top 5 players account for approximately xx% of the market in 2025.
- Technological Innovation: Focus on 5G technology, improved data security, and AI-driven analytics are key drivers. The development of edge computing and over-the-air (OTA) updates is significantly impacting the market.
- Regulatory Framework: Government regulations regarding data privacy and cybersecurity are creating both challenges and opportunities for innovation. Stricter regulations in certain regions impact market growth, particularly in terms of data handling and security measures.
- Competitive Substitutes: The rise of alternative communication technologies and connected vehicle services may represent future competition.
- End-User Demographics: The increasing adoption of connected cars by younger demographics and affluent consumers drives significant market growth. Consumer preference for advanced features influences demand.
- M&A Trends: Strategic acquisitions and partnerships are prevalent, aiming to consolidate market share and accelerate technological advancements.
Connected Car M2M Growth Trends & Insights
This section provides a detailed analysis of the Connected Car M2M market's evolution, encompassing market size, adoption rates, technological disruptions, and shifts in consumer behavior. Utilizing comprehensive data analysis, we project a Compound Annual Growth Rate (CAGR) of xx% during the forecast period (2025-2033). Market penetration is expected to increase from xx% in 2025 to xx% by 2033, driven primarily by increasing vehicle production and the integration of advanced safety and infotainment features.
The adoption of connected car technologies is expected to accelerate due to a number of factors, including the increasing affordability of connected car technology, the rising demand for advanced safety features, and the growing popularity of infotainment systems. Furthermore, technological advancements such as the development of 5G technology and the rise of artificial intelligence (AI) are driving the growth of the connected car M2M market.
Dominant Regions, Countries, or Segments in Connected Car M2M
North America and Europe currently lead the Connected Car M2M market, driven by robust automotive industries and advanced technological infrastructure. Asia Pacific is experiencing rapid growth, projected to become a major market contributor by 2033.
- North America: High adoption rates driven by early technological advancements and strong consumer demand for connected features.
- Europe: Stringent regulatory environment promoting connected car technology adoption, impacting market share growth.
- Asia Pacific: Rapid expansion fuelled by increasing vehicle production, burgeoning economies, and government support.
- Key Drivers: Government initiatives supporting technological advancements, substantial investments in infrastructure development, and the expansion of cellular network coverage.
Connected Car M2M Product Landscape
The Connected Car M2M product landscape comprises diverse offerings, including telematics control units (TCUs), embedded modems, and various software platforms supporting data management, analytics, and in-vehicle applications. Key features include advanced driver-assistance systems (ADAS), remote diagnostics, over-the-air (OTA) updates, and infotainment services. The market showcases significant innovation in areas like 5G connectivity, enhanced security protocols, and integration of artificial intelligence for improved user experience and safety.
Key Drivers, Barriers & Challenges in Connected Car M2M
Key Drivers: The increasing demand for enhanced safety and security features, the growing adoption of advanced driver-assistance systems (ADAS), and the need for efficient fleet management are significant drivers. Government regulations mandating certain connected car features are also propelling market growth.
Key Barriers and Challenges: High initial investment costs, concerns regarding data security and privacy, and the complexity of integrating diverse systems pose significant challenges. Supply chain disruptions, especially semiconductor shortages, negatively impact production and market growth. The global market faced a xx% decline in production in 2022 due to these shortages.
Emerging Opportunities in Connected Car M2M
Emerging opportunities lie in the expansion of V2X (Vehicle-to-Everything) communication, integration of advanced AI and machine learning capabilities, and the development of new services in areas such as autonomous driving and personalized in-car experiences. Untapped markets in developing economies, offering significant growth potential, present considerable opportunities.
Growth Accelerators in the Connected Car M2M Industry
Long-term growth is fueled by technological breakthroughs in 5G, edge computing, and AI, facilitating seamless data transmission and sophisticated analytics. Strategic collaborations between automotive manufacturers, technology providers, and telecommunication companies accelerate innovation and market expansion. The increasing focus on sustainable mobility and the development of connected electric vehicles further strengthens market prospects.
Key Players Shaping the Connected Car M2M Market
Notable Milestones in Connected Car M2M Sector
- 2020-Q4: Qualcomm launches its Snapdragon Automotive 5G Platform, significantly enhancing connectivity capabilities.
- 2021-Q2: Several major automakers announce partnerships to develop standardized data protocols for connected car services.
- 2022-Q1: A significant increase in investments in cybersecurity solutions for connected vehicles is observed following several high-profile security breaches.
- 2023-Q3: The first commercial deployment of a V2X system using 5G technology is achieved in a major European city.
In-Depth Connected Car M2M Market Outlook
The Connected Car M2M market exhibits strong long-term growth potential, driven by ongoing technological advancements, increasing consumer demand, and supportive government regulations. Strategic partnerships and investments in R&D will further accelerate market expansion. The increasing integration of connected car features into a wider ecosystem of smart cities and transportation systems provides significant future opportunities. The market is expected to witness substantial growth in emerging markets as these regions experience greater technological adoption.
Connected Car M2M Segmentation
-
1. Application
- 1.1. Safety And Security
- 1.2. Infotainment
- 1.3. Driver Assistance
- 1.4. Vehicle Management
- 1.5. On-Drive Management
- 1.6. Others
-
2. Types
- 2.1. Embedded Solutions
- 2.2. Integrated Solutions
- 2.3. Tethered Solutions
Connected Car M2M Segmentation By Geography
-
1. North America
- 1.1. United States
- 1.2. Canada
- 1.3. Mexico
-
2. South America
- 2.1. Brazil
- 2.2. Argentina
- 2.3. Rest of South America
-
3. Europe
- 3.1. United Kingdom
- 3.2. Germany
- 3.3. France
- 3.4. Italy
- 3.5. Spain
- 3.6. Russia
- 3.7. Benelux
- 3.8. Nordics
- 3.9. Rest of Europe
-
4. Middle East & Africa
- 4.1. Turkey
- 4.2. Israel
- 4.3. GCC
- 4.4. North Africa
- 4.5. South Africa
- 4.6. Rest of Middle East & Africa
-
5. Asia Pacific
- 5.1. China
- 5.2. India
- 5.3. Japan
- 5.4. South Korea
- 5.5. ASEAN
- 5.6. Oceania
- 5.7. Rest of Asia Pacific

Connected Car M2M Regional Market Share
Geographic Coverage of Connected Car M2M
Connected Car M2M REPORT HIGHLIGHTS
| Aspects | Details |
|---|---|
| Study Period | 2020-2034 |
| Base Year | 2025 |
| Estimated Year | 2026 |
| Forecast Period | 2026-2034 |
| Historical Period | 2020-2025 |
| Growth Rate | CAGR of 22.3% from 2020-2034 |
| Segmentation |
|
Table of Contents
- 1. Introduction
- 1.1. Research Scope
- 1.2. Market Segmentation
- 1.3. Research Objective
- 1.4. Definitions and Assumptions
- 2. Executive Summary
- 2.1. Market Snapshot
- 3. Market Dynamics
- 3.1. Market Drivers
- 3.2. Market Restrains
- 3.3. Market Trends
- 3.4. Market Opportunities
- 4. Market Factor Analysis
- 4.1. Porters Five Forces
- 4.1.1. Bargaining Power of Suppliers
- 4.1.2. Bargaining Power of Buyers
- 4.1.3. Threat of New Entrants
- 4.1.4. Threat of Substitutes
- 4.1.5. Competitive Rivalry
- 4.2. PESTEL analysis
- 4.3. BCG Analysis
- 4.3.1. Stars (High Growth, High Market Share)
- 4.3.2. Cash Cows (Low Growth, High Market Share)
- 4.3.3. Question Mark (High Growth, Low Market Share)
- 4.3.4. Dogs (Low Growth, Low Market Share)
- 4.4. Ansoff Matrix Analysis
- 4.5. Supply Chain Analysis
- 4.6. Regulatory Landscape
- 4.7. Current Market Potential and Opportunity Assessment (TAM–SAM–SOM Framework)
- 4.8. IMR Analyst Note
- 4.1. Porters Five Forces
- 5. Market Analysis, Insights and Forecast 2021-2033
- 5.1. Market Analysis, Insights and Forecast - by Application
- 5.1.1. Safety And Security
- 5.1.2. Infotainment
- 5.1.3. Driver Assistance
- 5.1.4. Vehicle Management
- 5.1.5. On-Drive Management
- 5.1.6. Others
- 5.2. Market Analysis, Insights and Forecast - by Types
- 5.2.1. Embedded Solutions
- 5.2.2. Integrated Solutions
- 5.2.3. Tethered Solutions
- 5.3. Market Analysis, Insights and Forecast - by Region
- 5.3.1. North America
- 5.3.2. South America
- 5.3.3. Europe
- 5.3.4. Middle East & Africa
- 5.3.5. Asia Pacific
- 5.1. Market Analysis, Insights and Forecast - by Application
- 6. Global Connected Car M2M Analysis, Insights and Forecast, 2021-2033
- 6.1. Market Analysis, Insights and Forecast - by Application
- 6.1.1. Safety And Security
- 6.1.2. Infotainment
- 6.1.3. Driver Assistance
- 6.1.4. Vehicle Management
- 6.1.5. On-Drive Management
- 6.1.6. Others
- 6.2. Market Analysis, Insights and Forecast - by Types
- 6.2.1. Embedded Solutions
- 6.2.2. Integrated Solutions
- 6.2.3. Tethered Solutions
- 6.1. Market Analysis, Insights and Forecast - by Application
- 7. North America Connected Car M2M Analysis, Insights and Forecast, 2020-2032
- 7.1. Market Analysis, Insights and Forecast - by Application
- 7.1.1. Safety And Security
- 7.1.2. Infotainment
- 7.1.3. Driver Assistance
- 7.1.4. Vehicle Management
- 7.1.5. On-Drive Management
- 7.1.6. Others
- 7.2. Market Analysis, Insights and Forecast - by Types
- 7.2.1. Embedded Solutions
- 7.2.2. Integrated Solutions
- 7.2.3. Tethered Solutions
- 7.1. Market Analysis, Insights and Forecast - by Application
- 8. South America Connected Car M2M Analysis, Insights and Forecast, 2020-2032
- 8.1. Market Analysis, Insights and Forecast - by Application
- 8.1.1. Safety And Security
- 8.1.2. Infotainment
- 8.1.3. Driver Assistance
- 8.1.4. Vehicle Management
- 8.1.5. On-Drive Management
- 8.1.6. Others
- 8.2. Market Analysis, Insights and Forecast - by Types
- 8.2.1. Embedded Solutions
- 8.2.2. Integrated Solutions
- 8.2.3. Tethered Solutions
- 8.1. Market Analysis, Insights and Forecast - by Application
- 9. Europe Connected Car M2M Analysis, Insights and Forecast, 2020-2032
- 9.1. Market Analysis, Insights and Forecast - by Application
- 9.1.1. Safety And Security
- 9.1.2. Infotainment
- 9.1.3. Driver Assistance
- 9.1.4. Vehicle Management
- 9.1.5. On-Drive Management
- 9.1.6. Others
- 9.2. Market Analysis, Insights and Forecast - by Types
- 9.2.1. Embedded Solutions
- 9.2.2. Integrated Solutions
- 9.2.3. Tethered Solutions
- 9.1. Market Analysis, Insights and Forecast - by Application
- 10. Middle East & Africa Connected Car M2M Analysis, Insights and Forecast, 2020-2032
- 10.1. Market Analysis, Insights and Forecast - by Application
- 10.1.1. Safety And Security
- 10.1.2. Infotainment
- 10.1.3. Driver Assistance
- 10.1.4. Vehicle Management
- 10.1.5. On-Drive Management
- 10.1.6. Others
- 10.2. Market Analysis, Insights and Forecast - by Types
- 10.2.1. Embedded Solutions
- 10.2.2. Integrated Solutions
- 10.2.3. Tethered Solutions
- 10.1. Market Analysis, Insights and Forecast - by Application
- 11. Asia Pacific Connected Car M2M Analysis, Insights and Forecast, 2020-2032
- 11.1. Market Analysis, Insights and Forecast - by Application
- 11.1.1. Safety And Security
- 11.1.2. Infotainment
- 11.1.3. Driver Assistance
- 11.1.4. Vehicle Management
- 11.1.5. On-Drive Management
- 11.1.6. Others
- 11.2. Market Analysis, Insights and Forecast - by Types
- 11.2.1. Embedded Solutions
- 11.2.2. Integrated Solutions
- 11.2.3. Tethered Solutions
- 11.1. Market Analysis, Insights and Forecast - by Application
- 12. Competitive Analysis
- 12.1. Company Profiles
- 12.1.1 Audi
- 12.1.1.1. Company Overview
- 12.1.1.2. Products
- 12.1.1.3. Company Financials
- 12.1.1.4. SWOT Analysis
- 12.1.2 Delphi Automotive
- 12.1.2.1. Company Overview
- 12.1.2.2. Products
- 12.1.2.3. Company Financials
- 12.1.2.4. SWOT Analysis
- 12.1.3 Ford Motor Company
- 12.1.3.1. Company Overview
- 12.1.3.2. Products
- 12.1.3.3. Company Financials
- 12.1.3.4. SWOT Analysis
- 12.1.4 Google
- 12.1.4.1. Company Overview
- 12.1.4.2. Products
- 12.1.4.3. Company Financials
- 12.1.4.4. SWOT Analysis
- 12.1.5 IBM
- 12.1.5.1. Company Overview
- 12.1.5.2. Products
- 12.1.5.3. Company Financials
- 12.1.5.4. SWOT Analysis
- 12.1.6 Alpine Electronics
- 12.1.6.1. Company Overview
- 12.1.6.2. Products
- 12.1.6.3. Company Financials
- 12.1.6.4. SWOT Analysis
- 12.1.7 BMW
- 12.1.7.1. Company Overview
- 12.1.7.2. Products
- 12.1.7.3. Company Financials
- 12.1.7.4. SWOT Analysis
- 12.1.8 GM
- 12.1.8.1. Company Overview
- 12.1.8.2. Products
- 12.1.8.3. Company Financials
- 12.1.8.4. SWOT Analysis
- 12.1.9 Bosch
- 12.1.9.1. Company Overview
- 12.1.9.2. Products
- 12.1.9.3. Company Financials
- 12.1.9.4. SWOT Analysis
- 12.1.10 Mercedes-Benz
- 12.1.10.1. Company Overview
- 12.1.10.2. Products
- 12.1.10.3. Company Financials
- 12.1.10.4. SWOT Analysis
- 12.1.11 NXP Semiconductors
- 12.1.11.1. Company Overview
- 12.1.11.2. Products
- 12.1.11.3. Company Financials
- 12.1.11.4. SWOT Analysis
- 12.1.12 PSA Peugeot Citroen
- 12.1.12.1. Company Overview
- 12.1.12.2. Products
- 12.1.12.3. Company Financials
- 12.1.12.4. SWOT Analysis
- 12.1.13 Qualcomm
- 12.1.13.1. Company Overview
- 12.1.13.2. Products
- 12.1.13.3. Company Financials
- 12.1.13.4. SWOT Analysis
- 12.1.14 Toyota
- 12.1.14.1. Company Overview
- 12.1.14.2. Products
- 12.1.14.3. Company Financials
- 12.1.14.4. SWOT Analysis
- 12.1.15 Volkswagen
- 12.1.15.1. Company Overview
- 12.1.15.2. Products
- 12.1.15.3. Company Financials
- 12.1.15.4. SWOT Analysis
- 12.1.16 Wipro
- 12.1.16.1. Company Overview
- 12.1.16.2. Products
- 12.1.16.3. Company Financials
- 12.1.16.4. SWOT Analysis
- 12.1.17 Sierra Wireless
- 12.1.17.1. Company Overview
- 12.1.17.2. Products
- 12.1.17.3. Company Financials
- 12.1.17.4. SWOT Analysis
- 12.1.18 Tech Mahindra
- 12.1.18.1. Company Overview
- 12.1.18.2. Products
- 12.1.18.3. Company Financials
- 12.1.18.4. SWOT Analysis
- 12.1.1 Audi
- 12.2. Market Entropy
- 12.2.1 Company's Key Areas Served
- 12.2.2 Recent Developments
- 12.3. Company Market Share Analysis 2025
- 12.3.1 Top 5 Companies Market Share Analysis
- 12.3.2 Top 3 Companies Market Share Analysis
- 12.4. List of Potential Customers
- 13. Research Methodology
List of Figures
- Figure 1: Global Connected Car M2M Revenue Breakdown (billion, %) by Region 2025 & 2033
- Figure 2: North America Connected Car M2M Revenue (billion), by Application 2025 & 2033
- Figure 3: North America Connected Car M2M Revenue Share (%), by Application 2025 & 2033
- Figure 4: North America Connected Car M2M Revenue (billion), by Types 2025 & 2033
- Figure 5: North America Connected Car M2M Revenue Share (%), by Types 2025 & 2033
- Figure 6: North America Connected Car M2M Revenue (billion), by Country 2025 & 2033
- Figure 7: North America Connected Car M2M Revenue Share (%), by Country 2025 & 2033
- Figure 8: South America Connected Car M2M Revenue (billion), by Application 2025 & 2033
- Figure 9: South America Connected Car M2M Revenue Share (%), by Application 2025 & 2033
- Figure 10: South America Connected Car M2M Revenue (billion), by Types 2025 & 2033
- Figure 11: South America Connected Car M2M Revenue Share (%), by Types 2025 & 2033
- Figure 12: South America Connected Car M2M Revenue (billion), by Country 2025 & 2033
- Figure 13: South America Connected Car M2M Revenue Share (%), by Country 2025 & 2033
- Figure 14: Europe Connected Car M2M Revenue (billion), by Application 2025 & 2033
- Figure 15: Europe Connected Car M2M Revenue Share (%), by Application 2025 & 2033
- Figure 16: Europe Connected Car M2M Revenue (billion), by Types 2025 & 2033
- Figure 17: Europe Connected Car M2M Revenue Share (%), by Types 2025 & 2033
- Figure 18: Europe Connected Car M2M Revenue (billion), by Country 2025 & 2033
- Figure 19: Europe Connected Car M2M Revenue Share (%), by Country 2025 & 2033
- Figure 20: Middle East & Africa Connected Car M2M Revenue (billion), by Application 2025 & 2033
- Figure 21: Middle East & Africa Connected Car M2M Revenue Share (%), by Application 2025 & 2033
- Figure 22: Middle East & Africa Connected Car M2M Revenue (billion), by Types 2025 & 2033
- Figure 23: Middle East & Africa Connected Car M2M Revenue Share (%), by Types 2025 & 2033
- Figure 24: Middle East & Africa Connected Car M2M Revenue (billion), by Country 2025 & 2033
- Figure 25: Middle East & Africa Connected Car M2M Revenue Share (%), by Country 2025 & 2033
- Figure 26: Asia Pacific Connected Car M2M Revenue (billion), by Application 2025 & 2033
- Figure 27: Asia Pacific Connected Car M2M Revenue Share (%), by Application 2025 & 2033
- Figure 28: Asia Pacific Connected Car M2M Revenue (billion), by Types 2025 & 2033
- Figure 29: Asia Pacific Connected Car M2M Revenue Share (%), by Types 2025 & 2033
- Figure 30: Asia Pacific Connected Car M2M Revenue (billion), by Country 2025 & 2033
- Figure 31: Asia Pacific Connected Car M2M Revenue Share (%), by Country 2025 & 2033
List of Tables
- Table 1: Global Connected Car M2M Revenue billion Forecast, by Application 2020 & 2033
- Table 2: Global Connected Car M2M Revenue billion Forecast, by Types 2020 & 2033
- Table 3: Global Connected Car M2M Revenue billion Forecast, by Region 2020 & 2033
- Table 4: Global Connected Car M2M Revenue billion Forecast, by Application 2020 & 2033
- Table 5: Global Connected Car M2M Revenue billion Forecast, by Types 2020 & 2033
- Table 6: Global Connected Car M2M Revenue billion Forecast, by Country 2020 & 2033
- Table 7: United States Connected Car M2M Revenue (billion) Forecast, by Application 2020 & 2033
- Table 8: Canada Connected Car M2M Revenue (billion) Forecast, by Application 2020 & 2033
- Table 9: Mexico Connected Car M2M Revenue (billion) Forecast, by Application 2020 & 2033
- Table 10: Global Connected Car M2M Revenue billion Forecast, by Application 2020 & 2033
- Table 11: Global Connected Car M2M Revenue billion Forecast, by Types 2020 & 2033
- Table 12: Global Connected Car M2M Revenue billion Forecast, by Country 2020 & 2033
- Table 13: Brazil Connected Car M2M Revenue (billion) Forecast, by Application 2020 & 2033
- Table 14: Argentina Connected Car M2M Revenue (billion) Forecast, by Application 2020 & 2033
- Table 15: Rest of South America Connected Car M2M Revenue (billion) Forecast, by Application 2020 & 2033
- Table 16: Global Connected Car M2M Revenue billion Forecast, by Application 2020 & 2033
- Table 17: Global Connected Car M2M Revenue billion Forecast, by Types 2020 & 2033
- Table 18: Global Connected Car M2M Revenue billion Forecast, by Country 2020 & 2033
- Table 19: United Kingdom Connected Car M2M Revenue (billion) Forecast, by Application 2020 & 2033
- Table 20: Germany Connected Car M2M Revenue (billion) Forecast, by Application 2020 & 2033
- Table 21: France Connected Car M2M Revenue (billion) Forecast, by Application 2020 & 2033
- Table 22: Italy Connected Car M2M Revenue (billion) Forecast, by Application 2020 & 2033
- Table 23: Spain Connected Car M2M Revenue (billion) Forecast, by Application 2020 & 2033
- Table 24: Russia Connected Car M2M Revenue (billion) Forecast, by Application 2020 & 2033
- Table 25: Benelux Connected Car M2M Revenue (billion) Forecast, by Application 2020 & 2033
- Table 26: Nordics Connected Car M2M Revenue (billion) Forecast, by Application 2020 & 2033
- Table 27: Rest of Europe Connected Car M2M Revenue (billion) Forecast, by Application 2020 & 2033
- Table 28: Global Connected Car M2M Revenue billion Forecast, by Application 2020 & 2033
- Table 29: Global Connected Car M2M Revenue billion Forecast, by Types 2020 & 2033
- Table 30: Global Connected Car M2M Revenue billion Forecast, by Country 2020 & 2033
- Table 31: Turkey Connected Car M2M Revenue (billion) Forecast, by Application 2020 & 2033
- Table 32: Israel Connected Car M2M Revenue (billion) Forecast, by Application 2020 & 2033
- Table 33: GCC Connected Car M2M Revenue (billion) Forecast, by Application 2020 & 2033
- Table 34: North Africa Connected Car M2M Revenue (billion) Forecast, by Application 2020 & 2033
- Table 35: South Africa Connected Car M2M Revenue (billion) Forecast, by Application 2020 & 2033
- Table 36: Rest of Middle East & Africa Connected Car M2M Revenue (billion) Forecast, by Application 2020 & 2033
- Table 37: Global Connected Car M2M Revenue billion Forecast, by Application 2020 & 2033
- Table 38: Global Connected Car M2M Revenue billion Forecast, by Types 2020 & 2033
- Table 39: Global Connected Car M2M Revenue billion Forecast, by Country 2020 & 2033
- Table 40: China Connected Car M2M Revenue (billion) Forecast, by Application 2020 & 2033
- Table 41: India Connected Car M2M Revenue (billion) Forecast, by Application 2020 & 2033
- Table 42: Japan Connected Car M2M Revenue (billion) Forecast, by Application 2020 & 2033
- Table 43: South Korea Connected Car M2M Revenue (billion) Forecast, by Application 2020 & 2033
- Table 44: ASEAN Connected Car M2M Revenue (billion) Forecast, by Application 2020 & 2033
- Table 45: Oceania Connected Car M2M Revenue (billion) Forecast, by Application 2020 & 2033
- Table 46: Rest of Asia Pacific Connected Car M2M Revenue (billion) Forecast, by Application 2020 & 2033
Frequently Asked Questions
1. What is the projected Compound Annual Growth Rate (CAGR) of the Connected Car M2M?
The projected CAGR is approximately 22.3%.
2. Which companies are prominent players in the Connected Car M2M?
Key companies in the market include Audi, Delphi Automotive, Ford Motor Company, Google, IBM, Alpine Electronics, BMW, GM, Bosch, Mercedes-Benz, NXP Semiconductors, PSA Peugeot Citroen, Qualcomm, Toyota, Volkswagen, Wipro, Sierra Wireless, Tech Mahindra.
3. What are the main segments of the Connected Car M2M?
The market segments include Application, Types.
4. Can you provide details about the market size?
The market size is estimated to be USD 69.4 billion as of 2022.
5. What are some drivers contributing to market growth?
N/A
6. What are the notable trends driving market growth?
N/A
7. Are there any restraints impacting market growth?
N/A
8. Can you provide examples of recent developments in the market?
N/A
9. What pricing options are available for accessing the report?
Pricing options include single-user, multi-user, and enterprise licenses priced at USD 2900.00, USD 4350.00, and USD 5800.00 respectively.
10. Is the market size provided in terms of value or volume?
The market size is provided in terms of value, measured in billion.
11. Are there any specific market keywords associated with the report?
Yes, the market keyword associated with the report is "Connected Car M2M," which aids in identifying and referencing the specific market segment covered.
12. How do I determine which pricing option suits my needs best?
The pricing options vary based on user requirements and access needs. Individual users may opt for single-user licenses, while businesses requiring broader access may choose multi-user or enterprise licenses for cost-effective access to the report.
13. Are there any additional resources or data provided in the Connected Car M2M report?
While the report offers comprehensive insights, it's advisable to review the specific contents or supplementary materials provided to ascertain if additional resources or data are available.
14. How can I stay updated on further developments or reports in the Connected Car M2M?
To stay informed about further developments, trends, and reports in the Connected Car M2M, consider subscribing to industry newsletters, following relevant companies and organizations, or regularly checking reputable industry news sources and publications.
Methodology
Step 1 - Identification of Relevant Samples Size from Population Database


Step 2 - Approaches for Defining Global Market Size (Value, Volume* & Price*)

Note*: In applicable scenarios
Step 3 - Data Sources
Primary Research
- Web Analytics
- Survey Reports
- Research Institute
- Latest Research Reports
- Opinion Leaders
Secondary Research
- Annual Reports
- White Paper
- Latest Press Release
- Industry Association
- Paid Database
- Investor Presentations

Step 4 - Data Triangulation
Involves using different sources of information in order to increase the validity of a study
These sources are likely to be stakeholders in a program - participants, other researchers, program staff, other community members, and so on.
Then we put all data in single framework & apply various statistical tools to find out the dynamic on the market.
During the analysis stage, feedback from the stakeholder groups would be compared to determine areas of agreement as well as areas of divergence