

Key Insights
The global market for Connectors for Food Production is poised for significant expansion, projected to reach $94.05 billion in 2025. This growth is underpinned by a robust Compound Annual Growth Rate (CAGR) of 6.85% during the forecast period of 2025-2033. The primary drivers fueling this expansion include the ever-increasing demand for automated and efficient food processing, packaging, and transportation solutions. As food manufacturers strive to enhance productivity, ensure product safety and traceability, and reduce operational costs, the adoption of advanced connector technologies becomes paramount. These connectors are integral to the seamless functioning of sophisticated machinery, enabling reliable data transfer, power supply, and signal transmission in harsh food production environments, which often involve stringent hygiene standards, washdowns, and temperature fluctuations. The rising global population and evolving consumer preferences for convenience foods further amplify the need for sophisticated food production infrastructure, directly translating into higher demand for specialized connectors.
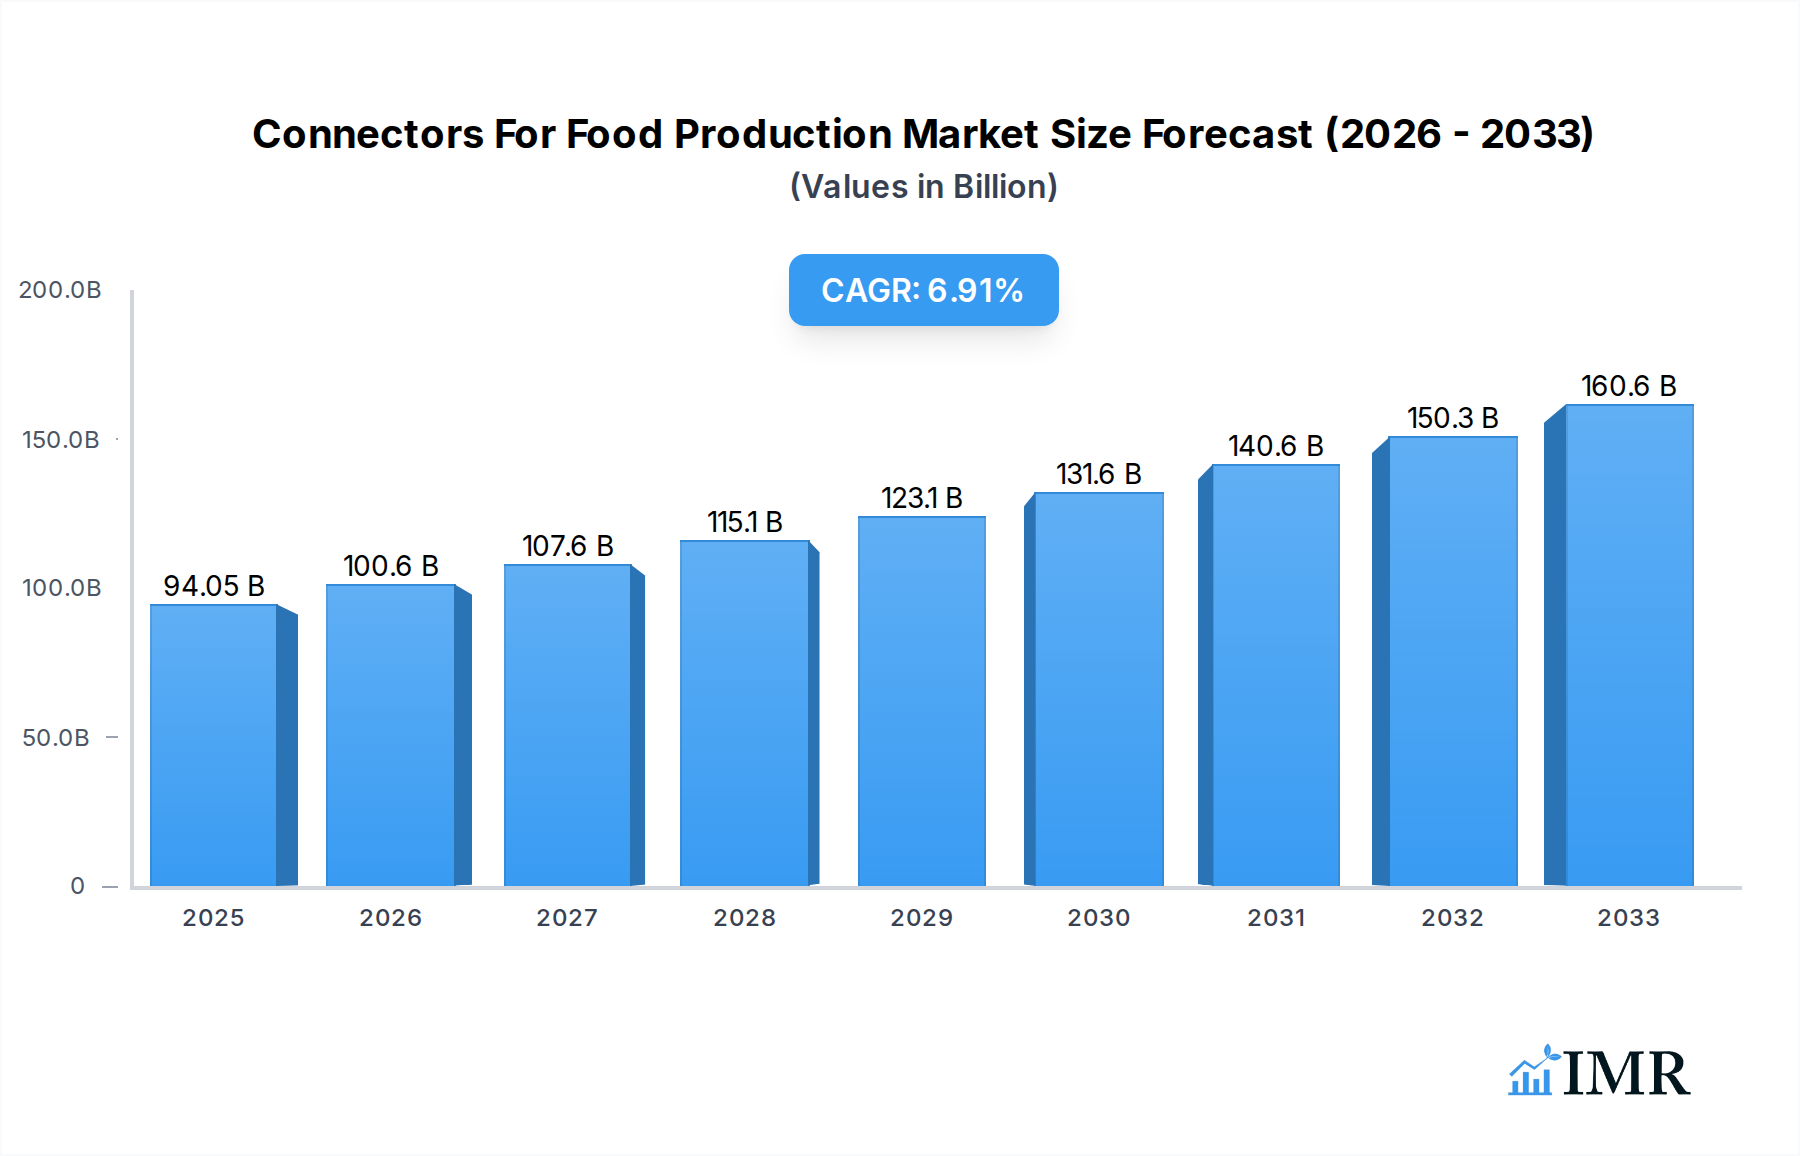
Connectors For Food Production Market Size (In Billion)
The market is segmented by application into Food Processing Equipment, Food Packaging Equipment, Food Transportation Equipment, and Others, with Food Processing and Packaging Equipment expected to represent the largest shares due to their critical role in the value chain. By type, M12 and M8 connectors are anticipated to dominate, owing to their compact size, robust construction, and superior sealing capabilities, making them ideal for hygiene-sensitive applications. Key players like Harting, Binder, and Belden are actively innovating to offer rugged, high-performance connectors that comply with food-grade certifications and industry standards, driving market trends towards miniaturization, wireless connectivity, and enhanced data transmission speeds. However, the market may face certain restraints such as the high initial investment costs for advanced connector systems and the complexity of integrating new technologies into existing legacy infrastructure. Despite these challenges, the growing emphasis on Industry 4.0 principles in the food industry, including the implementation of IoT devices and predictive maintenance, will continue to propel the demand for these essential components.

Connectors For Food Production Company Market Share
This comprehensive report delves into the dynamic Connectors for Food Production Market, offering a granular analysis of market drivers, growth trends, regional dominance, product innovations, and the competitive landscape. With a deep dive into the parent market of industrial connectors and its significant contribution to the child market of food production connectors, this study provides actionable insights for stakeholders across the value chain.
Connectors For Food Production Market Dynamics & Structure
The Connectors for Food Production Market is characterized by a moderately concentrated structure, with key players like Harting, Binder, Belden, Colder Products Company, ESCHA, Northern Connectors, Fortop, U.I. Lapp, HUMMEL, Lumberg Automation, Pepperl+Fuchs, and Murrelektronik holding significant influence. Technological innovation, particularly in areas of hygiene, robust design, and signal integrity, acts as a primary driver. The increasing adoption of automation and Industry 4.0 principles within food processing and packaging necessitates advanced, reliable connection solutions. Stringent regulatory frameworks governing food safety and electrical standards, such as IP ratings and FDA compliance, shape product development and market entry. Competitive product substitutes, though present in less specialized applications, are often outperformed by purpose-built connectors in demanding food environments. End-user demographics span a wide spectrum, from large-scale industrial food manufacturers to specialized processing plants and packaging facilities. Merger and acquisition (M&A) trends are observed as companies seek to expand their product portfolios, geographical reach, and technological capabilities. For instance, several strategic acquisitions have occurred in the historical period (2019-2024) aimed at enhancing offerings in hygienic design and data transmission capabilities, contributing to an estimated xx% increase in deal volumes within the broader industrial connector space. Innovation barriers include the high cost of R&D for specialized, food-grade materials and the lengthy certification processes required for new products entering this highly regulated sector.
Connectors For Food Production Growth Trends & Insights
The global Connectors for Food Production Market is poised for robust expansion, driven by evolving industry demands and technological advancements. The market size, estimated at $XX billion in the base year of 2025, is projected to reach $YY billion by 2033, exhibiting a Compound Annual Growth Rate (CAGR) of XX% during the forecast period (2025-2033). This growth trajectory is underpinned by the increasing automation of food processing and packaging lines, where reliable and hygienic connection solutions are paramount for operational efficiency and product safety. The adoption rates of advanced connectors, particularly M12 and M8 variants, are surging as manufacturers upgrade their equipment to meet stringent hygiene standards and enhance data transmission capabilities for real-time monitoring and control. Technological disruptions, such as the integration of smart sensors and IoT devices within food production environments, are creating new avenues for connector manufacturers. These advancements enable predictive maintenance, enhanced quality control, and improved traceability throughout the food supply chain. Consumer behavior shifts towards higher quality, safer, and more sustainably produced food products also indirectly influence the demand for sophisticated production equipment and, consequently, specialized connectors. The market penetration of high-performance connectors in applications requiring resistance to washdowns, extreme temperatures, and corrosive substances is continuously increasing, reflecting a growing awareness of their long-term cost benefits and operational reliability. During the historical period (2019-2024), the market witnessed a steady increase in demand, with an estimated CAGR of XX%, fueled by initial investments in automation and modernization across key food producing regions.
Dominant Regions, Countries, or Segments in Connectors For Food Production
Within the Connectors for Food Production Market, Food Processing Equipment stands out as the dominant application segment, consistently driving market growth. This segment is projected to capture an estimated XX% of the total market share by 2025. The demand within this segment is propelled by several key drivers, including substantial investments in upgrading aging infrastructure, the growing need for enhanced food safety compliance, and the relentless pursuit of operational efficiency through automation. Countries like the United States, Germany, and China are at the forefront of this dominance, owing to their large-scale food manufacturing industries and proactive adoption of advanced technologies. The economic policies in these regions often encourage investments in modernization and automation, further bolstering the demand for high-performance connectors. The Type: M12 Connectors segment also exhibits significant growth potential, accounting for an estimated XX% of the market in 2025. M12 connectors are increasingly favored for their robust design, superior sealing capabilities (IP67/IP69K), and resistance to harsh cleaning procedures common in food processing environments. Their versatility in handling both power and data signals makes them indispensable for modern, automated food production lines. For instance, the market share of M12 connectors in the food processing equipment application is expected to grow at a CAGR of XX% from 2025 to 2033. Infrastructure development, particularly in emerging economies looking to scale up their food production capabilities, also plays a crucial role in segment dominance. Furthermore, the increasing focus on smart manufacturing and IoT integration within food processing facilities necessitates reliable and robust connectivity solutions, further cementing the importance of M12 connectors and the broader Food Processing Equipment application.
Connectors For Food Production Product Landscape
The Connectors for Food Production Market is witnessing a surge in product innovations focused on enhanced hygiene, durability, and data integrity. Manufacturers are introducing advanced hygienic designs with smooth surfaces and minimal crevices to prevent microbial contamination, crucial for stringent food safety regulations. High-performance materials resistant to aggressive cleaning agents, extreme temperatures, and moisture ingress are becoming standard. Innovations in signal transmission, including high-speed data connectors and hybrid solutions combining power and data, are enabling greater automation and real-time monitoring on production lines. Unique selling propositions include connectors designed for tool-less assembly, quick disconnect capabilities, and integrated status indicators for improved operational efficiency. Technological advancements are also extending to miniaturization, allowing for more compact equipment designs without compromising performance.
Key Drivers, Barriers & Challenges in Connectors For Food Production
The Connectors for Food Production Market is propelled by several key drivers. Technological advancements in automation and Industry 4.0 integration are demanding more robust and intelligent connectivity solutions. Stringent food safety regulations worldwide mandate hygienic and reliable connector designs to prevent contamination and ensure compliance. Increasing global demand for processed and packaged foods necessitates higher production volumes, driving the need for efficient and durable equipment.
Conversely, the market faces significant barriers and challenges. The high cost of developing and certifying specialized, food-grade connectors can be a deterrent for smaller players. Supply chain disruptions, particularly for specialized materials and components, can lead to production delays and increased costs. Intense competition from manufacturers offering less specialized, lower-cost alternatives, though often inadequate for critical food applications, poses a pricing pressure. Regulatory hurdles and the need for continuous compliance with evolving food safety standards also represent a challenge.
Emerging Opportunities in Connectors For Food Production
Emerging opportunities in the Connectors for Food Production Market lie in the growing demand for wireless connectivity solutions tailored for food environments, offering enhanced flexibility and reduced cabling complexity. The expansion of the plant-based food sector and specialized processing techniques presents new application areas for connectors requiring specific chemical resistance and hygienic properties. Furthermore, the increasing adoption of predictive maintenance technologies, leveraging advanced sensors and data analytics, creates opportunities for smart connectors that can provide real-time performance data and diagnostic capabilities. Untapped markets in developing economies with growing food processing industries also represent significant growth potential.
Growth Accelerators in the Connectors For Food Production Industry
Catalysts driving long-term growth in the Connectors for Food Production Industry include breakthrough innovations in material science, leading to connectors with unprecedented resistance to extreme conditions and enhanced longevity. Strategic partnerships between connector manufacturers and automation solution providers are accelerating the integration of advanced connectivity into new equipment designs. Market expansion strategies, particularly focusing on emerging economies with rapidly developing food processing sectors, are key to capturing future growth. The continuous drive towards greater sustainability in food production will also favor connector solutions that are energy-efficient and have a reduced environmental impact throughout their lifecycle.
Key Players Shaping the Connectors For Food Production Market
- Harting
- Binder
- Belden
- Colder Products Company
- ESCHA
- Northern Connectors
- Fortop
- U.I. Lapp
- HUMMEL
- Lumberg Automation
- Pepperl+Fuchs
- Murrelektronik
Notable Milestones in Connectors For Food Production Sector
- 2019: Introduction of new M12 connector series with enhanced hygienic design and chemical resistance by [Company Name].
- 2020: Launch of integrated power and data connectors specifically for high-speed food packaging equipment by [Company Name].
- 2021: Acquisition of a specialized hygienic connector manufacturer by [Company Name] to expand its food industry portfolio.
- 2022: Development of advanced sealing technology for M8 connectors, offering superior IP69K protection for harsh washdown environments by [Company Name].
- 2023: Release of a new generation of modular connectors enabling flexible configurations for diverse food processing applications by [Company Name].
- 2024: Significant increase in strategic partnerships focused on IoT integration and smart manufacturing solutions in the food sector by leading connector providers.
In-Depth Connectors For Food Production Market Outlook
The Connectors for Food Production Market is set for sustained growth, fueled by the inexorable march of automation and digitalization in the global food industry. Future market potential lies in the seamless integration of connectivity solutions with advanced robotics, AI-driven quality control, and sophisticated traceability systems. Strategic opportunities abound for manufacturers who can offer not just reliable connectors but also intelligent, data-rich solutions that contribute to enhanced operational efficiency, food safety, and sustainability. The increasing demand for customized and application-specific connector designs, particularly for novel food processing technologies, will be a key differentiator.
Connectors For Food Production Segmentation
-
1. Application
- 1.1. Food Processing Equipment
- 1.2. Food Packaging Equipment
- 1.3. Food Transportation Equipment
- 1.4. Others
-
2. Type
- 2.1. M12 Connectors
- 2.2. M8 Connectors
- 2.3. Others
Connectors For Food Production Segmentation By Geography
-
1. North America
- 1.1. United States
- 1.2. Canada
- 1.3. Mexico
-
2. South America
- 2.1. Brazil
- 2.2. Argentina
- 2.3. Rest of South America
-
3. Europe
- 3.1. United Kingdom
- 3.2. Germany
- 3.3. France
- 3.4. Italy
- 3.5. Spain
- 3.6. Russia
- 3.7. Benelux
- 3.8. Nordics
- 3.9. Rest of Europe
-
4. Middle East & Africa
- 4.1. Turkey
- 4.2. Israel
- 4.3. GCC
- 4.4. North Africa
- 4.5. South Africa
- 4.6. Rest of Middle East & Africa
-
5. Asia Pacific
- 5.1. China
- 5.2. India
- 5.3. Japan
- 5.4. South Korea
- 5.5. ASEAN
- 5.6. Oceania
- 5.7. Rest of Asia Pacific
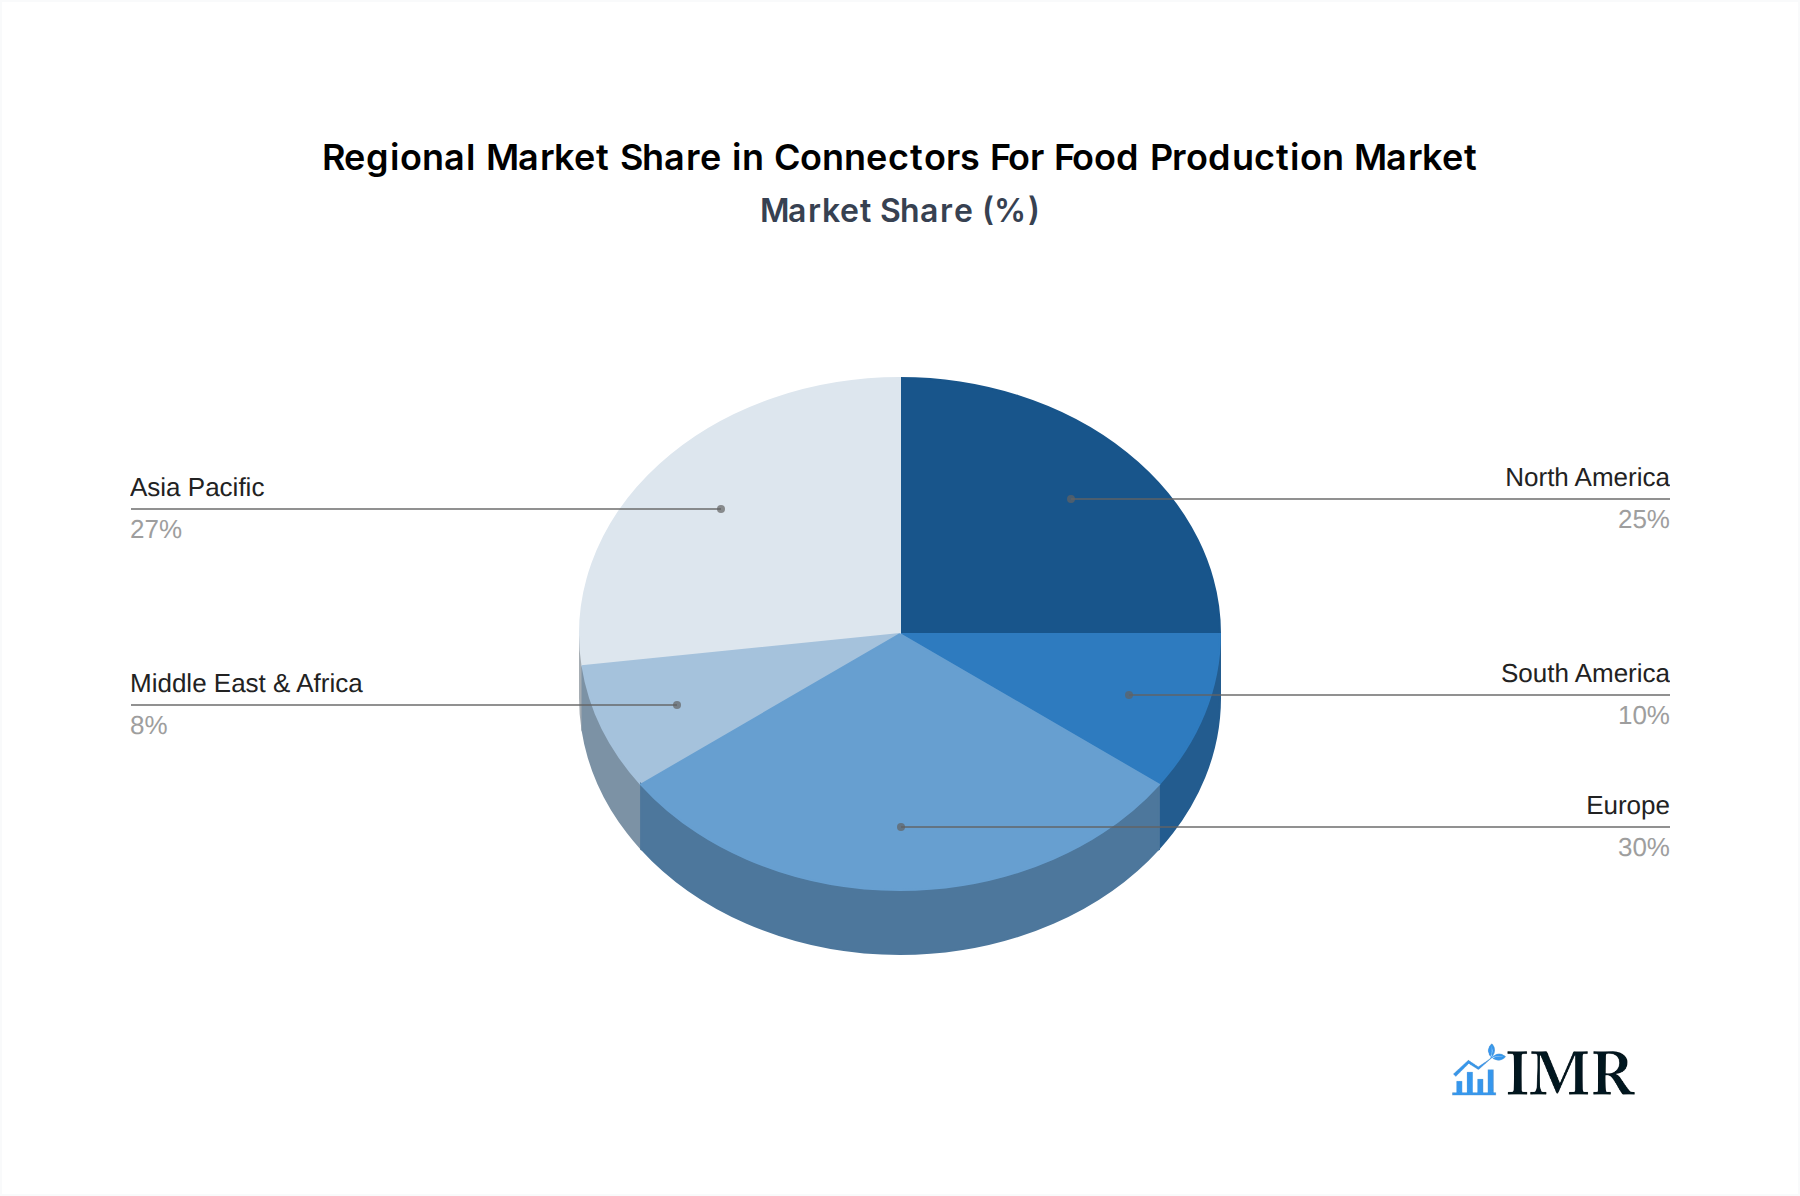
Connectors For Food Production Regional Market Share
Geographic Coverage of Connectors For Food Production
Connectors For Food Production REPORT HIGHLIGHTS
| Aspects | Details |
|---|---|
| Study Period | 2020-2034 |
| Base Year | 2025 |
| Estimated Year | 2026 |
| Forecast Period | 2026-2034 |
| Historical Period | 2020-2025 |
| Growth Rate | CAGR of 6.85% from 2020-2034 |
| Segmentation |
|
Table of Contents
- 1. Introduction
- 1.1. Research Scope
- 1.2. Market Segmentation
- 1.3. Research Objective
- 1.4. Definitions and Assumptions
- 2. Executive Summary
- 2.1. Market Snapshot
- 3. Market Dynamics
- 3.1. Market Drivers
- 3.2. Market Restrains
- 3.3. Market Trends
- 3.4. Market Opportunities
- 4. Market Factor Analysis
- 4.1. Porters Five Forces
- 4.1.1. Bargaining Power of Suppliers
- 4.1.2. Bargaining Power of Buyers
- 4.1.3. Threat of New Entrants
- 4.1.4. Threat of Substitutes
- 4.1.5. Competitive Rivalry
- 4.2. PESTEL analysis
- 4.3. BCG Analysis
- 4.3.1. Stars (High Growth, High Market Share)
- 4.3.2. Cash Cows (Low Growth, High Market Share)
- 4.3.3. Question Mark (High Growth, Low Market Share)
- 4.3.4. Dogs (Low Growth, Low Market Share)
- 4.4. Ansoff Matrix Analysis
- 4.5. Supply Chain Analysis
- 4.6. Regulatory Landscape
- 4.7. Current Market Potential and Opportunity Assessment (TAM–SAM–SOM Framework)
- 4.8. IMR Analyst Note
- 4.1. Porters Five Forces
- 5. Market Analysis, Insights and Forecast 2021-2033
- 5.1. Market Analysis, Insights and Forecast - by Application
- 5.1.1. Food Processing Equipment
- 5.1.2. Food Packaging Equipment
- 5.1.3. Food Transportation Equipment
- 5.1.4. Others
- 5.2. Market Analysis, Insights and Forecast - by Type
- 5.2.1. M12 Connectors
- 5.2.2. M8 Connectors
- 5.2.3. Others
- 5.3. Market Analysis, Insights and Forecast - by Region
- 5.3.1. North America
- 5.3.2. South America
- 5.3.3. Europe
- 5.3.4. Middle East & Africa
- 5.3.5. Asia Pacific
- 5.1. Market Analysis, Insights and Forecast - by Application
- 6. Global Connectors For Food Production Analysis, Insights and Forecast, 2021-2033
- 6.1. Market Analysis, Insights and Forecast - by Application
- 6.1.1. Food Processing Equipment
- 6.1.2. Food Packaging Equipment
- 6.1.3. Food Transportation Equipment
- 6.1.4. Others
- 6.2. Market Analysis, Insights and Forecast - by Type
- 6.2.1. M12 Connectors
- 6.2.2. M8 Connectors
- 6.2.3. Others
- 6.1. Market Analysis, Insights and Forecast - by Application
- 7. North America Connectors For Food Production Analysis, Insights and Forecast, 2020-2032
- 7.1. Market Analysis, Insights and Forecast - by Application
- 7.1.1. Food Processing Equipment
- 7.1.2. Food Packaging Equipment
- 7.1.3. Food Transportation Equipment
- 7.1.4. Others
- 7.2. Market Analysis, Insights and Forecast - by Type
- 7.2.1. M12 Connectors
- 7.2.2. M8 Connectors
- 7.2.3. Others
- 7.1. Market Analysis, Insights and Forecast - by Application
- 8. South America Connectors For Food Production Analysis, Insights and Forecast, 2020-2032
- 8.1. Market Analysis, Insights and Forecast - by Application
- 8.1.1. Food Processing Equipment
- 8.1.2. Food Packaging Equipment
- 8.1.3. Food Transportation Equipment
- 8.1.4. Others
- 8.2. Market Analysis, Insights and Forecast - by Type
- 8.2.1. M12 Connectors
- 8.2.2. M8 Connectors
- 8.2.3. Others
- 8.1. Market Analysis, Insights and Forecast - by Application
- 9. Europe Connectors For Food Production Analysis, Insights and Forecast, 2020-2032
- 9.1. Market Analysis, Insights and Forecast - by Application
- 9.1.1. Food Processing Equipment
- 9.1.2. Food Packaging Equipment
- 9.1.3. Food Transportation Equipment
- 9.1.4. Others
- 9.2. Market Analysis, Insights and Forecast - by Type
- 9.2.1. M12 Connectors
- 9.2.2. M8 Connectors
- 9.2.3. Others
- 9.1. Market Analysis, Insights and Forecast - by Application
- 10. Middle East & Africa Connectors For Food Production Analysis, Insights and Forecast, 2020-2032
- 10.1. Market Analysis, Insights and Forecast - by Application
- 10.1.1. Food Processing Equipment
- 10.1.2. Food Packaging Equipment
- 10.1.3. Food Transportation Equipment
- 10.1.4. Others
- 10.2. Market Analysis, Insights and Forecast - by Type
- 10.2.1. M12 Connectors
- 10.2.2. M8 Connectors
- 10.2.3. Others
- 10.1. Market Analysis, Insights and Forecast - by Application
- 11. Asia Pacific Connectors For Food Production Analysis, Insights and Forecast, 2020-2032
- 11.1. Market Analysis, Insights and Forecast - by Application
- 11.1.1. Food Processing Equipment
- 11.1.2. Food Packaging Equipment
- 11.1.3. Food Transportation Equipment
- 11.1.4. Others
- 11.2. Market Analysis, Insights and Forecast - by Type
- 11.2.1. M12 Connectors
- 11.2.2. M8 Connectors
- 11.2.3. Others
- 11.1. Market Analysis, Insights and Forecast - by Application
- 12. Competitive Analysis
- 12.1. Company Profiles
- 12.1.1 Harting
- 12.1.1.1. Company Overview
- 12.1.1.2. Products
- 12.1.1.3. Company Financials
- 12.1.1.4. SWOT Analysis
- 12.1.2 Binder
- 12.1.2.1. Company Overview
- 12.1.2.2. Products
- 12.1.2.3. Company Financials
- 12.1.2.4. SWOT Analysis
- 12.1.3 Belden
- 12.1.3.1. Company Overview
- 12.1.3.2. Products
- 12.1.3.3. Company Financials
- 12.1.3.4. SWOT Analysis
- 12.1.4 Colder Products Company
- 12.1.4.1. Company Overview
- 12.1.4.2. Products
- 12.1.4.3. Company Financials
- 12.1.4.4. SWOT Analysis
- 12.1.5 ESCHA
- 12.1.5.1. Company Overview
- 12.1.5.2. Products
- 12.1.5.3. Company Financials
- 12.1.5.4. SWOT Analysis
- 12.1.6 Northern Connectors
- 12.1.6.1. Company Overview
- 12.1.6.2. Products
- 12.1.6.3. Company Financials
- 12.1.6.4. SWOT Analysis
- 12.1.7 Fortop
- 12.1.7.1. Company Overview
- 12.1.7.2. Products
- 12.1.7.3. Company Financials
- 12.1.7.4. SWOT Analysis
- 12.1.8 U.I. Lapp
- 12.1.8.1. Company Overview
- 12.1.8.2. Products
- 12.1.8.3. Company Financials
- 12.1.8.4. SWOT Analysis
- 12.1.9 HUMMEL
- 12.1.9.1. Company Overview
- 12.1.9.2. Products
- 12.1.9.3. Company Financials
- 12.1.9.4. SWOT Analysis
- 12.1.10 Lumberg Automation
- 12.1.10.1. Company Overview
- 12.1.10.2. Products
- 12.1.10.3. Company Financials
- 12.1.10.4. SWOT Analysis
- 12.1.11 Pepperl+Fuchs
- 12.1.11.1. Company Overview
- 12.1.11.2. Products
- 12.1.11.3. Company Financials
- 12.1.11.4. SWOT Analysis
- 12.1.12 Murrelektronik
- 12.1.12.1. Company Overview
- 12.1.12.2. Products
- 12.1.12.3. Company Financials
- 12.1.12.4. SWOT Analysis
- 12.1.1 Harting
- 12.2. Market Entropy
- 12.2.1 Company's Key Areas Served
- 12.2.2 Recent Developments
- 12.3. Company Market Share Analysis 2025
- 12.3.1 Top 5 Companies Market Share Analysis
- 12.3.2 Top 3 Companies Market Share Analysis
- 12.4. List of Potential Customers
- 13. Research Methodology
List of Figures
- Figure 1: Global Connectors For Food Production Revenue Breakdown (undefined, %) by Region 2025 & 2033
- Figure 2: Global Connectors For Food Production Volume Breakdown (K, %) by Region 2025 & 2033
- Figure 3: North America Connectors For Food Production Revenue (undefined), by Application 2025 & 2033
- Figure 4: North America Connectors For Food Production Volume (K), by Application 2025 & 2033
- Figure 5: North America Connectors For Food Production Revenue Share (%), by Application 2025 & 2033
- Figure 6: North America Connectors For Food Production Volume Share (%), by Application 2025 & 2033
- Figure 7: North America Connectors For Food Production Revenue (undefined), by Type 2025 & 2033
- Figure 8: North America Connectors For Food Production Volume (K), by Type 2025 & 2033
- Figure 9: North America Connectors For Food Production Revenue Share (%), by Type 2025 & 2033
- Figure 10: North America Connectors For Food Production Volume Share (%), by Type 2025 & 2033
- Figure 11: North America Connectors For Food Production Revenue (undefined), by Country 2025 & 2033
- Figure 12: North America Connectors For Food Production Volume (K), by Country 2025 & 2033
- Figure 13: North America Connectors For Food Production Revenue Share (%), by Country 2025 & 2033
- Figure 14: North America Connectors For Food Production Volume Share (%), by Country 2025 & 2033
- Figure 15: South America Connectors For Food Production Revenue (undefined), by Application 2025 & 2033
- Figure 16: South America Connectors For Food Production Volume (K), by Application 2025 & 2033
- Figure 17: South America Connectors For Food Production Revenue Share (%), by Application 2025 & 2033
- Figure 18: South America Connectors For Food Production Volume Share (%), by Application 2025 & 2033
- Figure 19: South America Connectors For Food Production Revenue (undefined), by Type 2025 & 2033
- Figure 20: South America Connectors For Food Production Volume (K), by Type 2025 & 2033
- Figure 21: South America Connectors For Food Production Revenue Share (%), by Type 2025 & 2033
- Figure 22: South America Connectors For Food Production Volume Share (%), by Type 2025 & 2033
- Figure 23: South America Connectors For Food Production Revenue (undefined), by Country 2025 & 2033
- Figure 24: South America Connectors For Food Production Volume (K), by Country 2025 & 2033
- Figure 25: South America Connectors For Food Production Revenue Share (%), by Country 2025 & 2033
- Figure 26: South America Connectors For Food Production Volume Share (%), by Country 2025 & 2033
- Figure 27: Europe Connectors For Food Production Revenue (undefined), by Application 2025 & 2033
- Figure 28: Europe Connectors For Food Production Volume (K), by Application 2025 & 2033
- Figure 29: Europe Connectors For Food Production Revenue Share (%), by Application 2025 & 2033
- Figure 30: Europe Connectors For Food Production Volume Share (%), by Application 2025 & 2033
- Figure 31: Europe Connectors For Food Production Revenue (undefined), by Type 2025 & 2033
- Figure 32: Europe Connectors For Food Production Volume (K), by Type 2025 & 2033
- Figure 33: Europe Connectors For Food Production Revenue Share (%), by Type 2025 & 2033
- Figure 34: Europe Connectors For Food Production Volume Share (%), by Type 2025 & 2033
- Figure 35: Europe Connectors For Food Production Revenue (undefined), by Country 2025 & 2033
- Figure 36: Europe Connectors For Food Production Volume (K), by Country 2025 & 2033
- Figure 37: Europe Connectors For Food Production Revenue Share (%), by Country 2025 & 2033
- Figure 38: Europe Connectors For Food Production Volume Share (%), by Country 2025 & 2033
- Figure 39: Middle East & Africa Connectors For Food Production Revenue (undefined), by Application 2025 & 2033
- Figure 40: Middle East & Africa Connectors For Food Production Volume (K), by Application 2025 & 2033
- Figure 41: Middle East & Africa Connectors For Food Production Revenue Share (%), by Application 2025 & 2033
- Figure 42: Middle East & Africa Connectors For Food Production Volume Share (%), by Application 2025 & 2033
- Figure 43: Middle East & Africa Connectors For Food Production Revenue (undefined), by Type 2025 & 2033
- Figure 44: Middle East & Africa Connectors For Food Production Volume (K), by Type 2025 & 2033
- Figure 45: Middle East & Africa Connectors For Food Production Revenue Share (%), by Type 2025 & 2033
- Figure 46: Middle East & Africa Connectors For Food Production Volume Share (%), by Type 2025 & 2033
- Figure 47: Middle East & Africa Connectors For Food Production Revenue (undefined), by Country 2025 & 2033
- Figure 48: Middle East & Africa Connectors For Food Production Volume (K), by Country 2025 & 2033
- Figure 49: Middle East & Africa Connectors For Food Production Revenue Share (%), by Country 2025 & 2033
- Figure 50: Middle East & Africa Connectors For Food Production Volume Share (%), by Country 2025 & 2033
- Figure 51: Asia Pacific Connectors For Food Production Revenue (undefined), by Application 2025 & 2033
- Figure 52: Asia Pacific Connectors For Food Production Volume (K), by Application 2025 & 2033
- Figure 53: Asia Pacific Connectors For Food Production Revenue Share (%), by Application 2025 & 2033
- Figure 54: Asia Pacific Connectors For Food Production Volume Share (%), by Application 2025 & 2033
- Figure 55: Asia Pacific Connectors For Food Production Revenue (undefined), by Type 2025 & 2033
- Figure 56: Asia Pacific Connectors For Food Production Volume (K), by Type 2025 & 2033
- Figure 57: Asia Pacific Connectors For Food Production Revenue Share (%), by Type 2025 & 2033
- Figure 58: Asia Pacific Connectors For Food Production Volume Share (%), by Type 2025 & 2033
- Figure 59: Asia Pacific Connectors For Food Production Revenue (undefined), by Country 2025 & 2033
- Figure 60: Asia Pacific Connectors For Food Production Volume (K), by Country 2025 & 2033
- Figure 61: Asia Pacific Connectors For Food Production Revenue Share (%), by Country 2025 & 2033
- Figure 62: Asia Pacific Connectors For Food Production Volume Share (%), by Country 2025 & 2033
List of Tables
- Table 1: Global Connectors For Food Production Revenue undefined Forecast, by Application 2020 & 2033
- Table 2: Global Connectors For Food Production Volume K Forecast, by Application 2020 & 2033
- Table 3: Global Connectors For Food Production Revenue undefined Forecast, by Type 2020 & 2033
- Table 4: Global Connectors For Food Production Volume K Forecast, by Type 2020 & 2033
- Table 5: Global Connectors For Food Production Revenue undefined Forecast, by Region 2020 & 2033
- Table 6: Global Connectors For Food Production Volume K Forecast, by Region 2020 & 2033
- Table 7: Global Connectors For Food Production Revenue undefined Forecast, by Application 2020 & 2033
- Table 8: Global Connectors For Food Production Volume K Forecast, by Application 2020 & 2033
- Table 9: Global Connectors For Food Production Revenue undefined Forecast, by Type 2020 & 2033
- Table 10: Global Connectors For Food Production Volume K Forecast, by Type 2020 & 2033
- Table 11: Global Connectors For Food Production Revenue undefined Forecast, by Country 2020 & 2033
- Table 12: Global Connectors For Food Production Volume K Forecast, by Country 2020 & 2033
- Table 13: United States Connectors For Food Production Revenue (undefined) Forecast, by Application 2020 & 2033
- Table 14: United States Connectors For Food Production Volume (K) Forecast, by Application 2020 & 2033
- Table 15: Canada Connectors For Food Production Revenue (undefined) Forecast, by Application 2020 & 2033
- Table 16: Canada Connectors For Food Production Volume (K) Forecast, by Application 2020 & 2033
- Table 17: Mexico Connectors For Food Production Revenue (undefined) Forecast, by Application 2020 & 2033
- Table 18: Mexico Connectors For Food Production Volume (K) Forecast, by Application 2020 & 2033
- Table 19: Global Connectors For Food Production Revenue undefined Forecast, by Application 2020 & 2033
- Table 20: Global Connectors For Food Production Volume K Forecast, by Application 2020 & 2033
- Table 21: Global Connectors For Food Production Revenue undefined Forecast, by Type 2020 & 2033
- Table 22: Global Connectors For Food Production Volume K Forecast, by Type 2020 & 2033
- Table 23: Global Connectors For Food Production Revenue undefined Forecast, by Country 2020 & 2033
- Table 24: Global Connectors For Food Production Volume K Forecast, by Country 2020 & 2033
- Table 25: Brazil Connectors For Food Production Revenue (undefined) Forecast, by Application 2020 & 2033
- Table 26: Brazil Connectors For Food Production Volume (K) Forecast, by Application 2020 & 2033
- Table 27: Argentina Connectors For Food Production Revenue (undefined) Forecast, by Application 2020 & 2033
- Table 28: Argentina Connectors For Food Production Volume (K) Forecast, by Application 2020 & 2033
- Table 29: Rest of South America Connectors For Food Production Revenue (undefined) Forecast, by Application 2020 & 2033
- Table 30: Rest of South America Connectors For Food Production Volume (K) Forecast, by Application 2020 & 2033
- Table 31: Global Connectors For Food Production Revenue undefined Forecast, by Application 2020 & 2033
- Table 32: Global Connectors For Food Production Volume K Forecast, by Application 2020 & 2033
- Table 33: Global Connectors For Food Production Revenue undefined Forecast, by Type 2020 & 2033
- Table 34: Global Connectors For Food Production Volume K Forecast, by Type 2020 & 2033
- Table 35: Global Connectors For Food Production Revenue undefined Forecast, by Country 2020 & 2033
- Table 36: Global Connectors For Food Production Volume K Forecast, by Country 2020 & 2033
- Table 37: United Kingdom Connectors For Food Production Revenue (undefined) Forecast, by Application 2020 & 2033
- Table 38: United Kingdom Connectors For Food Production Volume (K) Forecast, by Application 2020 & 2033
- Table 39: Germany Connectors For Food Production Revenue (undefined) Forecast, by Application 2020 & 2033
- Table 40: Germany Connectors For Food Production Volume (K) Forecast, by Application 2020 & 2033
- Table 41: France Connectors For Food Production Revenue (undefined) Forecast, by Application 2020 & 2033
- Table 42: France Connectors For Food Production Volume (K) Forecast, by Application 2020 & 2033
- Table 43: Italy Connectors For Food Production Revenue (undefined) Forecast, by Application 2020 & 2033
- Table 44: Italy Connectors For Food Production Volume (K) Forecast, by Application 2020 & 2033
- Table 45: Spain Connectors For Food Production Revenue (undefined) Forecast, by Application 2020 & 2033
- Table 46: Spain Connectors For Food Production Volume (K) Forecast, by Application 2020 & 2033
- Table 47: Russia Connectors For Food Production Revenue (undefined) Forecast, by Application 2020 & 2033
- Table 48: Russia Connectors For Food Production Volume (K) Forecast, by Application 2020 & 2033
- Table 49: Benelux Connectors For Food Production Revenue (undefined) Forecast, by Application 2020 & 2033
- Table 50: Benelux Connectors For Food Production Volume (K) Forecast, by Application 2020 & 2033
- Table 51: Nordics Connectors For Food Production Revenue (undefined) Forecast, by Application 2020 & 2033
- Table 52: Nordics Connectors For Food Production Volume (K) Forecast, by Application 2020 & 2033
- Table 53: Rest of Europe Connectors For Food Production Revenue (undefined) Forecast, by Application 2020 & 2033
- Table 54: Rest of Europe Connectors For Food Production Volume (K) Forecast, by Application 2020 & 2033
- Table 55: Global Connectors For Food Production Revenue undefined Forecast, by Application 2020 & 2033
- Table 56: Global Connectors For Food Production Volume K Forecast, by Application 2020 & 2033
- Table 57: Global Connectors For Food Production Revenue undefined Forecast, by Type 2020 & 2033
- Table 58: Global Connectors For Food Production Volume K Forecast, by Type 2020 & 2033
- Table 59: Global Connectors For Food Production Revenue undefined Forecast, by Country 2020 & 2033
- Table 60: Global Connectors For Food Production Volume K Forecast, by Country 2020 & 2033
- Table 61: Turkey Connectors For Food Production Revenue (undefined) Forecast, by Application 2020 & 2033
- Table 62: Turkey Connectors For Food Production Volume (K) Forecast, by Application 2020 & 2033
- Table 63: Israel Connectors For Food Production Revenue (undefined) Forecast, by Application 2020 & 2033
- Table 64: Israel Connectors For Food Production Volume (K) Forecast, by Application 2020 & 2033
- Table 65: GCC Connectors For Food Production Revenue (undefined) Forecast, by Application 2020 & 2033
- Table 66: GCC Connectors For Food Production Volume (K) Forecast, by Application 2020 & 2033
- Table 67: North Africa Connectors For Food Production Revenue (undefined) Forecast, by Application 2020 & 2033
- Table 68: North Africa Connectors For Food Production Volume (K) Forecast, by Application 2020 & 2033
- Table 69: South Africa Connectors For Food Production Revenue (undefined) Forecast, by Application 2020 & 2033
- Table 70: South Africa Connectors For Food Production Volume (K) Forecast, by Application 2020 & 2033
- Table 71: Rest of Middle East & Africa Connectors For Food Production Revenue (undefined) Forecast, by Application 2020 & 2033
- Table 72: Rest of Middle East & Africa Connectors For Food Production Volume (K) Forecast, by Application 2020 & 2033
- Table 73: Global Connectors For Food Production Revenue undefined Forecast, by Application 2020 & 2033
- Table 74: Global Connectors For Food Production Volume K Forecast, by Application 2020 & 2033
- Table 75: Global Connectors For Food Production Revenue undefined Forecast, by Type 2020 & 2033
- Table 76: Global Connectors For Food Production Volume K Forecast, by Type 2020 & 2033
- Table 77: Global Connectors For Food Production Revenue undefined Forecast, by Country 2020 & 2033
- Table 78: Global Connectors For Food Production Volume K Forecast, by Country 2020 & 2033
- Table 79: China Connectors For Food Production Revenue (undefined) Forecast, by Application 2020 & 2033
- Table 80: China Connectors For Food Production Volume (K) Forecast, by Application 2020 & 2033
- Table 81: India Connectors For Food Production Revenue (undefined) Forecast, by Application 2020 & 2033
- Table 82: India Connectors For Food Production Volume (K) Forecast, by Application 2020 & 2033
- Table 83: Japan Connectors For Food Production Revenue (undefined) Forecast, by Application 2020 & 2033
- Table 84: Japan Connectors For Food Production Volume (K) Forecast, by Application 2020 & 2033
- Table 85: South Korea Connectors For Food Production Revenue (undefined) Forecast, by Application 2020 & 2033
- Table 86: South Korea Connectors For Food Production Volume (K) Forecast, by Application 2020 & 2033
- Table 87: ASEAN Connectors For Food Production Revenue (undefined) Forecast, by Application 2020 & 2033
- Table 88: ASEAN Connectors For Food Production Volume (K) Forecast, by Application 2020 & 2033
- Table 89: Oceania Connectors For Food Production Revenue (undefined) Forecast, by Application 2020 & 2033
- Table 90: Oceania Connectors For Food Production Volume (K) Forecast, by Application 2020 & 2033
- Table 91: Rest of Asia Pacific Connectors For Food Production Revenue (undefined) Forecast, by Application 2020 & 2033
- Table 92: Rest of Asia Pacific Connectors For Food Production Volume (K) Forecast, by Application 2020 & 2033
Frequently Asked Questions
1. What is the projected Compound Annual Growth Rate (CAGR) of the Connectors For Food Production?
The projected CAGR is approximately 6.85%.
2. Which companies are prominent players in the Connectors For Food Production?
Key companies in the market include Harting, Binder, Belden, Colder Products Company, ESCHA, Northern Connectors, Fortop, U.I. Lapp, HUMMEL, Lumberg Automation, Pepperl+Fuchs, Murrelektronik.
3. What are the main segments of the Connectors For Food Production?
The market segments include Application, Type.
4. Can you provide details about the market size?
The market size is estimated to be USD XXX N/A as of 2022.
5. What are some drivers contributing to market growth?
N/A
6. What are the notable trends driving market growth?
N/A
7. Are there any restraints impacting market growth?
N/A
8. Can you provide examples of recent developments in the market?
N/A
9. What pricing options are available for accessing the report?
Pricing options include single-user, multi-user, and enterprise licenses priced at USD 3950.00, USD 5925.00, and USD 7900.00 respectively.
10. Is the market size provided in terms of value or volume?
The market size is provided in terms of value, measured in N/A and volume, measured in K.
11. Are there any specific market keywords associated with the report?
Yes, the market keyword associated with the report is "Connectors For Food Production," which aids in identifying and referencing the specific market segment covered.
12. How do I determine which pricing option suits my needs best?
The pricing options vary based on user requirements and access needs. Individual users may opt for single-user licenses, while businesses requiring broader access may choose multi-user or enterprise licenses for cost-effective access to the report.
13. Are there any additional resources or data provided in the Connectors For Food Production report?
While the report offers comprehensive insights, it's advisable to review the specific contents or supplementary materials provided to ascertain if additional resources or data are available.
14. How can I stay updated on further developments or reports in the Connectors For Food Production?
To stay informed about further developments, trends, and reports in the Connectors For Food Production, consider subscribing to industry newsletters, following relevant companies and organizations, or regularly checking reputable industry news sources and publications.
Methodology
Step 1 - Identification of Relevant Samples Size from Population Database


Step 2 - Approaches for Defining Global Market Size (Value, Volume* & Price*)

Note*: In applicable scenarios
Step 3 - Data Sources
Primary Research
- Web Analytics
- Survey Reports
- Research Institute
- Latest Research Reports
- Opinion Leaders
Secondary Research
- Annual Reports
- White Paper
- Latest Press Release
- Industry Association
- Paid Database
- Investor Presentations

Step 4 - Data Triangulation
Involves using different sources of information in order to increase the validity of a study
These sources are likely to be stakeholders in a program - participants, other researchers, program staff, other community members, and so on.
Then we put all data in single framework & apply various statistical tools to find out the dynamic on the market.
During the analysis stage, feedback from the stakeholder groups would be compared to determine areas of agreement as well as areas of divergence