

Key Insights
The Data Center and Cloud Computing Switches market is projected to reach a significant valuation of $17.78 billion in 2025, demonstrating robust growth with a Compound Annual Growth Rate (CAGR) of 4.2% expected to sustain through 2033. This expansion is primarily fueled by the escalating demand for robust network infrastructure to support the burgeoning data center and cloud computing sectors. The increasing adoption of high-speed networking technologies, driven by the proliferation of big data analytics, the Internet of Things (IoT), and the continuous evolution of cloud-based services, is a key catalyst for this market's upward trajectory. Furthermore, the need for enhanced network agility, scalability, and efficiency in modern data centers, including hyperscale facilities, is compelling organizations to invest in advanced switching solutions. The market will witness sustained investment in technologies that facilitate lower latency, higher bandwidth, and improved power efficiency, essential for the performance demands of cloud environments.
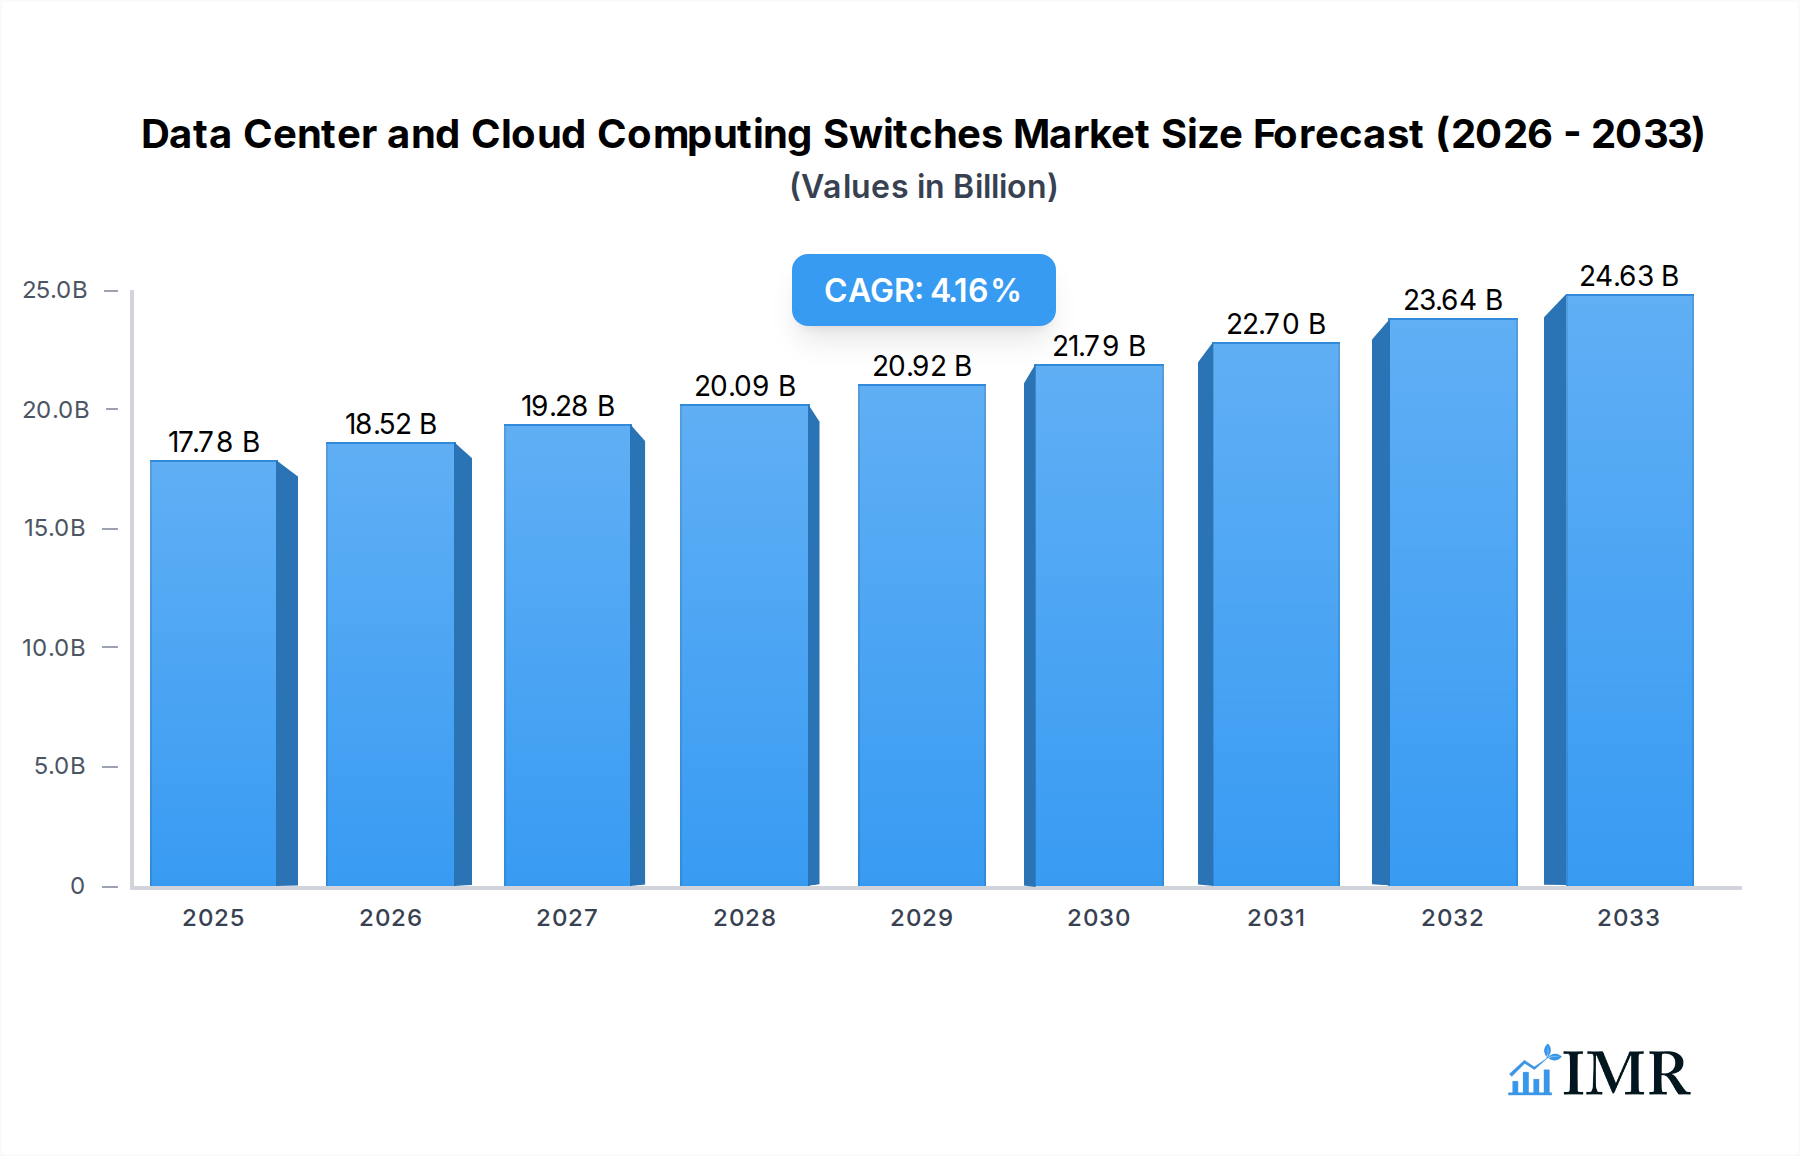
Data Center and Cloud Computing Switches Market Size (In Billion)
The market is segmented by application into Data Center, Metropolitan Area Network, and Others, with Data Centers forming the dominant segment due to the intensive networking requirements of these facilities. By type, Modular Switches and Fixed Switches cater to diverse deployment needs, offering flexibility and scalability. Leading companies like Cisco, Huawei, Juniper, HPE, and Dell are at the forefront of innovation, introducing advanced switching architectures and software-defined networking (SDN) capabilities. These advancements are crucial for managing complex network topologies and optimizing traffic flow in dynamic cloud environments. While growth is strong, potential restraints such as the high initial cost of advanced switching hardware and the complexity of integration with existing infrastructure may pose challenges. However, the ongoing digital transformation and the relentless growth in data generation and processing are expected to outweigh these challenges, ensuring a positive outlook for the Data Center and Cloud Computing Switches market.

Data Center and Cloud Computing Switches Company Market Share
Data Center and Cloud Computing Switches Market Report Description
This comprehensive report provides an in-depth analysis of the Data Center and Cloud Computing Switches market, offering critical insights into its dynamics, growth trends, and future trajectory. Spanning the historical period of 2019–2024, with a base year of 2025 and a robust forecast period extending to 2033, this study is an indispensable resource for industry stakeholders seeking to navigate this rapidly evolving landscape. We meticulously examine the interplay between parent and child markets, providing a holistic view of this essential infrastructure segment.
The global Data Center and Cloud Computing Switches market is projected to reach USD 55.7 billion by 2025, driven by escalating demand for high-speed networking, the proliferation of cloud services, and the exponential growth of data. Key players like Cisco, Huawei, Juniper, HPE, Dell, NETGEAR, Datto, Extreme Networks, Arista Networks, Allied Telesis, H3C (Unisplendour), Broadcom, Alcatel-Lucent, D-Link, TP-Link, Ruijie Networks, and Fortinet, Inc. are actively shaping the market through continuous innovation and strategic expansions. The report delves into the Segments including Data Center, Metropolitan Area Network, and Others, as well as Types such as Modular Switches and Fixed Switches, providing granular analysis for each.
Data Center and Cloud Computing Switches Market Dynamics & Structure
The Data Center and Cloud Computing Switches market is characterized by a moderately consolidated structure, with leading vendors like Cisco and Arista Networks holding significant market share. Technological innovation is the primary driver, fueled by the relentless pursuit of higher bandwidth, lower latency, and enhanced energy efficiency to support the ever-increasing demands of cloud computing and big data analytics. Emerging technologies such as AI-driven network management, SDN (Software-Defined Networking), and NFV (Network Functions Virtualization) are transforming network architectures. Regulatory frameworks, while generally supportive of infrastructure development, can introduce compliance complexities, particularly concerning data security and privacy standards. Competitive product substitutes are emerging, primarily in the form of integrated solutions and white-box switches offering cost advantages, but brand reputation and advanced feature sets continue to differentiate established players. End-user demographics are shifting towards hyperscale cloud providers, large enterprises migrating to hybrid cloud environments, and telecommunication companies expanding their network capacities. Mergers and Acquisitions (M&A) trends are active, with companies strategically acquiring smaller players to gain access to specialized technologies or expand their geographical reach.
- Market Concentration: Dominated by a few key players, with a growing presence of specialized vendors.
- Technological Innovation Drivers: Demand for 400GbE and 800GbE connectivity, AI/ML for network automation, edge computing infrastructure.
- Regulatory Frameworks: Data privacy regulations (e.g., GDPR, CCPA), network security mandates.
- Competitive Product Substitutes: Open networking solutions, integrated cloud platform networking.
- End-User Demographics: Hyperscale data centers, enterprise cloud deployments, telecommunications providers.
- M&A Trends: Strategic acquisitions for technology integration and market consolidation.
Data Center and Cloud Computing Switches Growth Trends & Insights
The global Data Center and Cloud Computing Switches market is experiencing robust growth, projected to expand from an estimated USD 50.2 billion in 2024 to a remarkable USD 75.3 billion by 2033, exhibiting a Compound Annual Growth Rate (CAGR) of approximately 4.8% during the forecast period. This expansion is predominantly fueled by the insatiable demand for high-speed, low-latency network connectivity essential for modern digital infrastructure. The continuous evolution of cloud computing services, including hybrid and multi-cloud strategies, necessitates significant investments in advanced networking hardware that can seamlessly manage and transfer vast amounts of data. Adoption rates for higher-speed Ethernet technologies, such as 400 Gigabit Ethernet (GbE) and the emerging 800 GbE, are rapidly increasing as data centers strive to enhance their performance and scalability. Technological disruptions, including the widespread implementation of Software-Defined Networking (SDN) and Network Functions Virtualization (NFV), are fundamentally reshaping network architectures, enabling greater flexibility, automation, and cost-efficiency, thereby driving the adoption of intelligent and programmable switches.
Consumer behavior shifts are also playing a pivotal role. Businesses are increasingly relying on cloud-based applications and services, leading to an exponential growth in data traffic within data centers and between them and end-users. This surge in data necessitates switches capable of handling higher port densities and throughput. Furthermore, the growing adoption of edge computing, artificial intelligence (AI), machine learning (ML), and the Internet of Things (IoT) are creating new demands for localized, high-performance networking solutions, further accelerating the market's upward trajectory. The increasing trend towards hyper-converged infrastructure (HCI) also contributes to the demand for integrated networking solutions that are tightly coupled with compute and storage. Market penetration of advanced switch technologies is deepening as organizations recognize the long-term benefits of investing in future-proof network infrastructure. The proactive adoption of next-generation networking solutions by hyperscale cloud providers and large enterprises serves as a significant indicator of the market's sustained growth potential. The increasing complexity of network management in large-scale deployments is also pushing the demand for intelligent switches with advanced monitoring and analytics capabilities.
Dominant Regions, Countries, or Segments in Data Center and Cloud Computing Switches
The Data Center segment, within the Application category, is undeniably the dominant force driving the global Data Center and Cloud Computing Switches market. This dominance is intrinsically linked to the massive investments being made in building and expanding hyperscale data centers, enterprise private clouds, and colocation facilities worldwide. These facilities are the backbone of the digital economy, housing the critical infrastructure for cloud services, big data processing, AI/ML workloads, and a myriad of online applications. The sheer volume of data generated and processed within data centers necessitates a constant upgrade cycle of high-performance networking switches, particularly those supporting multi-gigabit and terabit speeds.
Within the Types of switches, Modular Switches are experiencing significant growth due to their scalability, flexibility, and ability to accommodate future upgrades. Their chassis-based design allows for the insertion of various line cards and modules, enabling organizations to customize their network to specific needs and expand capacity as required without a complete hardware overhaul. This adaptability is crucial for the dynamic and ever-expanding requirements of modern data centers.
Key drivers for the dominance of the Data Center segment include:
- Exponential Data Growth: The continuous surge in data generation from various sources (IoT, social media, enterprise applications) requires robust network infrastructure.
- Cloud Computing Proliferation: The shift towards hybrid and multi-cloud environments necessitates highly interconnected and efficient data center networks.
- AI and Machine Learning Workloads: These computationally intensive applications demand extremely high bandwidth and low latency switching solutions.
- Digital Transformation Initiatives: Businesses across all sectors are investing in digital technologies, relying heavily on data center infrastructure.
- Edge Computing Deployment: While distinct, edge computing also relies on data center principles and requires scalable switching solutions.
North America, particularly the United States, and Asia Pacific, with countries like China and India, are leading regions in terms of market share and growth potential. This is due to the presence of major cloud providers, significant investments in digital infrastructure, and a burgeoning technology sector. Economic policies fostering innovation and infrastructure development, coupled with substantial capital expenditure by technology giants, further solidify the dominance of the Data Center segment and advanced switch types like modular switches in driving overall market expansion. The ongoing development of next-generation data centers and the continuous upgrade cycles within existing ones underscore the sustained demand for high-performance switching solutions, reinforcing the leadership of the Data Center application and Modular Switches type in this dynamic market.
Data Center and Cloud Computing Switches Product Landscape
The product landscape for Data Center and Cloud Computing Switches is defined by a relentless drive towards higher speeds, increased port density, and enhanced intelligence. Innovations are centered around supporting 400GbE and the emerging 800GbE Ethernet standards, enabling organizations to handle unprecedented data throughput. Key features include advanced telemetry for real-time network monitoring, AI-driven traffic optimization, and programmability through SDN controllers. Modular switches offer unparalleled flexibility, allowing for customization with various port speeds and types, while fixed configuration switches provide cost-effective solutions for specific deployment needs. Products are increasingly designed for lower power consumption and improved thermal efficiency, aligning with sustainability goals.
Key Drivers, Barriers & Challenges in Data Center and Cloud Computing Switches
Key Drivers:
The primary forces propelling the Data Center and Cloud Computing Switches market are the exponential growth of data traffic driven by cloud adoption, AI/ML workloads, and the digital transformation across industries. The increasing demand for higher bandwidth (400GbE and beyond) to support these applications is a significant catalyst. Furthermore, the expansion of 5G networks and the rise of edge computing are creating new opportunities and demanding more agile and distributed network infrastructures.
Barriers & Challenges:
Key challenges include the substantial capital expenditure required for deploying next-generation switches, particularly for smaller enterprises. Supply chain disruptions and the global semiconductor shortage have also impacted availability and pricing. Intense competition and price pressure from both established vendors and new entrants, including open networking providers, can hinder profitability. Navigating complex interoperability standards and ensuring robust cybersecurity against evolving threats also pose significant hurdles for market participants.
Emerging Opportunities in Data Center and Cloud Computing Switches
Emerging opportunities lie in the growing demand for specialized switches tailored for specific workloads, such as AI/ML inference and high-frequency trading. The expansion of 5G infrastructure presents a significant avenue, requiring high-density, low-latency switches at the network edge. Furthermore, the increasing adoption of disaggregated network architectures and the rise of network automation software offer opportunities for vendors to provide integrated hardware and software solutions. Untapped markets in developing economies, coupled with the ongoing need for network upgrades to support emerging technologies like the metaverse, present substantial growth potential.
Growth Accelerators in the Data Center and Cloud Computing Switches Industry
Long-term growth in the Data Center and Cloud Computing Switches industry is being accelerated by continuous technological breakthroughs in silicon photonics and advanced switching ASICs, enabling higher speeds and greater efficiency. Strategic partnerships between hardware vendors, software providers, and cloud service providers are crucial for developing integrated solutions that simplify deployment and management. Market expansion strategies, including targeting specific industry verticals with tailored networking solutions and increasing penetration in emerging economies, are also significant growth catalysts. The ongoing evolution of networking standards and the development of new applications that rely on high-performance networking will continue to drive demand.
Key Players Shaping the Data Center and Cloud Computing Switches Market
- Cisco
- Huawei
- Juniper
- HPE
- Dell
- NETGEAR
- Datto
- Extreme Networks
- Arista Networks
- Allied Telesis
- H3C (Unisplendour)
- Broadcom
- Alcatel-Lucent
- D-Link
- TP-Link
- Ruijie Networks
- Fortinet, Inc.
Notable Milestones in Data Center and Cloud Computing Switches Sector
- 2020: Broadcom announces its acquisition of Symantec's enterprise security business, aiming to enhance its cybersecurity offerings relevant to network infrastructure.
- 2021: Arista Networks introduces new 400GbE switches designed for cloud networking and AI workloads, expanding its high-performance portfolio.
- 2022: Juniper Networks announces a strategic partnership with Microsoft Azure to accelerate cloud networking solutions.
- 2022: Cisco launches its next-generation data center switching platform, emphasizing programmability and AI-driven insights.
- 2023: Huawei continues to expand its presence in the enterprise networking market, focusing on intelligent connectivity solutions for data centers.
- 2023: Extreme Networks acquires Ipanema to enhance its enterprise SD-WAN and network analytics capabilities.
- 2024: Dell Technologies introduces new server and networking solutions optimized for AI and machine learning workloads.
- Q1 2025: Industry analysts anticipate further consolidation and strategic alliances as vendors focus on next-generation connectivity solutions.
In-Depth Data Center and Cloud Computing Switches Market Outlook
The future outlook for the Data Center and Cloud Computing Switches market is exceptionally bright, driven by sustained demand for digital infrastructure. Growth accelerators such as advancements in AI/ML, the expansion of 5G, and the continued adoption of cloud computing will fuel significant market expansion. Strategic opportunities abound for vendors who can offer innovative, high-performance, and cost-effective solutions. Companies focusing on seamless integration, enhanced automation, and robust security will be well-positioned to capitalize on the evolving needs of hyperscale cloud providers, enterprises, and telecommunication operators. The market is poised for continued innovation and strategic developments, promising robust growth throughout the forecast period.
Data Center and Cloud Computing Switches Segmentation
-
1. Application
- 1.1. Data Center
- 1.2. Metropolitan Area Network
- 1.3. Others
-
2. Types
- 2.1. Modular Switches
- 2.2. Fixed Switches
Data Center and Cloud Computing Switches Segmentation By Geography
-
1. North America
- 1.1. United States
- 1.2. Canada
- 1.3. Mexico
-
2. South America
- 2.1. Brazil
- 2.2. Argentina
- 2.3. Rest of South America
-
3. Europe
- 3.1. United Kingdom
- 3.2. Germany
- 3.3. France
- 3.4. Italy
- 3.5. Spain
- 3.6. Russia
- 3.7. Benelux
- 3.8. Nordics
- 3.9. Rest of Europe
-
4. Middle East & Africa
- 4.1. Turkey
- 4.2. Israel
- 4.3. GCC
- 4.4. North Africa
- 4.5. South Africa
- 4.6. Rest of Middle East & Africa
-
5. Asia Pacific
- 5.1. China
- 5.2. India
- 5.3. Japan
- 5.4. South Korea
- 5.5. ASEAN
- 5.6. Oceania
- 5.7. Rest of Asia Pacific
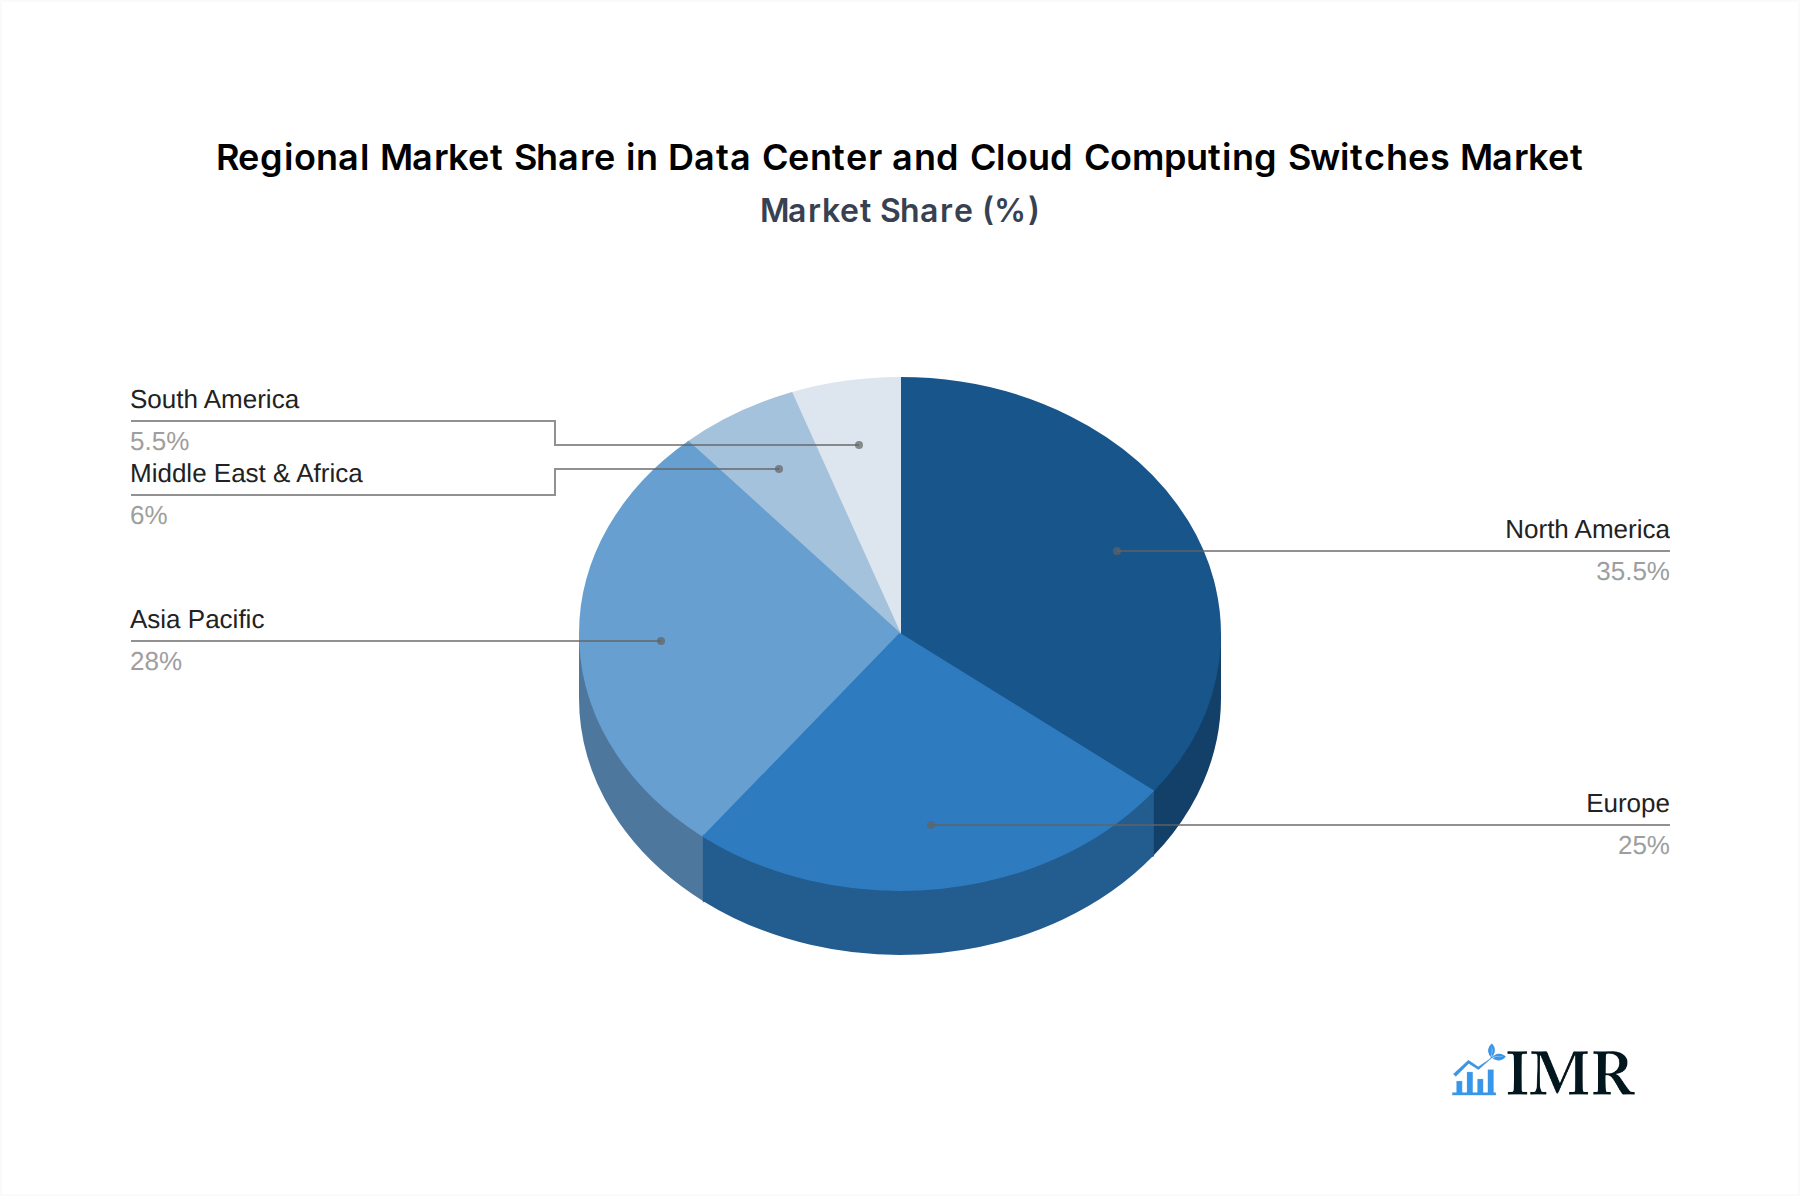
Data Center and Cloud Computing Switches Regional Market Share
Geographic Coverage of Data Center and Cloud Computing Switches
Data Center and Cloud Computing Switches REPORT HIGHLIGHTS
| Aspects | Details |
|---|---|
| Study Period | 2020-2034 |
| Base Year | 2025 |
| Estimated Year | 2026 |
| Forecast Period | 2026-2034 |
| Historical Period | 2020-2025 |
| Growth Rate | CAGR of 4.2% from 2020-2034 |
| Segmentation |
|
Table of Contents
- 1. Introduction
- 1.1. Research Scope
- 1.2. Market Segmentation
- 1.3. Research Objective
- 1.4. Definitions and Assumptions
- 2. Executive Summary
- 2.1. Market Snapshot
- 3. Market Dynamics
- 3.1. Market Drivers
- 3.2. Market Restrains
- 3.3. Market Trends
- 3.4. Market Opportunities
- 4. Market Factor Analysis
- 4.1. Porters Five Forces
- 4.1.1. Bargaining Power of Suppliers
- 4.1.2. Bargaining Power of Buyers
- 4.1.3. Threat of New Entrants
- 4.1.4. Threat of Substitutes
- 4.1.5. Competitive Rivalry
- 4.2. PESTEL analysis
- 4.3. BCG Analysis
- 4.3.1. Stars (High Growth, High Market Share)
- 4.3.2. Cash Cows (Low Growth, High Market Share)
- 4.3.3. Question Mark (High Growth, Low Market Share)
- 4.3.4. Dogs (Low Growth, Low Market Share)
- 4.4. Ansoff Matrix Analysis
- 4.5. Supply Chain Analysis
- 4.6. Regulatory Landscape
- 4.7. Current Market Potential and Opportunity Assessment (TAM–SAM–SOM Framework)
- 4.8. IMR Analyst Note
- 4.1. Porters Five Forces
- 5. Market Analysis, Insights and Forecast 2021-2033
- 5.1. Market Analysis, Insights and Forecast - by Application
- 5.1.1. Data Center
- 5.1.2. Metropolitan Area Network
- 5.1.3. Others
- 5.2. Market Analysis, Insights and Forecast - by Types
- 5.2.1. Modular Switches
- 5.2.2. Fixed Switches
- 5.3. Market Analysis, Insights and Forecast - by Region
- 5.3.1. North America
- 5.3.2. South America
- 5.3.3. Europe
- 5.3.4. Middle East & Africa
- 5.3.5. Asia Pacific
- 5.1. Market Analysis, Insights and Forecast - by Application
- 6. Global Data Center and Cloud Computing Switches Analysis, Insights and Forecast, 2021-2033
- 6.1. Market Analysis, Insights and Forecast - by Application
- 6.1.1. Data Center
- 6.1.2. Metropolitan Area Network
- 6.1.3. Others
- 6.2. Market Analysis, Insights and Forecast - by Types
- 6.2.1. Modular Switches
- 6.2.2. Fixed Switches
- 6.1. Market Analysis, Insights and Forecast - by Application
- 7. North America Data Center and Cloud Computing Switches Analysis, Insights and Forecast, 2020-2032
- 7.1. Market Analysis, Insights and Forecast - by Application
- 7.1.1. Data Center
- 7.1.2. Metropolitan Area Network
- 7.1.3. Others
- 7.2. Market Analysis, Insights and Forecast - by Types
- 7.2.1. Modular Switches
- 7.2.2. Fixed Switches
- 7.1. Market Analysis, Insights and Forecast - by Application
- 8. South America Data Center and Cloud Computing Switches Analysis, Insights and Forecast, 2020-2032
- 8.1. Market Analysis, Insights and Forecast - by Application
- 8.1.1. Data Center
- 8.1.2. Metropolitan Area Network
- 8.1.3. Others
- 8.2. Market Analysis, Insights and Forecast - by Types
- 8.2.1. Modular Switches
- 8.2.2. Fixed Switches
- 8.1. Market Analysis, Insights and Forecast - by Application
- 9. Europe Data Center and Cloud Computing Switches Analysis, Insights and Forecast, 2020-2032
- 9.1. Market Analysis, Insights and Forecast - by Application
- 9.1.1. Data Center
- 9.1.2. Metropolitan Area Network
- 9.1.3. Others
- 9.2. Market Analysis, Insights and Forecast - by Types
- 9.2.1. Modular Switches
- 9.2.2. Fixed Switches
- 9.1. Market Analysis, Insights and Forecast - by Application
- 10. Middle East & Africa Data Center and Cloud Computing Switches Analysis, Insights and Forecast, 2020-2032
- 10.1. Market Analysis, Insights and Forecast - by Application
- 10.1.1. Data Center
- 10.1.2. Metropolitan Area Network
- 10.1.3. Others
- 10.2. Market Analysis, Insights and Forecast - by Types
- 10.2.1. Modular Switches
- 10.2.2. Fixed Switches
- 10.1. Market Analysis, Insights and Forecast - by Application
- 11. Asia Pacific Data Center and Cloud Computing Switches Analysis, Insights and Forecast, 2020-2032
- 11.1. Market Analysis, Insights and Forecast - by Application
- 11.1.1. Data Center
- 11.1.2. Metropolitan Area Network
- 11.1.3. Others
- 11.2. Market Analysis, Insights and Forecast - by Types
- 11.2.1. Modular Switches
- 11.2.2. Fixed Switches
- 11.1. Market Analysis, Insights and Forecast - by Application
- 12. Competitive Analysis
- 12.1. Company Profiles
- 12.1.1 Cisco
- 12.1.1.1. Company Overview
- 12.1.1.2. Products
- 12.1.1.3. Company Financials
- 12.1.1.4. SWOT Analysis
- 12.1.2 Huawei
- 12.1.2.1. Company Overview
- 12.1.2.2. Products
- 12.1.2.3. Company Financials
- 12.1.2.4. SWOT Analysis
- 12.1.3 Juniper
- 12.1.3.1. Company Overview
- 12.1.3.2. Products
- 12.1.3.3. Company Financials
- 12.1.3.4. SWOT Analysis
- 12.1.4 HPE
- 12.1.4.1. Company Overview
- 12.1.4.2. Products
- 12.1.4.3. Company Financials
- 12.1.4.4. SWOT Analysis
- 12.1.5 Dell
- 12.1.5.1. Company Overview
- 12.1.5.2. Products
- 12.1.5.3. Company Financials
- 12.1.5.4. SWOT Analysis
- 12.1.6 NETGEAR
- 12.1.6.1. Company Overview
- 12.1.6.2. Products
- 12.1.6.3. Company Financials
- 12.1.6.4. SWOT Analysis
- 12.1.7 Datto
- 12.1.7.1. Company Overview
- 12.1.7.2. Products
- 12.1.7.3. Company Financials
- 12.1.7.4. SWOT Analysis
- 12.1.8 Extreme Networks
- 12.1.8.1. Company Overview
- 12.1.8.2. Products
- 12.1.8.3. Company Financials
- 12.1.8.4. SWOT Analysis
- 12.1.9 Arista Networks
- 12.1.9.1. Company Overview
- 12.1.9.2. Products
- 12.1.9.3. Company Financials
- 12.1.9.4. SWOT Analysis
- 12.1.10 Allied Telesis
- 12.1.10.1. Company Overview
- 12.1.10.2. Products
- 12.1.10.3. Company Financials
- 12.1.10.4. SWOT Analysis
- 12.1.11 H3C (Unisplendour)
- 12.1.11.1. Company Overview
- 12.1.11.2. Products
- 12.1.11.3. Company Financials
- 12.1.11.4. SWOT Analysis
- 12.1.12 Broadcom
- 12.1.12.1. Company Overview
- 12.1.12.2. Products
- 12.1.12.3. Company Financials
- 12.1.12.4. SWOT Analysis
- 12.1.13 Alcatel-Lucent
- 12.1.13.1. Company Overview
- 12.1.13.2. Products
- 12.1.13.3. Company Financials
- 12.1.13.4. SWOT Analysis
- 12.1.14 D-Link
- 12.1.14.1. Company Overview
- 12.1.14.2. Products
- 12.1.14.3. Company Financials
- 12.1.14.4. SWOT Analysis
- 12.1.15 TP-Link
- 12.1.15.1. Company Overview
- 12.1.15.2. Products
- 12.1.15.3. Company Financials
- 12.1.15.4. SWOT Analysis
- 12.1.16 Ruijie Networks
- 12.1.16.1. Company Overview
- 12.1.16.2. Products
- 12.1.16.3. Company Financials
- 12.1.16.4. SWOT Analysis
- 12.1.17 Fortinet
- 12.1.17.1. Company Overview
- 12.1.17.2. Products
- 12.1.17.3. Company Financials
- 12.1.17.4. SWOT Analysis
- 12.1.18 Inc.
- 12.1.18.1. Company Overview
- 12.1.18.2. Products
- 12.1.18.3. Company Financials
- 12.1.18.4. SWOT Analysis
- 12.1.1 Cisco
- 12.2. Market Entropy
- 12.2.1 Company's Key Areas Served
- 12.2.2 Recent Developments
- 12.3. Company Market Share Analysis 2025
- 12.3.1 Top 5 Companies Market Share Analysis
- 12.3.2 Top 3 Companies Market Share Analysis
- 12.4. List of Potential Customers
- 13. Research Methodology
List of Figures
- Figure 1: Global Data Center and Cloud Computing Switches Revenue Breakdown (billion, %) by Region 2025 & 2033
- Figure 2: Global Data Center and Cloud Computing Switches Volume Breakdown (K, %) by Region 2025 & 2033
- Figure 3: North America Data Center and Cloud Computing Switches Revenue (billion), by Application 2025 & 2033
- Figure 4: North America Data Center and Cloud Computing Switches Volume (K), by Application 2025 & 2033
- Figure 5: North America Data Center and Cloud Computing Switches Revenue Share (%), by Application 2025 & 2033
- Figure 6: North America Data Center and Cloud Computing Switches Volume Share (%), by Application 2025 & 2033
- Figure 7: North America Data Center and Cloud Computing Switches Revenue (billion), by Types 2025 & 2033
- Figure 8: North America Data Center and Cloud Computing Switches Volume (K), by Types 2025 & 2033
- Figure 9: North America Data Center and Cloud Computing Switches Revenue Share (%), by Types 2025 & 2033
- Figure 10: North America Data Center and Cloud Computing Switches Volume Share (%), by Types 2025 & 2033
- Figure 11: North America Data Center and Cloud Computing Switches Revenue (billion), by Country 2025 & 2033
- Figure 12: North America Data Center and Cloud Computing Switches Volume (K), by Country 2025 & 2033
- Figure 13: North America Data Center and Cloud Computing Switches Revenue Share (%), by Country 2025 & 2033
- Figure 14: North America Data Center and Cloud Computing Switches Volume Share (%), by Country 2025 & 2033
- Figure 15: South America Data Center and Cloud Computing Switches Revenue (billion), by Application 2025 & 2033
- Figure 16: South America Data Center and Cloud Computing Switches Volume (K), by Application 2025 & 2033
- Figure 17: South America Data Center and Cloud Computing Switches Revenue Share (%), by Application 2025 & 2033
- Figure 18: South America Data Center and Cloud Computing Switches Volume Share (%), by Application 2025 & 2033
- Figure 19: South America Data Center and Cloud Computing Switches Revenue (billion), by Types 2025 & 2033
- Figure 20: South America Data Center and Cloud Computing Switches Volume (K), by Types 2025 & 2033
- Figure 21: South America Data Center and Cloud Computing Switches Revenue Share (%), by Types 2025 & 2033
- Figure 22: South America Data Center and Cloud Computing Switches Volume Share (%), by Types 2025 & 2033
- Figure 23: South America Data Center and Cloud Computing Switches Revenue (billion), by Country 2025 & 2033
- Figure 24: South America Data Center and Cloud Computing Switches Volume (K), by Country 2025 & 2033
- Figure 25: South America Data Center and Cloud Computing Switches Revenue Share (%), by Country 2025 & 2033
- Figure 26: South America Data Center and Cloud Computing Switches Volume Share (%), by Country 2025 & 2033
- Figure 27: Europe Data Center and Cloud Computing Switches Revenue (billion), by Application 2025 & 2033
- Figure 28: Europe Data Center and Cloud Computing Switches Volume (K), by Application 2025 & 2033
- Figure 29: Europe Data Center and Cloud Computing Switches Revenue Share (%), by Application 2025 & 2033
- Figure 30: Europe Data Center and Cloud Computing Switches Volume Share (%), by Application 2025 & 2033
- Figure 31: Europe Data Center and Cloud Computing Switches Revenue (billion), by Types 2025 & 2033
- Figure 32: Europe Data Center and Cloud Computing Switches Volume (K), by Types 2025 & 2033
- Figure 33: Europe Data Center and Cloud Computing Switches Revenue Share (%), by Types 2025 & 2033
- Figure 34: Europe Data Center and Cloud Computing Switches Volume Share (%), by Types 2025 & 2033
- Figure 35: Europe Data Center and Cloud Computing Switches Revenue (billion), by Country 2025 & 2033
- Figure 36: Europe Data Center and Cloud Computing Switches Volume (K), by Country 2025 & 2033
- Figure 37: Europe Data Center and Cloud Computing Switches Revenue Share (%), by Country 2025 & 2033
- Figure 38: Europe Data Center and Cloud Computing Switches Volume Share (%), by Country 2025 & 2033
- Figure 39: Middle East & Africa Data Center and Cloud Computing Switches Revenue (billion), by Application 2025 & 2033
- Figure 40: Middle East & Africa Data Center and Cloud Computing Switches Volume (K), by Application 2025 & 2033
- Figure 41: Middle East & Africa Data Center and Cloud Computing Switches Revenue Share (%), by Application 2025 & 2033
- Figure 42: Middle East & Africa Data Center and Cloud Computing Switches Volume Share (%), by Application 2025 & 2033
- Figure 43: Middle East & Africa Data Center and Cloud Computing Switches Revenue (billion), by Types 2025 & 2033
- Figure 44: Middle East & Africa Data Center and Cloud Computing Switches Volume (K), by Types 2025 & 2033
- Figure 45: Middle East & Africa Data Center and Cloud Computing Switches Revenue Share (%), by Types 2025 & 2033
- Figure 46: Middle East & Africa Data Center and Cloud Computing Switches Volume Share (%), by Types 2025 & 2033
- Figure 47: Middle East & Africa Data Center and Cloud Computing Switches Revenue (billion), by Country 2025 & 2033
- Figure 48: Middle East & Africa Data Center and Cloud Computing Switches Volume (K), by Country 2025 & 2033
- Figure 49: Middle East & Africa Data Center and Cloud Computing Switches Revenue Share (%), by Country 2025 & 2033
- Figure 50: Middle East & Africa Data Center and Cloud Computing Switches Volume Share (%), by Country 2025 & 2033
- Figure 51: Asia Pacific Data Center and Cloud Computing Switches Revenue (billion), by Application 2025 & 2033
- Figure 52: Asia Pacific Data Center and Cloud Computing Switches Volume (K), by Application 2025 & 2033
- Figure 53: Asia Pacific Data Center and Cloud Computing Switches Revenue Share (%), by Application 2025 & 2033
- Figure 54: Asia Pacific Data Center and Cloud Computing Switches Volume Share (%), by Application 2025 & 2033
- Figure 55: Asia Pacific Data Center and Cloud Computing Switches Revenue (billion), by Types 2025 & 2033
- Figure 56: Asia Pacific Data Center and Cloud Computing Switches Volume (K), by Types 2025 & 2033
- Figure 57: Asia Pacific Data Center and Cloud Computing Switches Revenue Share (%), by Types 2025 & 2033
- Figure 58: Asia Pacific Data Center and Cloud Computing Switches Volume Share (%), by Types 2025 & 2033
- Figure 59: Asia Pacific Data Center and Cloud Computing Switches Revenue (billion), by Country 2025 & 2033
- Figure 60: Asia Pacific Data Center and Cloud Computing Switches Volume (K), by Country 2025 & 2033
- Figure 61: Asia Pacific Data Center and Cloud Computing Switches Revenue Share (%), by Country 2025 & 2033
- Figure 62: Asia Pacific Data Center and Cloud Computing Switches Volume Share (%), by Country 2025 & 2033
List of Tables
- Table 1: Global Data Center and Cloud Computing Switches Revenue billion Forecast, by Application 2020 & 2033
- Table 2: Global Data Center and Cloud Computing Switches Volume K Forecast, by Application 2020 & 2033
- Table 3: Global Data Center and Cloud Computing Switches Revenue billion Forecast, by Types 2020 & 2033
- Table 4: Global Data Center and Cloud Computing Switches Volume K Forecast, by Types 2020 & 2033
- Table 5: Global Data Center and Cloud Computing Switches Revenue billion Forecast, by Region 2020 & 2033
- Table 6: Global Data Center and Cloud Computing Switches Volume K Forecast, by Region 2020 & 2033
- Table 7: Global Data Center and Cloud Computing Switches Revenue billion Forecast, by Application 2020 & 2033
- Table 8: Global Data Center and Cloud Computing Switches Volume K Forecast, by Application 2020 & 2033
- Table 9: Global Data Center and Cloud Computing Switches Revenue billion Forecast, by Types 2020 & 2033
- Table 10: Global Data Center and Cloud Computing Switches Volume K Forecast, by Types 2020 & 2033
- Table 11: Global Data Center and Cloud Computing Switches Revenue billion Forecast, by Country 2020 & 2033
- Table 12: Global Data Center and Cloud Computing Switches Volume K Forecast, by Country 2020 & 2033
- Table 13: United States Data Center and Cloud Computing Switches Revenue (billion) Forecast, by Application 2020 & 2033
- Table 14: United States Data Center and Cloud Computing Switches Volume (K) Forecast, by Application 2020 & 2033
- Table 15: Canada Data Center and Cloud Computing Switches Revenue (billion) Forecast, by Application 2020 & 2033
- Table 16: Canada Data Center and Cloud Computing Switches Volume (K) Forecast, by Application 2020 & 2033
- Table 17: Mexico Data Center and Cloud Computing Switches Revenue (billion) Forecast, by Application 2020 & 2033
- Table 18: Mexico Data Center and Cloud Computing Switches Volume (K) Forecast, by Application 2020 & 2033
- Table 19: Global Data Center and Cloud Computing Switches Revenue billion Forecast, by Application 2020 & 2033
- Table 20: Global Data Center and Cloud Computing Switches Volume K Forecast, by Application 2020 & 2033
- Table 21: Global Data Center and Cloud Computing Switches Revenue billion Forecast, by Types 2020 & 2033
- Table 22: Global Data Center and Cloud Computing Switches Volume K Forecast, by Types 2020 & 2033
- Table 23: Global Data Center and Cloud Computing Switches Revenue billion Forecast, by Country 2020 & 2033
- Table 24: Global Data Center and Cloud Computing Switches Volume K Forecast, by Country 2020 & 2033
- Table 25: Brazil Data Center and Cloud Computing Switches Revenue (billion) Forecast, by Application 2020 & 2033
- Table 26: Brazil Data Center and Cloud Computing Switches Volume (K) Forecast, by Application 2020 & 2033
- Table 27: Argentina Data Center and Cloud Computing Switches Revenue (billion) Forecast, by Application 2020 & 2033
- Table 28: Argentina Data Center and Cloud Computing Switches Volume (K) Forecast, by Application 2020 & 2033
- Table 29: Rest of South America Data Center and Cloud Computing Switches Revenue (billion) Forecast, by Application 2020 & 2033
- Table 30: Rest of South America Data Center and Cloud Computing Switches Volume (K) Forecast, by Application 2020 & 2033
- Table 31: Global Data Center and Cloud Computing Switches Revenue billion Forecast, by Application 2020 & 2033
- Table 32: Global Data Center and Cloud Computing Switches Volume K Forecast, by Application 2020 & 2033
- Table 33: Global Data Center and Cloud Computing Switches Revenue billion Forecast, by Types 2020 & 2033
- Table 34: Global Data Center and Cloud Computing Switches Volume K Forecast, by Types 2020 & 2033
- Table 35: Global Data Center and Cloud Computing Switches Revenue billion Forecast, by Country 2020 & 2033
- Table 36: Global Data Center and Cloud Computing Switches Volume K Forecast, by Country 2020 & 2033
- Table 37: United Kingdom Data Center and Cloud Computing Switches Revenue (billion) Forecast, by Application 2020 & 2033
- Table 38: United Kingdom Data Center and Cloud Computing Switches Volume (K) Forecast, by Application 2020 & 2033
- Table 39: Germany Data Center and Cloud Computing Switches Revenue (billion) Forecast, by Application 2020 & 2033
- Table 40: Germany Data Center and Cloud Computing Switches Volume (K) Forecast, by Application 2020 & 2033
- Table 41: France Data Center and Cloud Computing Switches Revenue (billion) Forecast, by Application 2020 & 2033
- Table 42: France Data Center and Cloud Computing Switches Volume (K) Forecast, by Application 2020 & 2033
- Table 43: Italy Data Center and Cloud Computing Switches Revenue (billion) Forecast, by Application 2020 & 2033
- Table 44: Italy Data Center and Cloud Computing Switches Volume (K) Forecast, by Application 2020 & 2033
- Table 45: Spain Data Center and Cloud Computing Switches Revenue (billion) Forecast, by Application 2020 & 2033
- Table 46: Spain Data Center and Cloud Computing Switches Volume (K) Forecast, by Application 2020 & 2033
- Table 47: Russia Data Center and Cloud Computing Switches Revenue (billion) Forecast, by Application 2020 & 2033
- Table 48: Russia Data Center and Cloud Computing Switches Volume (K) Forecast, by Application 2020 & 2033
- Table 49: Benelux Data Center and Cloud Computing Switches Revenue (billion) Forecast, by Application 2020 & 2033
- Table 50: Benelux Data Center and Cloud Computing Switches Volume (K) Forecast, by Application 2020 & 2033
- Table 51: Nordics Data Center and Cloud Computing Switches Revenue (billion) Forecast, by Application 2020 & 2033
- Table 52: Nordics Data Center and Cloud Computing Switches Volume (K) Forecast, by Application 2020 & 2033
- Table 53: Rest of Europe Data Center and Cloud Computing Switches Revenue (billion) Forecast, by Application 2020 & 2033
- Table 54: Rest of Europe Data Center and Cloud Computing Switches Volume (K) Forecast, by Application 2020 & 2033
- Table 55: Global Data Center and Cloud Computing Switches Revenue billion Forecast, by Application 2020 & 2033
- Table 56: Global Data Center and Cloud Computing Switches Volume K Forecast, by Application 2020 & 2033
- Table 57: Global Data Center and Cloud Computing Switches Revenue billion Forecast, by Types 2020 & 2033
- Table 58: Global Data Center and Cloud Computing Switches Volume K Forecast, by Types 2020 & 2033
- Table 59: Global Data Center and Cloud Computing Switches Revenue billion Forecast, by Country 2020 & 2033
- Table 60: Global Data Center and Cloud Computing Switches Volume K Forecast, by Country 2020 & 2033
- Table 61: Turkey Data Center and Cloud Computing Switches Revenue (billion) Forecast, by Application 2020 & 2033
- Table 62: Turkey Data Center and Cloud Computing Switches Volume (K) Forecast, by Application 2020 & 2033
- Table 63: Israel Data Center and Cloud Computing Switches Revenue (billion) Forecast, by Application 2020 & 2033
- Table 64: Israel Data Center and Cloud Computing Switches Volume (K) Forecast, by Application 2020 & 2033
- Table 65: GCC Data Center and Cloud Computing Switches Revenue (billion) Forecast, by Application 2020 & 2033
- Table 66: GCC Data Center and Cloud Computing Switches Volume (K) Forecast, by Application 2020 & 2033
- Table 67: North Africa Data Center and Cloud Computing Switches Revenue (billion) Forecast, by Application 2020 & 2033
- Table 68: North Africa Data Center and Cloud Computing Switches Volume (K) Forecast, by Application 2020 & 2033
- Table 69: South Africa Data Center and Cloud Computing Switches Revenue (billion) Forecast, by Application 2020 & 2033
- Table 70: South Africa Data Center and Cloud Computing Switches Volume (K) Forecast, by Application 2020 & 2033
- Table 71: Rest of Middle East & Africa Data Center and Cloud Computing Switches Revenue (billion) Forecast, by Application 2020 & 2033
- Table 72: Rest of Middle East & Africa Data Center and Cloud Computing Switches Volume (K) Forecast, by Application 2020 & 2033
- Table 73: Global Data Center and Cloud Computing Switches Revenue billion Forecast, by Application 2020 & 2033
- Table 74: Global Data Center and Cloud Computing Switches Volume K Forecast, by Application 2020 & 2033
- Table 75: Global Data Center and Cloud Computing Switches Revenue billion Forecast, by Types 2020 & 2033
- Table 76: Global Data Center and Cloud Computing Switches Volume K Forecast, by Types 2020 & 2033
- Table 77: Global Data Center and Cloud Computing Switches Revenue billion Forecast, by Country 2020 & 2033
- Table 78: Global Data Center and Cloud Computing Switches Volume K Forecast, by Country 2020 & 2033
- Table 79: China Data Center and Cloud Computing Switches Revenue (billion) Forecast, by Application 2020 & 2033
- Table 80: China Data Center and Cloud Computing Switches Volume (K) Forecast, by Application 2020 & 2033
- Table 81: India Data Center and Cloud Computing Switches Revenue (billion) Forecast, by Application 2020 & 2033
- Table 82: India Data Center and Cloud Computing Switches Volume (K) Forecast, by Application 2020 & 2033
- Table 83: Japan Data Center and Cloud Computing Switches Revenue (billion) Forecast, by Application 2020 & 2033
- Table 84: Japan Data Center and Cloud Computing Switches Volume (K) Forecast, by Application 2020 & 2033
- Table 85: South Korea Data Center and Cloud Computing Switches Revenue (billion) Forecast, by Application 2020 & 2033
- Table 86: South Korea Data Center and Cloud Computing Switches Volume (K) Forecast, by Application 2020 & 2033
- Table 87: ASEAN Data Center and Cloud Computing Switches Revenue (billion) Forecast, by Application 2020 & 2033
- Table 88: ASEAN Data Center and Cloud Computing Switches Volume (K) Forecast, by Application 2020 & 2033
- Table 89: Oceania Data Center and Cloud Computing Switches Revenue (billion) Forecast, by Application 2020 & 2033
- Table 90: Oceania Data Center and Cloud Computing Switches Volume (K) Forecast, by Application 2020 & 2033
- Table 91: Rest of Asia Pacific Data Center and Cloud Computing Switches Revenue (billion) Forecast, by Application 2020 & 2033
- Table 92: Rest of Asia Pacific Data Center and Cloud Computing Switches Volume (K) Forecast, by Application 2020 & 2033
Frequently Asked Questions
1. What is the projected Compound Annual Growth Rate (CAGR) of the Data Center and Cloud Computing Switches?
The projected CAGR is approximately 4.2%.
2. Which companies are prominent players in the Data Center and Cloud Computing Switches?
Key companies in the market include Cisco, Huawei, Juniper, HPE, Dell, NETGEAR, Datto, Extreme Networks, Arista Networks, Allied Telesis, H3C (Unisplendour), Broadcom, Alcatel-Lucent, D-Link, TP-Link, Ruijie Networks, Fortinet, Inc..
3. What are the main segments of the Data Center and Cloud Computing Switches?
The market segments include Application, Types.
4. Can you provide details about the market size?
The market size is estimated to be USD 17.78 billion as of 2022.
5. What are some drivers contributing to market growth?
N/A
6. What are the notable trends driving market growth?
N/A
7. Are there any restraints impacting market growth?
N/A
8. Can you provide examples of recent developments in the market?
N/A
9. What pricing options are available for accessing the report?
Pricing options include single-user, multi-user, and enterprise licenses priced at USD 3350.00, USD 5025.00, and USD 6700.00 respectively.
10. Is the market size provided in terms of value or volume?
The market size is provided in terms of value, measured in billion and volume, measured in K.
11. Are there any specific market keywords associated with the report?
Yes, the market keyword associated with the report is "Data Center and Cloud Computing Switches," which aids in identifying and referencing the specific market segment covered.
12. How do I determine which pricing option suits my needs best?
The pricing options vary based on user requirements and access needs. Individual users may opt for single-user licenses, while businesses requiring broader access may choose multi-user or enterprise licenses for cost-effective access to the report.
13. Are there any additional resources or data provided in the Data Center and Cloud Computing Switches report?
While the report offers comprehensive insights, it's advisable to review the specific contents or supplementary materials provided to ascertain if additional resources or data are available.
14. How can I stay updated on further developments or reports in the Data Center and Cloud Computing Switches?
To stay informed about further developments, trends, and reports in the Data Center and Cloud Computing Switches, consider subscribing to industry newsletters, following relevant companies and organizations, or regularly checking reputable industry news sources and publications.
Methodology
Step 1 - Identification of Relevant Samples Size from Population Database


Step 2 - Approaches for Defining Global Market Size (Value, Volume* & Price*)

Note*: In applicable scenarios
Step 3 - Data Sources
Primary Research
- Web Analytics
- Survey Reports
- Research Institute
- Latest Research Reports
- Opinion Leaders
Secondary Research
- Annual Reports
- White Paper
- Latest Press Release
- Industry Association
- Paid Database
- Investor Presentations

Step 4 - Data Triangulation
Involves using different sources of information in order to increase the validity of a study
These sources are likely to be stakeholders in a program - participants, other researchers, program staff, other community members, and so on.
Then we put all data in single framework & apply various statistical tools to find out the dynamic on the market.
During the analysis stage, feedback from the stakeholder groups would be compared to determine areas of agreement as well as areas of divergence