

Key Insights
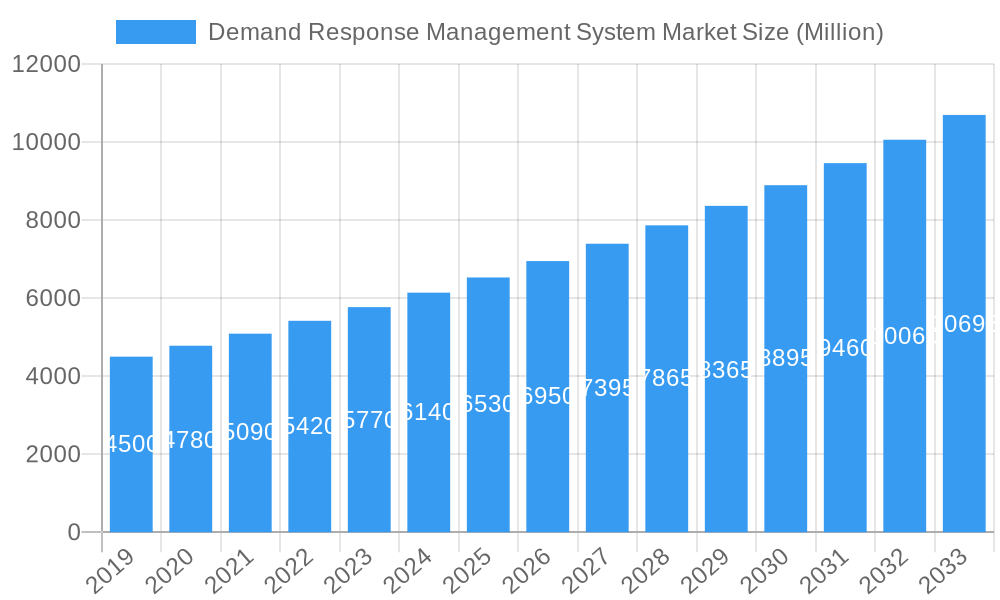
The Demand Response Management System (DRMS) market is poised for substantial growth, driven by increasing grid modernization efforts, the integration of renewable energy sources, and the growing imperative for energy efficiency and cost reduction. With a market size projected to reach an estimated XX million by 2025, and a robust Compound Annual Growth Rate (CAGR) exceeding 6.80% through 2033, the industry presents significant opportunities for stakeholders. The primary drivers of this expansion include the rising demand for grid stabilization, the need to manage peak load electricity consumption, and supportive government policies and incentives aimed at promoting flexible grid operations. Furthermore, advancements in IoT, AI, and cloud computing are enabling more sophisticated and automated demand response solutions, enhancing their effectiveness and adoption rates across various sectors, including utilities, commercial buildings, and industrial facilities.
Demand Response Management System Market Market Size (In Billion)
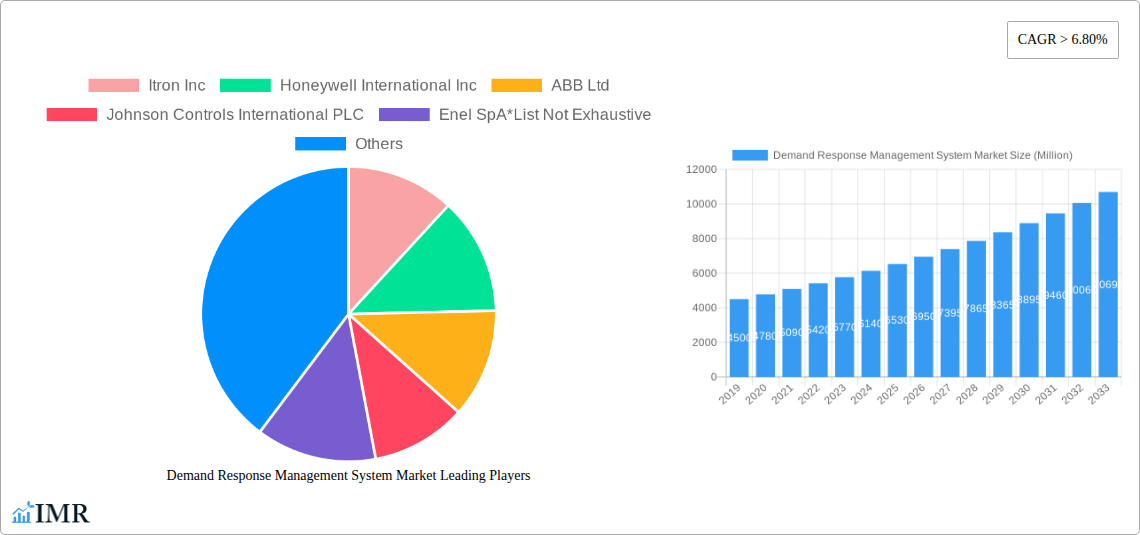
The market is segmented into two primary system types: Conventional Demand Response, which typically involves manual participation and communication, and Automated Demand Response (ADR), which leverages technology for real-time control and optimization. ADR is expected to witness a faster adoption rate due to its inherent efficiency and scalability. Key players such as Itron Inc., Honeywell International Inc., ABB Ltd., Johnson Controls International PLC, and Siemens AG are at the forefront, innovating and expanding their DRMS offerings. While North America and Europe are currently leading the market in terms of adoption and investment, the Asia Pacific region is emerging as a significant growth engine due to its rapid industrialization and increasing focus on smart grid technologies. Emerging trends include the integration of DRMS with distributed energy resources (DERs), the development of sophisticated analytics for forecasting and optimization, and the increasing role of virtual power plants (VPPs). However, challenges such as cybersecurity concerns, interoperability issues between different systems, and the need for robust regulatory frameworks may temper the growth trajectory.
Demand Response Management System Market Company Market Share
Demand Response Management System Market: Unleashing Grid Flexibility and Energy Efficiency
This comprehensive report provides an in-depth analysis of the global Demand Response Management System (DRMS) market, a critical component in modernizing energy grids and achieving sustainability goals. Explore market dynamics, growth trajectories, regional dominance, technological innovations, and the strategic landscape shaped by key players. Uncover the pivotal role of DRMS in managing peak loads, integrating renewables, and empowering consumers towards energy efficiency. This report is essential for utilities, grid operators, technology providers, policymakers, and investors seeking to understand and capitalize on the evolving DRMS ecosystem.
Report Coverage:
- Study Period: 2019–2033
- Base Year: 2025
- Estimated Year: 2025
- Forecast Period: 2025–2033
- Historical Period: 2019–2024
- Market Size: Present values in Million Units.
Demand Response Management System Market Market Dynamics & Structure
The Demand Response Management System (DRMS) market is characterized by a dynamic interplay of technological advancements, evolving regulatory landscapes, and increasing grid complexities. Market concentration varies by region, with established players holding significant shares, yet the emergence of innovative startups fueled by technological innovation in areas like AI and IoT is fostering a competitive environment. Regulatory frameworks, particularly those incentivizing grid flexibility and carbon reduction, act as significant drivers, shaping adoption rates and investment. Competitive product substitutes, though limited in direct comparison to integrated DRMS solutions, include manual load shedding and simpler energy management tools. End-user demographics are expanding beyond industrial and commercial sectors to include residential consumers, driven by smart home technology adoption and favorable tariffs. Mergers & Acquisition (M&A) trends are observed as larger utility and technology companies seek to bolster their DRMS capabilities and expand their service offerings. For instance, the increasing focus on grid modernization and distributed energy resource (DER) integration is pushing for more sophisticated DRMS solutions.
- Market Concentration: Moderate, with a blend of large, established providers and a growing number of specialized technology firms.
- Technological Innovation Drivers: AI/ML for forecasting and optimization, IoT for granular control, cloud computing for scalability, and advanced analytics for performance monitoring.
- Regulatory Frameworks: Government mandates for grid reliability, renewable energy integration targets, and incentives for demand response participation are crucial.
- Competitive Product Substitutes: Basic energy management software, manual control systems, and distributed generation as an alternative to load reduction.
- End-User Demographics: Primarily large commercial and industrial (C&I) facilities, increasingly expanding to small and medium businesses (SMBs) and residential sectors.
- M&A Trends: Acquisitions aimed at expanding service portfolios, gaining market share, and acquiring innovative technologies in the smart grid space.
Demand Response Management System Market Growth Trends & Insights
The global Demand Response Management System (DRMS) market is poised for robust expansion, driven by the imperative to enhance grid stability, manage peak electricity demand, and facilitate the integration of renewable energy sources. The market size is projected to witness a significant CAGR of approximately 15.8% between 2025 and 2033, expanding from an estimated USD 3,500 Million in 2025 to reach over USD 8,500 Million by 2033. Adoption rates are escalating as utilities and grid operators recognize the cost-effectiveness of DRMS compared to traditional infrastructure upgrades. Technological disruptions, including the proliferation of smart meters, advanced sensor networks, and sophisticated control algorithms, are enabling more precise and automated demand response participation. Consumer behavior shifts are also playing a crucial role, with increasing awareness of energy costs and environmental impact, leading to greater willingness to participate in demand response programs. The transition towards a decentralized energy landscape, characterized by a rise in distributed energy resources (DERs) like solar PV and battery storage, further necessitates advanced DRMS to orchestrate these resources effectively. This market growth is a direct reflection of the global energy sector's pivot towards a more resilient, efficient, and sustainable future. The increasing penetration of smart grid technologies globally provides a fertile ground for DRMS solutions to flourish. Furthermore, government incentives and policy frameworks promoting demand response are crucial in accelerating market growth and encouraging wider adoption.
Dominant Regions, Countries, or Segments in Demand Response Management System Market
The Automated Demand Response segment is projected to be the dominant force driving growth in the global Demand Response Management System (DRMS) market throughout the forecast period. This dominance is attributed to its inherent ability to provide real-time control, granular optimization, and seamless integration with various grid assets, significantly enhancing grid flexibility and reliability. The market share for Automated Demand Response is anticipated to exceed 65% of the total market by 2033.
Key Drivers of Dominance:
- Enhanced Grid Flexibility: Automated systems can respond instantaneously to grid signals, effectively managing peak loads and preventing blackouts. This is crucial as renewable energy penetration increases, leading to greater grid intermittency.
- Improved Efficiency and Cost Savings: By automatically adjusting energy consumption based on grid conditions and pricing signals, businesses and utilities can achieve substantial cost savings.
- Scalability and Integration: Automated DRMS solutions are designed to integrate seamlessly with a wide range of smart devices, IoT sensors, and existing grid infrastructure, making them highly scalable.
- Technological Advancements: Continuous innovation in areas like artificial intelligence (AI), machine learning (ML), and advanced analytics further enhances the capabilities of automated systems, enabling predictive load management and optimized participation.
- Regulatory Support: Favorable government policies and mandates promoting smart grid development and demand response programs are increasingly favoring automated solutions due to their proven effectiveness.
Geographical Dominance:
North America, particularly the United States, is expected to maintain its leadership position in the DRMS market. This is driven by a mature regulatory environment, significant investments in smart grid infrastructure, and the presence of large utility companies actively implementing demand response programs. Europe, with its ambitious renewable energy targets and strong emphasis on energy efficiency, also represents a significant growth region.
- North America: Leading in market adoption due to supportive policies, advanced grid infrastructure, and active utility programs. Estimated market share: ~40%.
- Europe: Rapidly growing due to strong renewable energy integration mandates and energy efficiency initiatives. Estimated market share: ~30%.
- Asia Pacific: Emerging as a key growth market, driven by increasing electricity demand, investments in smart grids, and government focus on energy security. Estimated market share: ~20%.
Demand Response Management System Market Product Landscape
The Demand Response Management System (DRMS) product landscape is characterized by sophisticated software platforms designed for efficient energy management and grid optimization. These systems offer advanced functionalities such as load forecasting, real-time monitoring, automated dispatch, and performance analytics. Innovations are increasingly focusing on interoperability with a wide array of DERs, including battery storage, electric vehicles, and smart appliances. Key performance metrics include response time, accuracy of load shedding, and the overall reduction in peak demand costs for participants. Unique selling propositions often revolve around the system's ability to seamlessly integrate with existing utility infrastructure while providing granular control and actionable insights for both grid operators and end-users, ultimately driving energy efficiency and grid resilience.
Key Drivers, Barriers & Challenges in Demand Response Management System Market
Key Drivers:
- Grid Modernization Initiatives: The global push for smarter, more resilient electricity grids is a primary driver, with DRMS playing a crucial role in load balancing and peak demand management.
- Increasing Renewable Energy Penetration: The intermittent nature of solar and wind power necessitates demand-side flexibility provided by DRMS to maintain grid stability.
- Cost Savings for Utilities and Consumers: DRMS offers significant economic benefits by reducing the need for expensive peaker plants and lowering electricity bills for participants.
- Environmental Regulations and Sustainability Goals: Growing concerns about climate change and carbon emissions encourage the adoption of energy-efficient solutions like DRMS.
- Technological Advancements: Proliferation of IoT devices, AI, and cloud computing enables more sophisticated and automated DRMS functionalities.
Key Barriers & Challenges:
- High Initial Investment Costs: The upfront expenditure for implementing DRMS solutions can be a deterrent for some organizations.
- Regulatory and Policy Uncertainty: Inconsistent or evolving regulatory frameworks across different jurisdictions can hinder widespread adoption.
- Customer Engagement and Education: Ensuring broad participation requires effective consumer education and engagement strategies to overcome inertia.
- Cybersecurity Concerns: Protecting sensitive grid data and operational systems from cyber threats is a paramount challenge for DRMS.
- Interoperability Issues: Ensuring seamless integration of diverse hardware and software components from various vendors can be complex.
Emerging Opportunities in Demand Response Management System Market
Emerging opportunities within the DRMS market lie in the burgeoning field of virtual power plants (VPPs), which aggregate distributed energy resources to provide grid services. The increasing adoption of electric vehicles (EVs) presents a significant opportunity for smart charging managed through DRMS to help balance grid loads. Furthermore, the integration of blockchain technology for secure and transparent energy transactions within DRMS frameworks is an area of growing interest. There's also a substantial untapped potential in expanding DRMS programs to smaller commercial entities and residential consumers through user-friendly interfaces and incentivized participation models, particularly in developing economies undergoing rapid grid modernization.
Growth Accelerators in the Demand Response Management System Market Industry
Growth in the Demand Response Management System (DRMS) market is being significantly accelerated by strategic partnerships between technology providers and utilities, fostering wider deployment and innovation. The continuous evolution of AI and machine learning algorithms is enabling more sophisticated predictive capabilities, leading to enhanced system performance and greater value proposition. Government initiatives and incentives, such as tax credits and grants for grid modernization and renewable energy integration, are acting as powerful catalysts. Moreover, the increasing corporate focus on sustainability and ESG (Environmental, Social, and Governance) goals is driving demand for DRMS solutions as a means to reduce carbon footprints and improve energy efficiency.
Key Players Shaping the Demand Response Management System Market Market
- Itron Inc.
- Honeywell International Inc.
- ABB Ltd
- Johnson Controls International PLC
- Enel SpA
- EnerNOC Inc.
- Siemens AG
- Schneider Electric SE
- General Electric Company
- AutoGrid Systems Inc.
Notable Milestones in Demand Response Management System Market Sector
- February 2022: Tata Consultancy Services (TCS) expanded its sustainability solutions by offering TCS Clever Energy, which includes crucial demand response functionalities, aiding organizations in optimizing energy usage and reducing emissions.
- July 2020: Enel X launched a significant demand response program in Taiwan, partnering with diverse industrial and commercial facilities to integrate them into its virtual power plant, showcasing expansion into new geographical markets.
In-Depth Demand Response Management System Market Market Outlook
The future outlook for the Demand Response Management System (DRMS) market is exceptionally bright, driven by the ongoing global energy transition and the persistent need for grid modernization. As utilities grapple with the challenges of integrating variable renewable energy sources and managing an increasingly complex grid, the demand for flexible and intelligent DRMS solutions will only intensify. The market is poised for sustained growth, fueled by technological advancements, supportive government policies, and a growing awareness among consumers and businesses of the economic and environmental benefits of demand response. Strategic investments in R&D, coupled with collaborative efforts between market players, will be crucial in unlocking new opportunities and ensuring the continued evolution of DRMS as a cornerstone of a resilient and sustainable energy future.
Demand Response Management System Market Segmentation
-
1. System Type
- 1.1. Conventional Demand Response
- 1.2. Automated Demand Response
Demand Response Management System Market Segmentation By Geography
- 1. North America
- 2. Europe
- 3. Asia Pacific
- 4. South America
- 5. Middle East
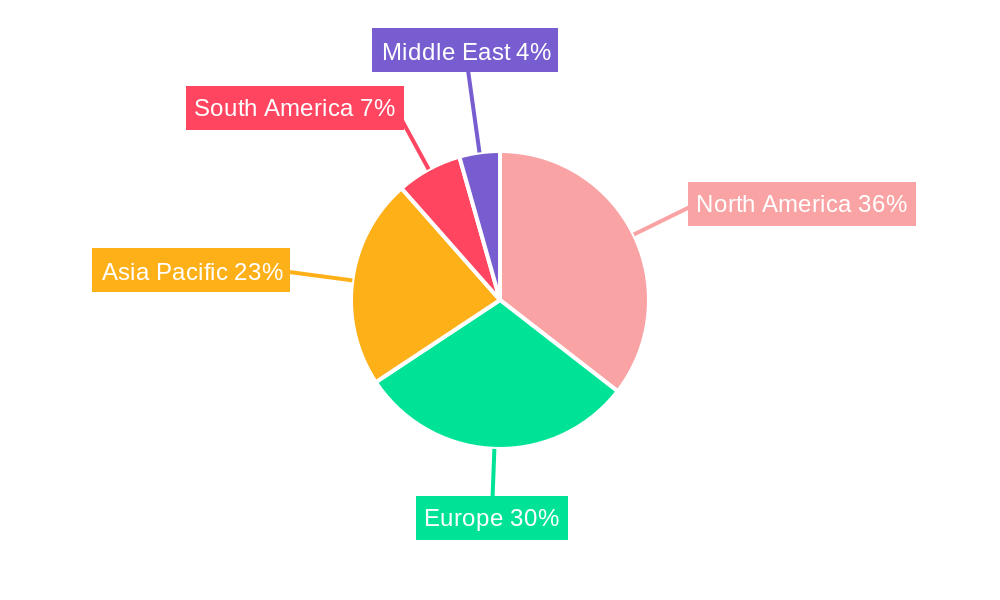
Demand Response Management System Market Regional Market Share
Geographic Coverage of Demand Response Management System Market
Demand Response Management System Market REPORT HIGHLIGHTS
| Aspects | Details |
|---|---|
| Study Period | 2020-2034 |
| Base Year | 2025 |
| Estimated Year | 2026 |
| Forecast Period | 2026-2034 |
| Historical Period | 2020-2025 |
| Growth Rate | CAGR of 30.2% from 2020-2034 |
| Segmentation |
|
Table of Contents
- 1. Introduction
- 1.1. Research Scope
- 1.2. Market Segmentation
- 1.3. Research Objective
- 1.4. Definitions and Assumptions
- 2. Executive Summary
- 2.1. Market Snapshot
- 3. Market Dynamics
- 3.1. Market Drivers
- 3.2. Market Restrains
- 3.3. Market Trends
- 3.4. Market Opportunities
- 4. Market Factor Analysis
- 4.1. Porters Five Forces
- 4.1.1. Bargaining Power of Suppliers
- 4.1.2. Bargaining Power of Buyers
- 4.1.3. Threat of New Entrants
- 4.1.4. Threat of Substitutes
- 4.1.5. Competitive Rivalry
- 4.2. PESTEL analysis
- 4.3. BCG Analysis
- 4.3.1. Stars (High Growth, High Market Share)
- 4.3.2. Cash Cows (Low Growth, High Market Share)
- 4.3.3. Question Mark (High Growth, Low Market Share)
- 4.3.4. Dogs (Low Growth, Low Market Share)
- 4.4. Ansoff Matrix Analysis
- 4.5. Supply Chain Analysis
- 4.6. Regulatory Landscape
- 4.7. Current Market Potential and Opportunity Assessment (TAM–SAM–SOM Framework)
- 4.8. IMR Analyst Note
- 4.1. Porters Five Forces
- 5. Market Analysis, Insights and Forecast 2021-2033
- 5.1. Market Analysis, Insights and Forecast - by System Type
- 5.1.1. Conventional Demand Response
- 5.1.2. Automated Demand Response
- 5.2. Market Analysis, Insights and Forecast - by Region
- 5.2.1. North America
- 5.2.2. Europe
- 5.2.3. Asia Pacific
- 5.2.4. South America
- 5.2.5. Middle East
- 5.1. Market Analysis, Insights and Forecast - by System Type
- 6. Global Demand Response Management System Market Analysis, Insights and Forecast, 2021-2033
- 6.1. Market Analysis, Insights and Forecast - by System Type
- 6.1.1. Conventional Demand Response
- 6.1.2. Automated Demand Response
- 6.1. Market Analysis, Insights and Forecast - by System Type
- 7. North America Demand Response Management System Market Analysis, Insights and Forecast, 2020-2032
- 7.1. Market Analysis, Insights and Forecast - by System Type
- 7.1.1. Conventional Demand Response
- 7.1.2. Automated Demand Response
- 7.1. Market Analysis, Insights and Forecast - by System Type
- 8. Europe Demand Response Management System Market Analysis, Insights and Forecast, 2020-2032
- 8.1. Market Analysis, Insights and Forecast - by System Type
- 8.1.1. Conventional Demand Response
- 8.1.2. Automated Demand Response
- 8.1. Market Analysis, Insights and Forecast - by System Type
- 9. Asia Pacific Demand Response Management System Market Analysis, Insights and Forecast, 2020-2032
- 9.1. Market Analysis, Insights and Forecast - by System Type
- 9.1.1. Conventional Demand Response
- 9.1.2. Automated Demand Response
- 9.1. Market Analysis, Insights and Forecast - by System Type
- 10. South America Demand Response Management System Market Analysis, Insights and Forecast, 2020-2032
- 10.1. Market Analysis, Insights and Forecast - by System Type
- 10.1.1. Conventional Demand Response
- 10.1.2. Automated Demand Response
- 10.1. Market Analysis, Insights and Forecast - by System Type
- 11. Middle East Demand Response Management System Market Analysis, Insights and Forecast, 2020-2032
- 11.1. Market Analysis, Insights and Forecast - by System Type
- 11.1.1. Conventional Demand Response
- 11.1.2. Automated Demand Response
- 11.1. Market Analysis, Insights and Forecast - by System Type
- 12. Competitive Analysis
- 12.1. Company Profiles
- 12.1.1 Itron Inc
- 12.1.1.1. Company Overview
- 12.1.1.2. Products
- 12.1.1.3. Company Financials
- 12.1.1.4. SWOT Analysis
- 12.1.2 Honeywell International Inc
- 12.1.2.1. Company Overview
- 12.1.2.2. Products
- 12.1.2.3. Company Financials
- 12.1.2.4. SWOT Analysis
- 12.1.3 ABB Ltd
- 12.1.3.1. Company Overview
- 12.1.3.2. Products
- 12.1.3.3. Company Financials
- 12.1.3.4. SWOT Analysis
- 12.1.4 Johnson Controls International PLC
- 12.1.4.1. Company Overview
- 12.1.4.2. Products
- 12.1.4.3. Company Financials
- 12.1.4.4. SWOT Analysis
- 12.1.5 Enel SpA*List Not Exhaustive
- 12.1.5.1. Company Overview
- 12.1.5.2. Products
- 12.1.5.3. Company Financials
- 12.1.5.4. SWOT Analysis
- 12.1.6 EnerNOC Inc
- 12.1.6.1. Company Overview
- 12.1.6.2. Products
- 12.1.6.3. Company Financials
- 12.1.6.4. SWOT Analysis
- 12.1.7 Siemens AG
- 12.1.7.1. Company Overview
- 12.1.7.2. Products
- 12.1.7.3. Company Financials
- 12.1.7.4. SWOT Analysis
- 12.1.8 Schneider Electric SE
- 12.1.8.1. Company Overview
- 12.1.8.2. Products
- 12.1.8.3. Company Financials
- 12.1.8.4. SWOT Analysis
- 12.1.9 General Electric Company
- 12.1.9.1. Company Overview
- 12.1.9.2. Products
- 12.1.9.3. Company Financials
- 12.1.9.4. SWOT Analysis
- 12.1.10 AutoGrid Systems Inc
- 12.1.10.1. Company Overview
- 12.1.10.2. Products
- 12.1.10.3. Company Financials
- 12.1.10.4. SWOT Analysis
- 12.1.1 Itron Inc
- 12.2. Market Entropy
- 12.2.1 Company's Key Areas Served
- 12.2.2 Recent Developments
- 12.3. Company Market Share Analysis 2025
- 12.3.1 Top 5 Companies Market Share Analysis
- 12.3.2 Top 3 Companies Market Share Analysis
- 12.4. List of Potential Customers
- 13. Research Methodology
List of Figures
- Figure 1: Global Demand Response Management System Market Revenue Breakdown (billion, %) by Region 2025 & 2033
- Figure 2: North America Demand Response Management System Market Revenue (billion), by System Type 2025 & 2033
- Figure 3: North America Demand Response Management System Market Revenue Share (%), by System Type 2025 & 2033
- Figure 4: North America Demand Response Management System Market Revenue (billion), by Country 2025 & 2033
- Figure 5: North America Demand Response Management System Market Revenue Share (%), by Country 2025 & 2033
- Figure 6: Europe Demand Response Management System Market Revenue (billion), by System Type 2025 & 2033
- Figure 7: Europe Demand Response Management System Market Revenue Share (%), by System Type 2025 & 2033
- Figure 8: Europe Demand Response Management System Market Revenue (billion), by Country 2025 & 2033
- Figure 9: Europe Demand Response Management System Market Revenue Share (%), by Country 2025 & 2033
- Figure 10: Asia Pacific Demand Response Management System Market Revenue (billion), by System Type 2025 & 2033
- Figure 11: Asia Pacific Demand Response Management System Market Revenue Share (%), by System Type 2025 & 2033
- Figure 12: Asia Pacific Demand Response Management System Market Revenue (billion), by Country 2025 & 2033
- Figure 13: Asia Pacific Demand Response Management System Market Revenue Share (%), by Country 2025 & 2033
- Figure 14: South America Demand Response Management System Market Revenue (billion), by System Type 2025 & 2033
- Figure 15: South America Demand Response Management System Market Revenue Share (%), by System Type 2025 & 2033
- Figure 16: South America Demand Response Management System Market Revenue (billion), by Country 2025 & 2033
- Figure 17: South America Demand Response Management System Market Revenue Share (%), by Country 2025 & 2033
- Figure 18: Middle East Demand Response Management System Market Revenue (billion), by System Type 2025 & 2033
- Figure 19: Middle East Demand Response Management System Market Revenue Share (%), by System Type 2025 & 2033
- Figure 20: Middle East Demand Response Management System Market Revenue (billion), by Country 2025 & 2033
- Figure 21: Middle East Demand Response Management System Market Revenue Share (%), by Country 2025 & 2033
List of Tables
- Table 1: Global Demand Response Management System Market Revenue billion Forecast, by System Type 2020 & 2033
- Table 2: Global Demand Response Management System Market Revenue billion Forecast, by Region 2020 & 2033
- Table 3: Global Demand Response Management System Market Revenue billion Forecast, by System Type 2020 & 2033
- Table 4: Global Demand Response Management System Market Revenue billion Forecast, by Country 2020 & 2033
- Table 5: Global Demand Response Management System Market Revenue billion Forecast, by System Type 2020 & 2033
- Table 6: Global Demand Response Management System Market Revenue billion Forecast, by Country 2020 & 2033
- Table 7: Global Demand Response Management System Market Revenue billion Forecast, by System Type 2020 & 2033
- Table 8: Global Demand Response Management System Market Revenue billion Forecast, by Country 2020 & 2033
- Table 9: Global Demand Response Management System Market Revenue billion Forecast, by System Type 2020 & 2033
- Table 10: Global Demand Response Management System Market Revenue billion Forecast, by Country 2020 & 2033
- Table 11: Global Demand Response Management System Market Revenue billion Forecast, by System Type 2020 & 2033
- Table 12: Global Demand Response Management System Market Revenue billion Forecast, by Country 2020 & 2033
Frequently Asked Questions
1. What is the projected Compound Annual Growth Rate (CAGR) of the Demand Response Management System Market?
The projected CAGR is approximately 30.2%.
2. Which companies are prominent players in the Demand Response Management System Market?
Key companies in the market include Itron Inc, Honeywell International Inc, ABB Ltd, Johnson Controls International PLC, Enel SpA*List Not Exhaustive, EnerNOC Inc, Siemens AG, Schneider Electric SE, General Electric Company, AutoGrid Systems Inc.
3. What are the main segments of the Demand Response Management System Market?
The market segments include System Type.
4. Can you provide details about the market size?
The market size is estimated to be USD 82.71 billion as of 2022.
5. What are some drivers contributing to market growth?
4.; Increasing Integration Of Renewable Energy Generation4.; Aging Power Grids And Investments In Transmission And Distribution Infrastructure.
6. What are the notable trends driving market growth?
Automated Demand Response Management System Type to Witness Significant Growth.
7. Are there any restraints impacting market growth?
4.; Lack Of Investor Confidence Due To Sociopolitical Instability In Some Countries.
8. Can you provide examples of recent developments in the market?
In February 2022, Tata Consultancy Services (TCS) offered its suite of sustainability solutions consisting of TCS Clever Energy, Intelligent Power Plant, and TCS Envirozone to help organizations gain insights into energy usage and reduce waste and emissions. TCS Clever Energy addresses various key functions, including demand response.
9. What pricing options are available for accessing the report?
Pricing options include single-user, multi-user, and enterprise licenses priced at USD 4750, USD 5250, and USD 8750 respectively.
10. Is the market size provided in terms of value or volume?
The market size is provided in terms of value, measured in billion.
11. Are there any specific market keywords associated with the report?
Yes, the market keyword associated with the report is "Demand Response Management System Market," which aids in identifying and referencing the specific market segment covered.
12. How do I determine which pricing option suits my needs best?
The pricing options vary based on user requirements and access needs. Individual users may opt for single-user licenses, while businesses requiring broader access may choose multi-user or enterprise licenses for cost-effective access to the report.
13. Are there any additional resources or data provided in the Demand Response Management System Market report?
While the report offers comprehensive insights, it's advisable to review the specific contents or supplementary materials provided to ascertain if additional resources or data are available.
14. How can I stay updated on further developments or reports in the Demand Response Management System Market?
To stay informed about further developments, trends, and reports in the Demand Response Management System Market, consider subscribing to industry newsletters, following relevant companies and organizations, or regularly checking reputable industry news sources and publications.
Methodology
Step 1 - Identification of Relevant Samples Size from Population Database


Step 2 - Approaches for Defining Global Market Size (Value, Volume* & Price*)

Note*: In applicable scenarios
Step 3 - Data Sources
Primary Research
- Web Analytics
- Survey Reports
- Research Institute
- Latest Research Reports
- Opinion Leaders
Secondary Research
- Annual Reports
- White Paper
- Latest Press Release
- Industry Association
- Paid Database
- Investor Presentations

Step 4 - Data Triangulation
Involves using different sources of information in order to increase the validity of a study
These sources are likely to be stakeholders in a program - participants, other researchers, program staff, other community members, and so on.
Then we put all data in single framework & apply various statistical tools to find out the dynamic on the market.
During the analysis stage, feedback from the stakeholder groups would be compared to determine areas of agreement as well as areas of divergence