

Key Insights
The digital business services market is experiencing robust growth, driven by increasing digital transformation initiatives across various industries. The market, estimated at $500 billion in 2025, is projected to exhibit a Compound Annual Growth Rate (CAGR) of 12% from 2025 to 2033, reaching approximately $1.5 trillion by 2033. This expansion is fueled by several key factors, including the rising adoption of cloud computing, the proliferation of big data analytics, the increasing demand for enhanced customer experiences through digital channels, and the growing need for cybersecurity solutions in a digitally interconnected world. Major players like HCL Technologies, Quinnox, HSBC Group, Siemens, SAP, T-Systems, and Liferay Inc. are actively shaping the market landscape through innovation and strategic partnerships. The market is segmented by service type (e.g., consulting, implementation, support), industry vertical (e.g., finance, healthcare, manufacturing), and geography. While the exact regional breakdown is unavailable, North America and Europe are anticipated to hold significant market shares due to high technological adoption and strong digital infrastructure.
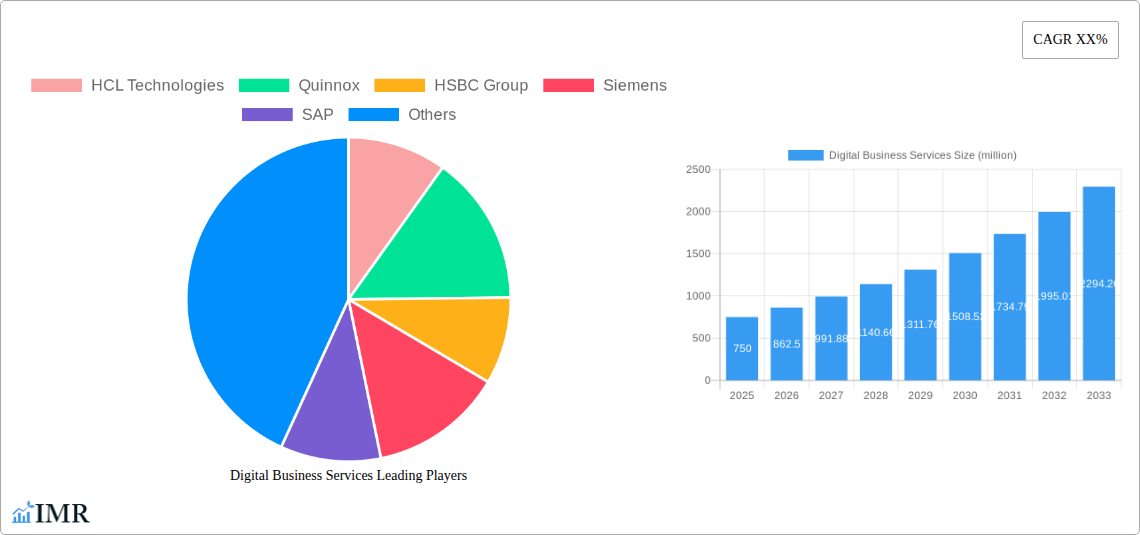
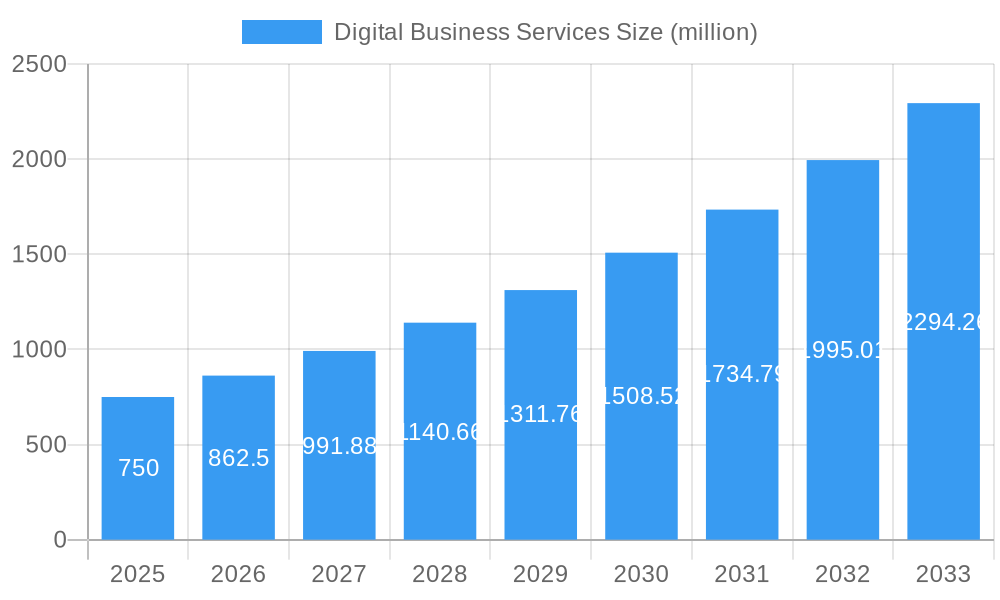
Digital Business Services Market Size (In Billion)
Growth within the sector is not without its challenges. Constraints include the high initial investment costs associated with digital transformation, a lack of skilled professionals in certain areas, and the evolving nature of digital technologies requiring continuous adaptation. However, the long-term benefits of increased efficiency, enhanced customer engagement, and improved decision-making far outweigh these challenges, continuing to propel market growth. Future trends indicate a growing focus on Artificial Intelligence (AI), Machine Learning (ML), and Internet of Things (IoT) integration within digital business services, fostering further market expansion and innovation. The competitive landscape is likely to intensify as companies strive to offer comprehensive, end-to-end solutions to meet the expanding needs of businesses globally.
Digital Business Services Company Market Share
Digital Business Services Market Report: 2019-2033
A comprehensive analysis of the Digital Business Services market, encompassing market dynamics, growth trends, regional dominance, product landscape, key players, and future outlook. This report provides critical insights for industry professionals, investors, and strategic decision-makers.
Study Period: 2019-2033 Base Year: 2025 Estimated Year: 2025 Forecast Period: 2025-2033 Historical Period: 2019-2024
Target Audience: Investors, Business Leaders, Market Analysts, Technology Professionals, Consultants.
Digital Business Services Market Dynamics & Structure
This report delves into the intricate dynamics shaping the Digital Business Services market, valued at $XX million in 2025. We analyze market concentration, revealing a moderately consolidated landscape with key players holding significant shares. Technological innovation, particularly in areas like AI, cloud computing, and cybersecurity, are major drivers. Stringent regulatory frameworks, including data privacy regulations (GDPR, CCPA), significantly influence market operations. The rise of competitive product substitutes, such as open-source solutions, presents ongoing challenges. End-user demographics are shifting towards digitally native businesses, driving demand. Finally, we explore M&A trends, noting an increase in strategic acquisitions (XX deals in 2024) aimed at expanding service portfolios and geographic reach. The report also quantifies market share percentages for key players and assesses the impact of innovation barriers on market growth.
- Market Concentration: Moderately consolidated, with top 5 players holding approximately 60% market share in 2025.
- Technological Innovation: AI, Cloud Computing, Cybersecurity, Blockchain driving growth.
- Regulatory Framework: GDPR, CCPA, and other data privacy regulations significantly impacting market operations.
- Competitive Substitutes: Open-source solutions posing a challenge to proprietary offerings.
- End-User Demographics: Shift towards digitally native businesses fueling demand.
- M&A Trends: Increase in strategic acquisitions for portfolio expansion and geographic reach (XX deals in 2024).
Digital Business Services Growth Trends & Insights
The Digital Business Services market exhibits robust growth, driven by increasing digital transformation initiatives across diverse industries. Utilizing proprietary data and industry analysis, the report reveals a Compound Annual Growth Rate (CAGR) of XX% during the forecast period (2025-2033), expanding the market size from $XX million in 2025 to an estimated $XX million by 2033. Market penetration remains relatively low (XX% in 2025), indicating substantial untapped potential for growth. Technological disruptions, such as the emergence of serverless computing and edge technologies, are accelerating adoption rates. Furthermore, the evolving consumer behavior, focusing on seamless digital experiences, fuels demand for advanced digital services. The report provides detailed analysis on segment-specific adoption rates and evolving technological landscapes.
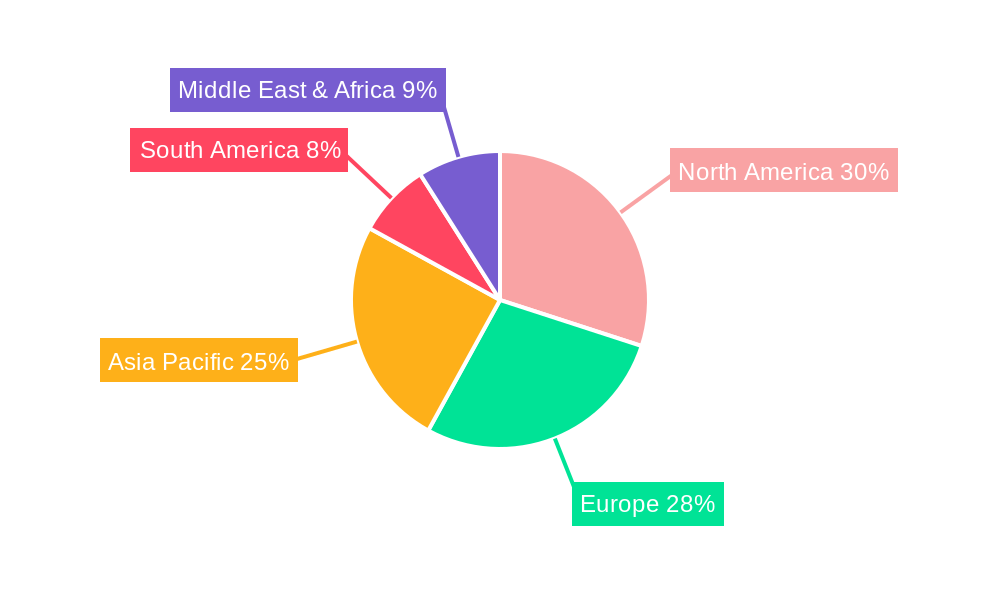
Dominant Regions, Countries, or Segments in Digital Business Services
North America currently dominates the Digital Business Services market, accounting for approximately XX% of global revenue in 2025. This dominance is attributable to a confluence of factors. Mature digital ecosystems, robust IT infrastructure, early adoption of new technologies, and high levels of disposable income contribute to this leadership position. However, the Asia-Pacific region displays significant growth potential, with a projected CAGR of XX% during the forecast period, driven by rapid economic expansion, rising digital literacy, and government initiatives promoting digitalization.
- North America: High digital maturity, robust infrastructure, early technology adoption, high disposable income.
- Asia-Pacific: Rapid economic growth, increasing digital literacy, government support for digitalization.
- Europe: Strong regulatory framework, focus on data privacy and security.
Digital Business Services Product Landscape
The Digital Business Services product landscape is characterized by continuous innovation. New product offerings incorporate advanced technologies like AI, machine learning, and IoT, enhancing performance, efficiency, and user experience. Cloud-based solutions are gaining prominence due to scalability, cost-effectiveness, and accessibility. Key differentiators include sophisticated automation capabilities, enhanced security features, and tailored solutions addressing specific industry needs. The market also witnesses a move toward integrated service platforms offering end-to-end solutions.
Key Drivers, Barriers & Challenges in Digital Business Services
Key Drivers:
- Rising adoption of cloud computing and digital transformation strategies.
- Growing demand for enhanced cybersecurity and data privacy solutions.
- Increasing investments in AI and machine learning applications.
- Government initiatives promoting digitalization across various sectors.
Challenges:
- Intense competition among service providers leading to price pressure.
- Skill shortages in critical areas like data science and cybersecurity.
- Concerns around data security and compliance with privacy regulations.
- Supply chain disruptions impacting service delivery and project timelines (estimated impact of 5% on revenue in 2024).
Emerging Opportunities in Digital Business Services
- Expansion into untapped markets in developing economies.
- Development of specialized solutions for emerging industries like Fintech and IoT.
- Leveraging AI and machine learning to create personalized digital experiences.
- Focus on sustainable and environmentally friendly digital solutions.
Growth Accelerators in the Digital Business Services Industry
Technological advancements, strategic partnerships, and market expansion into new geographic regions are key growth catalysts. Breakthroughs in AI, particularly in natural language processing and computer vision, are transforming service offerings. Strategic alliances between technology providers and industry-specific companies are fostering innovation and market penetration. Expanding into developing economies, capitalizing on the growing demand for digital services, will fuel long-term expansion.
Key Players Shaping the Digital Business Services Market
Notable Milestones in Digital Business Services Sector
- 2021: Significant increase in cloud adoption spurred by the pandemic.
- 2022 Q3: Launch of several AI-powered digital business solutions by major players.
- 2023 Q1: Several mergers and acquisitions aimed at expanding service portfolios.
- 2024 Q2: Introduction of new cybersecurity solutions to address evolving threats.
In-Depth Digital Business Services Market Outlook
The Digital Business Services market is poised for continued robust growth, driven by ongoing technological innovation, increasing digital transformation initiatives, and expanding market penetration. Strategic opportunities exist in emerging technologies like AI, IoT, and blockchain. Focus on developing customized solutions for specific industries and regions will be critical for success. The market's potential is substantial, promising significant returns for businesses that can adapt and innovate.
Digital Business Services Segmentation
-
1. Application
- 1.1. Large Enterprise
- 1.2. SMEs
-
2. Types
- 2.1. Data Analytics
- 2.2. Digital Consulting
- 2.3. Digital Applications & Platforms
- 2.4. Others
Digital Business Services Segmentation By Geography
-
1. North America
- 1.1. United States
- 1.2. Canada
- 1.3. Mexico
-
2. South America
- 2.1. Brazil
- 2.2. Argentina
- 2.3. Rest of South America
-
3. Europe
- 3.1. United Kingdom
- 3.2. Germany
- 3.3. France
- 3.4. Italy
- 3.5. Spain
- 3.6. Russia
- 3.7. Benelux
- 3.8. Nordics
- 3.9. Rest of Europe
-
4. Middle East & Africa
- 4.1. Turkey
- 4.2. Israel
- 4.3. GCC
- 4.4. North Africa
- 4.5. South Africa
- 4.6. Rest of Middle East & Africa
-
5. Asia Pacific
- 5.1. China
- 5.2. India
- 5.3. Japan
- 5.4. South Korea
- 5.5. ASEAN
- 5.6. Oceania
- 5.7. Rest of Asia Pacific
Digital Business Services Regional Market Share
Geographic Coverage of Digital Business Services
Digital Business Services REPORT HIGHLIGHTS
| Aspects | Details |
|---|---|
| Study Period | 2020-2034 |
| Base Year | 2025 |
| Estimated Year | 2026 |
| Forecast Period | 2026-2034 |
| Historical Period | 2020-2025 |
| Growth Rate | CAGR of 12.6% from 2020-2034 |
| Segmentation |
|
Table of Contents
- 1. Introduction
- 1.1. Research Scope
- 1.2. Market Segmentation
- 1.3. Research Objective
- 1.4. Definitions and Assumptions
- 2. Executive Summary
- 2.1. Market Snapshot
- 3. Market Dynamics
- 3.1. Market Drivers
- 3.2. Market Restrains
- 3.3. Market Trends
- 3.4. Market Opportunities
- 4. Market Factor Analysis
- 4.1. Porters Five Forces
- 4.1.1. Bargaining Power of Suppliers
- 4.1.2. Bargaining Power of Buyers
- 4.1.3. Threat of New Entrants
- 4.1.4. Threat of Substitutes
- 4.1.5. Competitive Rivalry
- 4.2. PESTEL analysis
- 4.3. BCG Analysis
- 4.3.1. Stars (High Growth, High Market Share)
- 4.3.2. Cash Cows (Low Growth, High Market Share)
- 4.3.3. Question Mark (High Growth, Low Market Share)
- 4.3.4. Dogs (Low Growth, Low Market Share)
- 4.4. Ansoff Matrix Analysis
- 4.5. Supply Chain Analysis
- 4.6. Regulatory Landscape
- 4.7. Current Market Potential and Opportunity Assessment (TAM–SAM–SOM Framework)
- 4.8. IMR Analyst Note
- 4.1. Porters Five Forces
- 5. Market Analysis, Insights and Forecast 2021-2033
- 5.1. Market Analysis, Insights and Forecast - by Application
- 5.1.1. Large Enterprise
- 5.1.2. SMEs
- 5.2. Market Analysis, Insights and Forecast - by Types
- 5.2.1. Data Analytics
- 5.2.2. Digital Consulting
- 5.2.3. Digital Applications & Platforms
- 5.2.4. Others
- 5.3. Market Analysis, Insights and Forecast - by Region
- 5.3.1. North America
- 5.3.2. South America
- 5.3.3. Europe
- 5.3.4. Middle East & Africa
- 5.3.5. Asia Pacific
- 5.1. Market Analysis, Insights and Forecast - by Application
- 6. Global Digital Business Services Analysis, Insights and Forecast, 2021-2033
- 6.1. Market Analysis, Insights and Forecast - by Application
- 6.1.1. Large Enterprise
- 6.1.2. SMEs
- 6.2. Market Analysis, Insights and Forecast - by Types
- 6.2.1. Data Analytics
- 6.2.2. Digital Consulting
- 6.2.3. Digital Applications & Platforms
- 6.2.4. Others
- 6.1. Market Analysis, Insights and Forecast - by Application
- 7. North America Digital Business Services Analysis, Insights and Forecast, 2020-2032
- 7.1. Market Analysis, Insights and Forecast - by Application
- 7.1.1. Large Enterprise
- 7.1.2. SMEs
- 7.2. Market Analysis, Insights and Forecast - by Types
- 7.2.1. Data Analytics
- 7.2.2. Digital Consulting
- 7.2.3. Digital Applications & Platforms
- 7.2.4. Others
- 7.1. Market Analysis, Insights and Forecast - by Application
- 8. South America Digital Business Services Analysis, Insights and Forecast, 2020-2032
- 8.1. Market Analysis, Insights and Forecast - by Application
- 8.1.1. Large Enterprise
- 8.1.2. SMEs
- 8.2. Market Analysis, Insights and Forecast - by Types
- 8.2.1. Data Analytics
- 8.2.2. Digital Consulting
- 8.2.3. Digital Applications & Platforms
- 8.2.4. Others
- 8.1. Market Analysis, Insights and Forecast - by Application
- 9. Europe Digital Business Services Analysis, Insights and Forecast, 2020-2032
- 9.1. Market Analysis, Insights and Forecast - by Application
- 9.1.1. Large Enterprise
- 9.1.2. SMEs
- 9.2. Market Analysis, Insights and Forecast - by Types
- 9.2.1. Data Analytics
- 9.2.2. Digital Consulting
- 9.2.3. Digital Applications & Platforms
- 9.2.4. Others
- 9.1. Market Analysis, Insights and Forecast - by Application
- 10. Middle East & Africa Digital Business Services Analysis, Insights and Forecast, 2020-2032
- 10.1. Market Analysis, Insights and Forecast - by Application
- 10.1.1. Large Enterprise
- 10.1.2. SMEs
- 10.2. Market Analysis, Insights and Forecast - by Types
- 10.2.1. Data Analytics
- 10.2.2. Digital Consulting
- 10.2.3. Digital Applications & Platforms
- 10.2.4. Others
- 10.1. Market Analysis, Insights and Forecast - by Application
- 11. Asia Pacific Digital Business Services Analysis, Insights and Forecast, 2020-2032
- 11.1. Market Analysis, Insights and Forecast - by Application
- 11.1.1. Large Enterprise
- 11.1.2. SMEs
- 11.2. Market Analysis, Insights and Forecast - by Types
- 11.2.1. Data Analytics
- 11.2.2. Digital Consulting
- 11.2.3. Digital Applications & Platforms
- 11.2.4. Others
- 11.1. Market Analysis, Insights and Forecast - by Application
- 12. Competitive Analysis
- 12.1. Company Profiles
- 12.1.1 HCL Technologies
- 12.1.1.1. Company Overview
- 12.1.1.2. Products
- 12.1.1.3. Company Financials
- 12.1.1.4. SWOT Analysis
- 12.1.2 Quinnox
- 12.1.2.1. Company Overview
- 12.1.2.2. Products
- 12.1.2.3. Company Financials
- 12.1.2.4. SWOT Analysis
- 12.1.3 HSBC Group
- 12.1.3.1. Company Overview
- 12.1.3.2. Products
- 12.1.3.3. Company Financials
- 12.1.3.4. SWOT Analysis
- 12.1.4 Siemens
- 12.1.4.1. Company Overview
- 12.1.4.2. Products
- 12.1.4.3. Company Financials
- 12.1.4.4. SWOT Analysis
- 12.1.5 SAP
- 12.1.5.1. Company Overview
- 12.1.5.2. Products
- 12.1.5.3. Company Financials
- 12.1.5.4. SWOT Analysis
- 12.1.6 T-Systems
- 12.1.6.1. Company Overview
- 12.1.6.2. Products
- 12.1.6.3. Company Financials
- 12.1.6.4. SWOT Analysis
- 12.1.7 Liferay Inc.
- 12.1.7.1. Company Overview
- 12.1.7.2. Products
- 12.1.7.3. Company Financials
- 12.1.7.4. SWOT Analysis
- 12.1.1 HCL Technologies
- 12.2. Market Entropy
- 12.2.1 Company's Key Areas Served
- 12.2.2 Recent Developments
- 12.3. Company Market Share Analysis 2025
- 12.3.1 Top 5 Companies Market Share Analysis
- 12.3.2 Top 3 Companies Market Share Analysis
- 12.4. List of Potential Customers
- 13. Research Methodology
List of Figures
- Figure 1: Global Digital Business Services Revenue Breakdown (undefined, %) by Region 2025 & 2033
- Figure 2: North America Digital Business Services Revenue (undefined), by Application 2025 & 2033
- Figure 3: North America Digital Business Services Revenue Share (%), by Application 2025 & 2033
- Figure 4: North America Digital Business Services Revenue (undefined), by Types 2025 & 2033
- Figure 5: North America Digital Business Services Revenue Share (%), by Types 2025 & 2033
- Figure 6: North America Digital Business Services Revenue (undefined), by Country 2025 & 2033
- Figure 7: North America Digital Business Services Revenue Share (%), by Country 2025 & 2033
- Figure 8: South America Digital Business Services Revenue (undefined), by Application 2025 & 2033
- Figure 9: South America Digital Business Services Revenue Share (%), by Application 2025 & 2033
- Figure 10: South America Digital Business Services Revenue (undefined), by Types 2025 & 2033
- Figure 11: South America Digital Business Services Revenue Share (%), by Types 2025 & 2033
- Figure 12: South America Digital Business Services Revenue (undefined), by Country 2025 & 2033
- Figure 13: South America Digital Business Services Revenue Share (%), by Country 2025 & 2033
- Figure 14: Europe Digital Business Services Revenue (undefined), by Application 2025 & 2033
- Figure 15: Europe Digital Business Services Revenue Share (%), by Application 2025 & 2033
- Figure 16: Europe Digital Business Services Revenue (undefined), by Types 2025 & 2033
- Figure 17: Europe Digital Business Services Revenue Share (%), by Types 2025 & 2033
- Figure 18: Europe Digital Business Services Revenue (undefined), by Country 2025 & 2033
- Figure 19: Europe Digital Business Services Revenue Share (%), by Country 2025 & 2033
- Figure 20: Middle East & Africa Digital Business Services Revenue (undefined), by Application 2025 & 2033
- Figure 21: Middle East & Africa Digital Business Services Revenue Share (%), by Application 2025 & 2033
- Figure 22: Middle East & Africa Digital Business Services Revenue (undefined), by Types 2025 & 2033
- Figure 23: Middle East & Africa Digital Business Services Revenue Share (%), by Types 2025 & 2033
- Figure 24: Middle East & Africa Digital Business Services Revenue (undefined), by Country 2025 & 2033
- Figure 25: Middle East & Africa Digital Business Services Revenue Share (%), by Country 2025 & 2033
- Figure 26: Asia Pacific Digital Business Services Revenue (undefined), by Application 2025 & 2033
- Figure 27: Asia Pacific Digital Business Services Revenue Share (%), by Application 2025 & 2033
- Figure 28: Asia Pacific Digital Business Services Revenue (undefined), by Types 2025 & 2033
- Figure 29: Asia Pacific Digital Business Services Revenue Share (%), by Types 2025 & 2033
- Figure 30: Asia Pacific Digital Business Services Revenue (undefined), by Country 2025 & 2033
- Figure 31: Asia Pacific Digital Business Services Revenue Share (%), by Country 2025 & 2033
List of Tables
- Table 1: Global Digital Business Services Revenue undefined Forecast, by Application 2020 & 2033
- Table 2: Global Digital Business Services Revenue undefined Forecast, by Types 2020 & 2033
- Table 3: Global Digital Business Services Revenue undefined Forecast, by Region 2020 & 2033
- Table 4: Global Digital Business Services Revenue undefined Forecast, by Application 2020 & 2033
- Table 5: Global Digital Business Services Revenue undefined Forecast, by Types 2020 & 2033
- Table 6: Global Digital Business Services Revenue undefined Forecast, by Country 2020 & 2033
- Table 7: United States Digital Business Services Revenue (undefined) Forecast, by Application 2020 & 2033
- Table 8: Canada Digital Business Services Revenue (undefined) Forecast, by Application 2020 & 2033
- Table 9: Mexico Digital Business Services Revenue (undefined) Forecast, by Application 2020 & 2033
- Table 10: Global Digital Business Services Revenue undefined Forecast, by Application 2020 & 2033
- Table 11: Global Digital Business Services Revenue undefined Forecast, by Types 2020 & 2033
- Table 12: Global Digital Business Services Revenue undefined Forecast, by Country 2020 & 2033
- Table 13: Brazil Digital Business Services Revenue (undefined) Forecast, by Application 2020 & 2033
- Table 14: Argentina Digital Business Services Revenue (undefined) Forecast, by Application 2020 & 2033
- Table 15: Rest of South America Digital Business Services Revenue (undefined) Forecast, by Application 2020 & 2033
- Table 16: Global Digital Business Services Revenue undefined Forecast, by Application 2020 & 2033
- Table 17: Global Digital Business Services Revenue undefined Forecast, by Types 2020 & 2033
- Table 18: Global Digital Business Services Revenue undefined Forecast, by Country 2020 & 2033
- Table 19: United Kingdom Digital Business Services Revenue (undefined) Forecast, by Application 2020 & 2033
- Table 20: Germany Digital Business Services Revenue (undefined) Forecast, by Application 2020 & 2033
- Table 21: France Digital Business Services Revenue (undefined) Forecast, by Application 2020 & 2033
- Table 22: Italy Digital Business Services Revenue (undefined) Forecast, by Application 2020 & 2033
- Table 23: Spain Digital Business Services Revenue (undefined) Forecast, by Application 2020 & 2033
- Table 24: Russia Digital Business Services Revenue (undefined) Forecast, by Application 2020 & 2033
- Table 25: Benelux Digital Business Services Revenue (undefined) Forecast, by Application 2020 & 2033
- Table 26: Nordics Digital Business Services Revenue (undefined) Forecast, by Application 2020 & 2033
- Table 27: Rest of Europe Digital Business Services Revenue (undefined) Forecast, by Application 2020 & 2033
- Table 28: Global Digital Business Services Revenue undefined Forecast, by Application 2020 & 2033
- Table 29: Global Digital Business Services Revenue undefined Forecast, by Types 2020 & 2033
- Table 30: Global Digital Business Services Revenue undefined Forecast, by Country 2020 & 2033
- Table 31: Turkey Digital Business Services Revenue (undefined) Forecast, by Application 2020 & 2033
- Table 32: Israel Digital Business Services Revenue (undefined) Forecast, by Application 2020 & 2033
- Table 33: GCC Digital Business Services Revenue (undefined) Forecast, by Application 2020 & 2033
- Table 34: North Africa Digital Business Services Revenue (undefined) Forecast, by Application 2020 & 2033
- Table 35: South Africa Digital Business Services Revenue (undefined) Forecast, by Application 2020 & 2033
- Table 36: Rest of Middle East & Africa Digital Business Services Revenue (undefined) Forecast, by Application 2020 & 2033
- Table 37: Global Digital Business Services Revenue undefined Forecast, by Application 2020 & 2033
- Table 38: Global Digital Business Services Revenue undefined Forecast, by Types 2020 & 2033
- Table 39: Global Digital Business Services Revenue undefined Forecast, by Country 2020 & 2033
- Table 40: China Digital Business Services Revenue (undefined) Forecast, by Application 2020 & 2033
- Table 41: India Digital Business Services Revenue (undefined) Forecast, by Application 2020 & 2033
- Table 42: Japan Digital Business Services Revenue (undefined) Forecast, by Application 2020 & 2033
- Table 43: South Korea Digital Business Services Revenue (undefined) Forecast, by Application 2020 & 2033
- Table 44: ASEAN Digital Business Services Revenue (undefined) Forecast, by Application 2020 & 2033
- Table 45: Oceania Digital Business Services Revenue (undefined) Forecast, by Application 2020 & 2033
- Table 46: Rest of Asia Pacific Digital Business Services Revenue (undefined) Forecast, by Application 2020 & 2033
Frequently Asked Questions
1. What is the projected Compound Annual Growth Rate (CAGR) of the Digital Business Services?
The projected CAGR is approximately 12.6%.
2. Which companies are prominent players in the Digital Business Services?
Key companies in the market include HCL Technologies, Quinnox, HSBC Group, Siemens, SAP, T-Systems, Liferay Inc..
3. What are the main segments of the Digital Business Services?
The market segments include Application, Types.
4. Can you provide details about the market size?
The market size is estimated to be USD XXX N/A as of 2022.
5. What are some drivers contributing to market growth?
N/A
6. What are the notable trends driving market growth?
N/A
7. Are there any restraints impacting market growth?
N/A
8. Can you provide examples of recent developments in the market?
N/A
9. What pricing options are available for accessing the report?
Pricing options include single-user, multi-user, and enterprise licenses priced at USD 2900.00, USD 4350.00, and USD 5800.00 respectively.
10. Is the market size provided in terms of value or volume?
The market size is provided in terms of value, measured in N/A.
11. Are there any specific market keywords associated with the report?
Yes, the market keyword associated with the report is "Digital Business Services," which aids in identifying and referencing the specific market segment covered.
12. How do I determine which pricing option suits my needs best?
The pricing options vary based on user requirements and access needs. Individual users may opt for single-user licenses, while businesses requiring broader access may choose multi-user or enterprise licenses for cost-effective access to the report.
13. Are there any additional resources or data provided in the Digital Business Services report?
While the report offers comprehensive insights, it's advisable to review the specific contents or supplementary materials provided to ascertain if additional resources or data are available.
14. How can I stay updated on further developments or reports in the Digital Business Services?
To stay informed about further developments, trends, and reports in the Digital Business Services, consider subscribing to industry newsletters, following relevant companies and organizations, or regularly checking reputable industry news sources and publications.
Methodology
Step 1 - Identification of Relevant Samples Size from Population Database


Step 2 - Approaches for Defining Global Market Size (Value, Volume* & Price*)

Note*: In applicable scenarios
Step 3 - Data Sources
Primary Research
- Web Analytics
- Survey Reports
- Research Institute
- Latest Research Reports
- Opinion Leaders
Secondary Research
- Annual Reports
- White Paper
- Latest Press Release
- Industry Association
- Paid Database
- Investor Presentations

Step 4 - Data Triangulation
Involves using different sources of information in order to increase the validity of a study
These sources are likely to be stakeholders in a program - participants, other researchers, program staff, other community members, and so on.
Then we put all data in single framework & apply various statistical tools to find out the dynamic on the market.
During the analysis stage, feedback from the stakeholder groups would be compared to determine areas of agreement as well as areas of divergence