

Key Insights
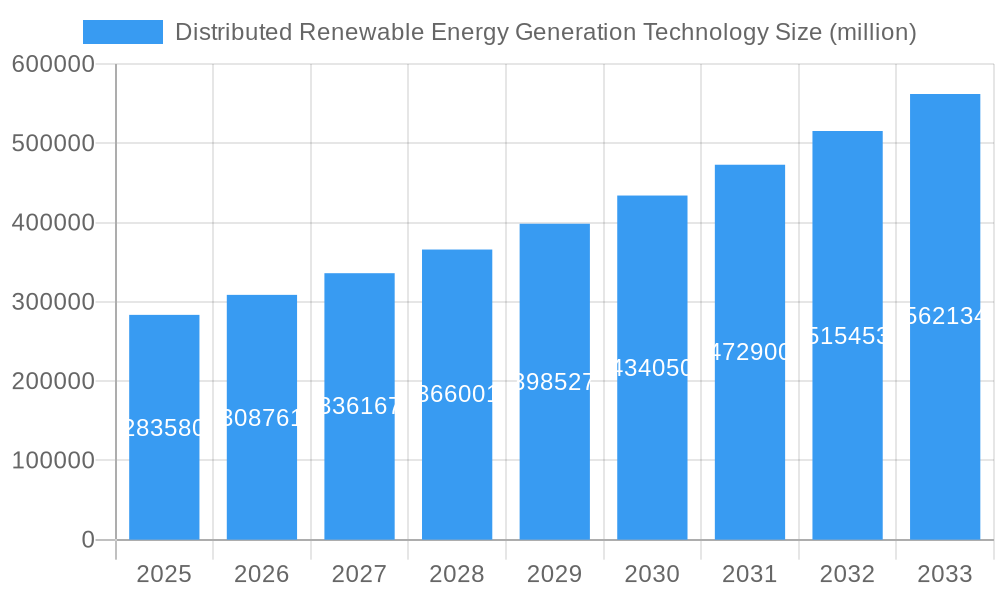
The global market for Distributed Renewable Energy Generation Technology is poised for substantial expansion, with a current market size of \$283,580 million. This growth is propelled by an impressive Compound Annual Growth Rate (CAGR) of 8.9%, indicating robust investor confidence and technological advancements. The market is primarily driven by the increasing demand for energy security, the imperative to reduce carbon emissions, and the declining costs of renewable energy sources like solar and wind power. Furthermore, government initiatives and supportive policies worldwide are actively encouraging the adoption of decentralized energy solutions. The market's versatility is evident in its segmentation, encompassing applications for both Civil Use and Military Use, highlighting its critical role across diverse sectors. Within the technology types, Solar Power and Wind Power are emerging as dominant forces, followed by Hydro Power, Waste-to-energy, and other emerging renewable sources. This broad spectrum of technologies underscores the market's adaptability and its capacity to cater to varied energy needs and geographical constraints.
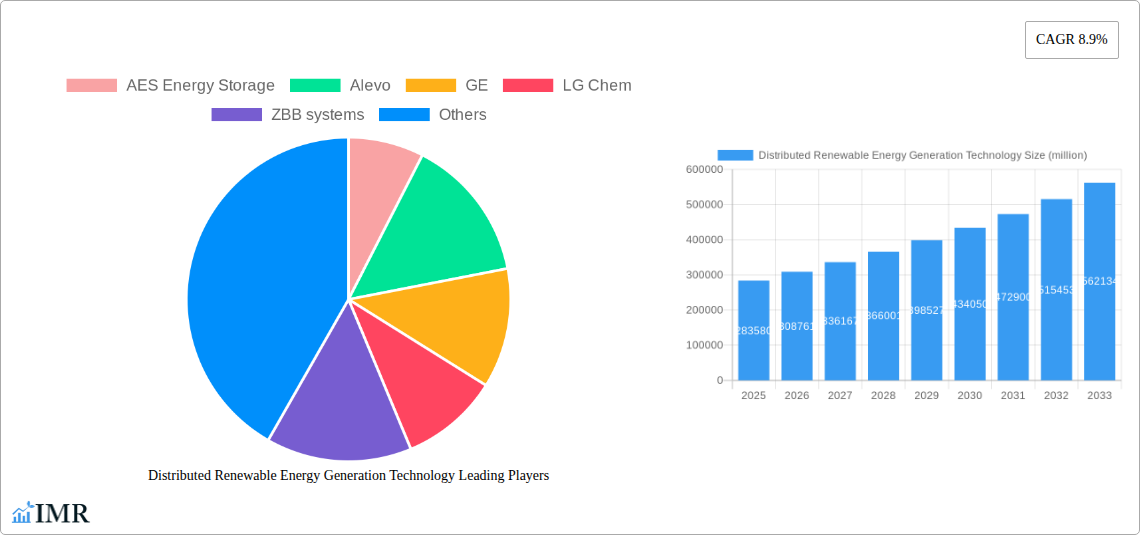
Distributed Renewable Energy Generation Technology Market Size (In Billion)
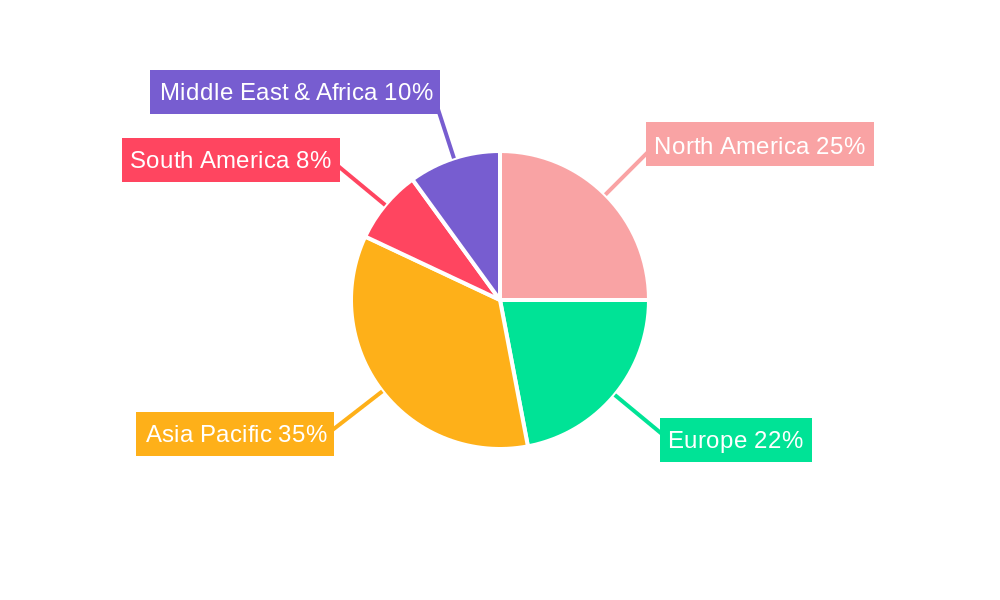
The forecast period from 2025 to 2033 anticipates continued strong performance, driven by ongoing innovation and the increasing integration of smart grid technologies that enhance the reliability and efficiency of distributed energy systems. Key players, ranging from established energy giants like GE and LG Chem to specialized storage solution providers such as AES Energy Storage and Samsung SDI, are investing heavily in research and development to offer more advanced and cost-effective solutions. Geographically, the Asia Pacific region, particularly China and India, is expected to witness the fastest growth due to rapid industrialization, rising energy consumption, and supportive government policies for renewable energy deployment. North America and Europe also represent significant markets, driven by stringent environmental regulations and a mature renewable energy infrastructure. While the market benefits from numerous drivers, challenges such as grid integration complexities and intermittency of some renewable sources need to be addressed through continued technological advancements and strategic planning.
Distributed Renewable Energy Generation Technology Company Market Share
Distributed Renewable Energy Generation Technology Market: A Comprehensive Analysis and Future Outlook
This report provides an in-depth analysis of the global Distributed Renewable Energy Generation Technology market, offering insights into its current dynamics, growth trajectory, and future potential. Covering the period from 2019 to 2033, with a base year of 2025, this study is an essential resource for industry stakeholders seeking to navigate this rapidly evolving landscape. It delves into market structure, growth trends, regional dominance, product innovations, key drivers, emerging opportunities, and a detailed company and milestone overview.
Distributed Renewable Energy Generation Technology Market Dynamics & Structure
The distributed renewable energy generation technology market is characterized by a moderate level of concentration, with key players like GE, Samsung SDI Co. Ltd., and LG Chem holding significant shares. Technological innovation is a primary driver, fueled by advancements in battery storage, smart grid integration, and enhanced efficiency of solar and wind technologies. Regulatory frameworks, including government incentives and renewable energy mandates, play a crucial role in shaping market adoption and investment. While competitive product substitutes exist in the form of centralized grid power and traditional fossil fuel generation, the growing emphasis on energy independence and resilience is bolstering the demand for distributed solutions. End-user demographics are shifting towards environmentally conscious consumers and businesses seeking cost savings and reliable power. Mergers and acquisitions (M&A) are a growing trend, with strategic alliances forming to consolidate market position and accelerate technological development. For instance, the estimated M&A deal volume for 2024 is projected at approximately $5,500 million. Innovation barriers include the high initial capital investment for some technologies and the need for standardized grid interconnection protocols.
- Market Concentration: Moderate, with key players in battery storage and renewable energy integration.
- Technological Innovation Drivers: Advancements in energy storage, smart grid technology, and renewable energy conversion efficiency.
- Regulatory Frameworks: Influential policies such as feed-in tariffs, tax credits, and renewable portfolio standards.
- Competitive Product Substitutes: Centralized grid power, fossil fuel-based generation.
- End-User Demographics: Growing segment of environmentally conscious consumers, businesses, and off-grid communities.
- M&A Trends: Increasing strategic partnerships and acquisitions to gain market share and technological expertise. Estimated M&A deal volume in 2024 is approximately $5,500 million.
- Innovation Barriers: High upfront costs, grid integration complexities, and the need for policy harmonization.
Distributed Renewable Energy Generation Technology Growth Trends & Insights
The distributed renewable energy generation technology market is poised for significant expansion, driven by a confluence of economic, environmental, and technological factors. The global market size, estimated at $150,000 million in 2025, is projected to reach $280,000 million by 2033, exhibiting a Compound Annual Growth Rate (CAGR) of approximately 8.1% during the forecast period. Adoption rates for solar photovoltaic (PV) systems coupled with battery storage are escalating rapidly, particularly in residential and commercial sectors seeking energy independence and backup power. Technological disruptions, such as the continuous improvement in battery energy density and the development of more efficient inverters and charge controllers, are making these systems more accessible and cost-effective. Consumer behavior is shifting towards proactive energy management, with a growing preference for renewable sources due to rising electricity prices and increasing awareness of climate change. The integration of smart home technologies and demand-response programs further enhances the appeal of distributed generation, enabling users to optimize their energy consumption and generation. The market penetration of residential solar PV systems, for example, is expected to grow from 15% in 2025 to over 25% by 2033 in developed economies. Furthermore, the increasing affordability of electric vehicles (EVs) is creating a synergistic demand for home charging solutions that can be powered by onsite renewable generation, further accelerating market adoption. The development of microgrids and their increasing integration into existing utility infrastructure represent another significant growth avenue, offering enhanced grid resilience and reliability in the face of extreme weather events and power outages.
Dominant Regions, Countries, or Segments in Distributed Renewable Energy Generation Technology
The Solar Power segment, within the broader Civil Use application, is a dominant force driving market growth for distributed renewable energy generation technology. This dominance is particularly pronounced in regions with high solar irradiance and supportive government policies.
Key Drivers:
- Economic Policies and Incentives: Generous feed-in tariffs, tax credits, and net metering policies in countries like the United States, Germany, and Australia have significantly boosted solar adoption. The estimated cumulative value of government incentives for solar PV in 2025 is projected to be around $30,000 million globally.
- Decreasing Technology Costs: The precipitous decline in the cost of solar panels and associated components has made solar power an economically viable option for a wider range of consumers and businesses. The average cost of solar PV installations has fallen by over 60% in the last decade.
- Growing Environmental Consciousness: Increased awareness of climate change and the desire for sustainable energy solutions are compelling individuals and organizations to invest in solar power.
- Energy Independence and Resilience: Solar systems, especially when paired with battery storage, offer a degree of energy independence and protection against grid outages, a growing concern in many regions.
- Technological Advancements: Continuous improvements in solar panel efficiency and the development of more effective energy storage solutions are enhancing the performance and reliability of solar-based distributed generation.
Dominance Factors:
The market share of solar power in the distributed renewable energy sector is estimated to be around 55% in 2025, with projected growth to over 60% by 2033. This leadership is sustained by its versatility, scalability from residential rooftops to large commercial installations, and its inherent modularity, allowing for incremental expansion of capacity. The geographical spread of favorable solar resources, coupled with strong policy support in major markets, ensures its continued preeminence. While wind power also contributes significantly, its deployment in distributed settings often faces more logistical and spatial constraints compared to solar. Hydro and waste-to-energy, while important for larger-scale renewable generation, have a more limited role in the distributed segment due to site-specific requirements and higher capital intensity. The civil use application, encompassing residential, commercial, and industrial sectors, represents approximately 85% of the total market for distributed renewable energy generation.
Distributed Renewable Energy Generation Technology Product Landscape
The product landscape of distributed renewable energy generation technology is marked by continuous innovation aimed at enhancing efficiency, reliability, and affordability. Key product categories include advanced solar photovoltaic (PV) modules with higher conversion efficiencies, often exceeding 22%, and increasingly integrated battery energy storage systems (BESS) offering enhanced energy density and longer cycle lives. Smart inverters with advanced grid-support functionalities, microinverters for module-level optimization, and intelligent energy management systems are becoming standard. Unique selling propositions lie in seamless integration, user-friendly interfaces, and robust performance warranties. Technological advancements are focusing on lightweight, flexible solar materials, solid-state battery technologies for improved safety and performance, and predictive maintenance capabilities driven by AI and IoT. The estimated annual innovation investment in this sector is projected to be in the range of $15,000 million.
Key Drivers, Barriers & Challenges in Distributed Renewable Energy Generation Technology
Key Drivers:
The distributed renewable energy generation market is propelled by a strong confluence of factors. Technological advancements, particularly in solar PV efficiency and battery energy storage, are making these solutions more cost-effective and performant. Government incentives and supportive policies, such as tax credits and renewable energy mandates, play a pivotal role in driving adoption. The increasing cost of conventional electricity and growing environmental consciousness among consumers are significant economic and societal drivers. Furthermore, the desire for energy independence and grid resilience, especially in the face of climate change and grid instability, is a powerful catalyst.
Key Barriers & Challenges:
Despite robust growth, the sector faces significant hurdles. High upfront capital costs for some advanced systems, although decreasing, remain a barrier for certain market segments. Complex regulatory frameworks and permitting processes can lead to project delays and increased administrative burdens. Grid integration challenges, including the need for grid modernization and cybersecurity measures, require substantial investment. Supply chain disruptions, as witnessed in recent years, can impact the availability and cost of critical components. Competitive pressures from established energy providers and the need for interoperability standards among diverse technologies also present ongoing challenges. The estimated impact of supply chain disruptions on project timelines is approximately 10-15%.
Emerging Opportunities in Distributed Renewable Energy Generation Technology
Emerging opportunities in distributed renewable energy generation technology are abundant, driven by evolving consumer needs and technological frontiers. The expansion of microgrid development for critical infrastructure and remote communities presents a substantial growth avenue, offering enhanced reliability and resilience. The integration of vehicle-to-grid (V2G) technology allows electric vehicles to act as mobile energy storage, creating new revenue streams and grid support capabilities. Furthermore, the burgeoning demand for behind-the-meter energy storage solutions tailored for specific industrial processes and commercial operations offers significant potential. Untapped markets in developing nations with rapidly growing energy demands, coupled with innovative financing models and pay-as-you-go solutions, are ripe for expansion. The increasing focus on circular economy principles within the renewable energy sector, leading to better recycling and upcycling of components, also presents a sustainable growth opportunity.
Growth Accelerators in the Distributed Renewable Energy Generation Technology Industry
Several catalysts are accelerating long-term growth in the distributed renewable energy generation technology industry. Continuous technological breakthroughs in areas like perovskite solar cells and next-generation battery chemistries promise even higher efficiencies and lower costs. Strategic partnerships between technology providers, utility companies, and financial institutions are crucial for scaling deployments and streamlining integration. Market expansion strategies, targeting underserved regions and new application areas such as agricultural resilience and data center power, are critical for sustained growth. The increasing focus on electrification of transportation and heating will create a synergistic demand for distributed renewable energy to power these systems. Furthermore, the development of advanced energy management software and AI-driven optimization platforms will enhance the economic and operational benefits of distributed generation for end-users.
Key Players Shaping the Distributed Renewable Energy Generation Technology Market
- AES Energy Storage
- Alevo
- GE
- LG Chem
- ZBB systems
- A123 Systems
- Active Power, Inc.
- Altair Nanotechnologies Inc
- China Bak Battery Inc.
- Electrovaya Inc.
- Energizer Holdings Inc.
- Enersys
- Exide Technologies
- GS Yuasa Corporation
- Hitachi
- Maxwell Technologies Inc.
- Nippon Chemi-Con Corporation
- SAFT
- Samsung SDI Co. Ltd.
- The Furukawa Battery Co. Ltd
- Kokam
- Ecoult Energy Storage Solutions
- Duke Energy
- Alstom
- Ballard Power Systems Inc.
- Calnetix Technologies, LLC
- Canyon Hydro
- Capstone Turbine Corporation
- Doosan Fuel Cell America
- Enercon
Notable Milestones in Distributed Renewable Energy Generation Technology Sector
- 2019: Significant advancements in lithium-ion battery manufacturing, leading to cost reductions and increased energy density.
- 2020: Widespread adoption of smart inverters with enhanced grid-support capabilities, facilitating better integration of distributed solar.
- 2021: Growing interest and initial deployments of vehicle-to-grid (V2G) technology, showcasing the potential of EVs as distributed energy resources.
- 2022: Major breakthroughs in solid-state battery research, promising enhanced safety and performance for energy storage applications.
- 2023: Increased investment in microgrid development driven by growing concerns over grid resilience and energy security.
- 2024 (Estimated): Continued M&A activity aimed at consolidating market positions and accelerating innovation in battery storage and renewable integration.
In-Depth Distributed Renewable Energy Generation Technology Market Outlook
The future outlook for the distributed renewable energy generation technology market is exceptionally positive, fueled by robust growth accelerators. Continuous technological innovation will further drive down costs and improve performance, making these solutions more attractive to a broader consumer base. The increasing focus on energy security, coupled with government mandates and international climate agreements, will ensure sustained policy support and investment. Strategic partnerships and market expansion initiatives will unlock new geographical markets and application segments. The electrification of transportation and heating sectors will create a significant synergistic demand for clean energy. Ultimately, the market is poised for substantial growth, presenting lucrative opportunities for stakeholders committed to a sustainable energy future. The projected market size in 2033 is $280,000 million.
Distributed Renewable Energy Generation Technology Segmentation
-
1. Application
- 1.1. Civil Use
- 1.2. Military Use
-
2. Types
- 2.1. Solar Power
- 2.2. Wind Power
- 2.3. Hydro Power
- 2.4. Waste-to-energy
- 2.5. Other
Distributed Renewable Energy Generation Technology Segmentation By Geography
-
1. North America
- 1.1. United States
- 1.2. Canada
- 1.3. Mexico
-
2. South America
- 2.1. Brazil
- 2.2. Argentina
- 2.3. Rest of South America
-
3. Europe
- 3.1. United Kingdom
- 3.2. Germany
- 3.3. France
- 3.4. Italy
- 3.5. Spain
- 3.6. Russia
- 3.7. Benelux
- 3.8. Nordics
- 3.9. Rest of Europe
-
4. Middle East & Africa
- 4.1. Turkey
- 4.2. Israel
- 4.3. GCC
- 4.4. North Africa
- 4.5. South Africa
- 4.6. Rest of Middle East & Africa
-
5. Asia Pacific
- 5.1. China
- 5.2. India
- 5.3. Japan
- 5.4. South Korea
- 5.5. ASEAN
- 5.6. Oceania
- 5.7. Rest of Asia Pacific
Distributed Renewable Energy Generation Technology Regional Market Share
Geographic Coverage of Distributed Renewable Energy Generation Technology
Distributed Renewable Energy Generation Technology REPORT HIGHLIGHTS
| Aspects | Details |
|---|---|
| Study Period | 2020-2034 |
| Base Year | 2025 |
| Estimated Year | 2026 |
| Forecast Period | 2026-2034 |
| Historical Period | 2020-2025 |
| Growth Rate | CAGR of 8.9% from 2020-2034 |
| Segmentation |
|
Table of Contents
- 1. Introduction
- 1.1. Research Scope
- 1.2. Market Segmentation
- 1.3. Research Objective
- 1.4. Definitions and Assumptions
- 2. Executive Summary
- 2.1. Market Snapshot
- 3. Market Dynamics
- 3.1. Market Drivers
- 3.2. Market Restrains
- 3.3. Market Trends
- 3.4. Market Opportunities
- 4. Market Factor Analysis
- 4.1. Porters Five Forces
- 4.1.1. Bargaining Power of Suppliers
- 4.1.2. Bargaining Power of Buyers
- 4.1.3. Threat of New Entrants
- 4.1.4. Threat of Substitutes
- 4.1.5. Competitive Rivalry
- 4.2. PESTEL analysis
- 4.3. BCG Analysis
- 4.3.1. Stars (High Growth, High Market Share)
- 4.3.2. Cash Cows (Low Growth, High Market Share)
- 4.3.3. Question Mark (High Growth, Low Market Share)
- 4.3.4. Dogs (Low Growth, Low Market Share)
- 4.4. Ansoff Matrix Analysis
- 4.5. Supply Chain Analysis
- 4.6. Regulatory Landscape
- 4.7. Current Market Potential and Opportunity Assessment (TAM–SAM–SOM Framework)
- 4.8. IMR Analyst Note
- 4.1. Porters Five Forces
- 5. Market Analysis, Insights and Forecast 2021-2033
- 5.1. Market Analysis, Insights and Forecast - by Application
- 5.1.1. Civil Use
- 5.1.2. Military Use
- 5.2. Market Analysis, Insights and Forecast - by Types
- 5.2.1. Solar Power
- 5.2.2. Wind Power
- 5.2.3. Hydro Power
- 5.2.4. Waste-to-energy
- 5.2.5. Other
- 5.3. Market Analysis, Insights and Forecast - by Region
- 5.3.1. North America
- 5.3.2. South America
- 5.3.3. Europe
- 5.3.4. Middle East & Africa
- 5.3.5. Asia Pacific
- 5.1. Market Analysis, Insights and Forecast - by Application
- 6. Global Distributed Renewable Energy Generation Technology Analysis, Insights and Forecast, 2021-2033
- 6.1. Market Analysis, Insights and Forecast - by Application
- 6.1.1. Civil Use
- 6.1.2. Military Use
- 6.2. Market Analysis, Insights and Forecast - by Types
- 6.2.1. Solar Power
- 6.2.2. Wind Power
- 6.2.3. Hydro Power
- 6.2.4. Waste-to-energy
- 6.2.5. Other
- 6.1. Market Analysis, Insights and Forecast - by Application
- 7. North America Distributed Renewable Energy Generation Technology Analysis, Insights and Forecast, 2020-2032
- 7.1. Market Analysis, Insights and Forecast - by Application
- 7.1.1. Civil Use
- 7.1.2. Military Use
- 7.2. Market Analysis, Insights and Forecast - by Types
- 7.2.1. Solar Power
- 7.2.2. Wind Power
- 7.2.3. Hydro Power
- 7.2.4. Waste-to-energy
- 7.2.5. Other
- 7.1. Market Analysis, Insights and Forecast - by Application
- 8. South America Distributed Renewable Energy Generation Technology Analysis, Insights and Forecast, 2020-2032
- 8.1. Market Analysis, Insights and Forecast - by Application
- 8.1.1. Civil Use
- 8.1.2. Military Use
- 8.2. Market Analysis, Insights and Forecast - by Types
- 8.2.1. Solar Power
- 8.2.2. Wind Power
- 8.2.3. Hydro Power
- 8.2.4. Waste-to-energy
- 8.2.5. Other
- 8.1. Market Analysis, Insights and Forecast - by Application
- 9. Europe Distributed Renewable Energy Generation Technology Analysis, Insights and Forecast, 2020-2032
- 9.1. Market Analysis, Insights and Forecast - by Application
- 9.1.1. Civil Use
- 9.1.2. Military Use
- 9.2. Market Analysis, Insights and Forecast - by Types
- 9.2.1. Solar Power
- 9.2.2. Wind Power
- 9.2.3. Hydro Power
- 9.2.4. Waste-to-energy
- 9.2.5. Other
- 9.1. Market Analysis, Insights and Forecast - by Application
- 10. Middle East & Africa Distributed Renewable Energy Generation Technology Analysis, Insights and Forecast, 2020-2032
- 10.1. Market Analysis, Insights and Forecast - by Application
- 10.1.1. Civil Use
- 10.1.2. Military Use
- 10.2. Market Analysis, Insights and Forecast - by Types
- 10.2.1. Solar Power
- 10.2.2. Wind Power
- 10.2.3. Hydro Power
- 10.2.4. Waste-to-energy
- 10.2.5. Other
- 10.1. Market Analysis, Insights and Forecast - by Application
- 11. Asia Pacific Distributed Renewable Energy Generation Technology Analysis, Insights and Forecast, 2020-2032
- 11.1. Market Analysis, Insights and Forecast - by Application
- 11.1.1. Civil Use
- 11.1.2. Military Use
- 11.2. Market Analysis, Insights and Forecast - by Types
- 11.2.1. Solar Power
- 11.2.2. Wind Power
- 11.2.3. Hydro Power
- 11.2.4. Waste-to-energy
- 11.2.5. Other
- 11.1. Market Analysis, Insights and Forecast - by Application
- 12. Competitive Analysis
- 12.1. Company Profiles
- 12.1.1 AES Energy Storage
- 12.1.1.1. Company Overview
- 12.1.1.2. Products
- 12.1.1.3. Company Financials
- 12.1.1.4. SWOT Analysis
- 12.1.2 Alevo
- 12.1.2.1. Company Overview
- 12.1.2.2. Products
- 12.1.2.3. Company Financials
- 12.1.2.4. SWOT Analysis
- 12.1.3 GE
- 12.1.3.1. Company Overview
- 12.1.3.2. Products
- 12.1.3.3. Company Financials
- 12.1.3.4. SWOT Analysis
- 12.1.4 LG Chem
- 12.1.4.1. Company Overview
- 12.1.4.2. Products
- 12.1.4.3. Company Financials
- 12.1.4.4. SWOT Analysis
- 12.1.5 ZBB systems
- 12.1.5.1. Company Overview
- 12.1.5.2. Products
- 12.1.5.3. Company Financials
- 12.1.5.4. SWOT Analysis
- 12.1.6 A123 Systems
- 12.1.6.1. Company Overview
- 12.1.6.2. Products
- 12.1.6.3. Company Financials
- 12.1.6.4. SWOT Analysis
- 12.1.7 Active Power
- 12.1.7.1. Company Overview
- 12.1.7.2. Products
- 12.1.7.3. Company Financials
- 12.1.7.4. SWOT Analysis
- 12.1.8 Inc.
- 12.1.8.1. Company Overview
- 12.1.8.2. Products
- 12.1.8.3. Company Financials
- 12.1.8.4. SWOT Analysis
- 12.1.9 Altair Nanotechnologies Inc
- 12.1.9.1. Company Overview
- 12.1.9.2. Products
- 12.1.9.3. Company Financials
- 12.1.9.4. SWOT Analysis
- 12.1.10 China Bak Battery Inc.
- 12.1.10.1. Company Overview
- 12.1.10.2. Products
- 12.1.10.3. Company Financials
- 12.1.10.4. SWOT Analysis
- 12.1.11 Electrovaya Inc.
- 12.1.11.1. Company Overview
- 12.1.11.2. Products
- 12.1.11.3. Company Financials
- 12.1.11.4. SWOT Analysis
- 12.1.12 Energizer Holdings Inc.
- 12.1.12.1. Company Overview
- 12.1.12.2. Products
- 12.1.12.3. Company Financials
- 12.1.12.4. SWOT Analysis
- 12.1.13 Enersys
- 12.1.13.1. Company Overview
- 12.1.13.2. Products
- 12.1.13.3. Company Financials
- 12.1.13.4. SWOT Analysis
- 12.1.14 Exide Technologies
- 12.1.14.1. Company Overview
- 12.1.14.2. Products
- 12.1.14.3. Company Financials
- 12.1.14.4. SWOT Analysis
- 12.1.15 GS Yuasa Corporation
- 12.1.15.1. Company Overview
- 12.1.15.2. Products
- 12.1.15.3. Company Financials
- 12.1.15.4. SWOT Analysis
- 12.1.16 Hitachi
- 12.1.16.1. Company Overview
- 12.1.16.2. Products
- 12.1.16.3. Company Financials
- 12.1.16.4. SWOT Analysis
- 12.1.17 Maxwell Technologies Inc.
- 12.1.17.1. Company Overview
- 12.1.17.2. Products
- 12.1.17.3. Company Financials
- 12.1.17.4. SWOT Analysis
- 12.1.18 Nippon Chemi-Con Corporation
- 12.1.18.1. Company Overview
- 12.1.18.2. Products
- 12.1.18.3. Company Financials
- 12.1.18.4. SWOT Analysis
- 12.1.19 SAFT
- 12.1.19.1. Company Overview
- 12.1.19.2. Products
- 12.1.19.3. Company Financials
- 12.1.19.4. SWOT Analysis
- 12.1.20 Samsung SDI Co. Ltd.
- 12.1.20.1. Company Overview
- 12.1.20.2. Products
- 12.1.20.3. Company Financials
- 12.1.20.4. SWOT Analysis
- 12.1.21 The Furukawa Battery Co. Ltd
- 12.1.21.1. Company Overview
- 12.1.21.2. Products
- 12.1.21.3. Company Financials
- 12.1.21.4. SWOT Analysis
- 12.1.22 Kokam
- 12.1.22.1. Company Overview
- 12.1.22.2. Products
- 12.1.22.3. Company Financials
- 12.1.22.4. SWOT Analysis
- 12.1.23 Ecoult Energy Storage Solutions
- 12.1.23.1. Company Overview
- 12.1.23.2. Products
- 12.1.23.3. Company Financials
- 12.1.23.4. SWOT Analysis
- 12.1.24 Duke Energy
- 12.1.24.1. Company Overview
- 12.1.24.2. Products
- 12.1.24.3. Company Financials
- 12.1.24.4. SWOT Analysis
- 12.1.25 Alstom
- 12.1.25.1. Company Overview
- 12.1.25.2. Products
- 12.1.25.3. Company Financials
- 12.1.25.4. SWOT Analysis
- 12.1.26 Ballard Power Systems Inc.
- 12.1.26.1. Company Overview
- 12.1.26.2. Products
- 12.1.26.3. Company Financials
- 12.1.26.4. SWOT Analysis
- 12.1.27 Calnetix Technologies
- 12.1.27.1. Company Overview
- 12.1.27.2. Products
- 12.1.27.3. Company Financials
- 12.1.27.4. SWOT Analysis
- 12.1.28 LLC
- 12.1.28.1. Company Overview
- 12.1.28.2. Products
- 12.1.28.3. Company Financials
- 12.1.28.4. SWOT Analysis
- 12.1.29 Canyon Hydro
- 12.1.29.1. Company Overview
- 12.1.29.2. Products
- 12.1.29.3. Company Financials
- 12.1.29.4. SWOT Analysis
- 12.1.30 Capstone Turbine Corporation
- 12.1.30.1. Company Overview
- 12.1.30.2. Products
- 12.1.30.3. Company Financials
- 12.1.30.4. SWOT Analysis
- 12.1.31 Doosan Fuel Cell America
- 12.1.31.1. Company Overview
- 12.1.31.2. Products
- 12.1.31.3. Company Financials
- 12.1.31.4. SWOT Analysis
- 12.1.32 Enercon
- 12.1.32.1. Company Overview
- 12.1.32.2. Products
- 12.1.32.3. Company Financials
- 12.1.32.4. SWOT Analysis
- 12.1.1 AES Energy Storage
- 12.2. Market Entropy
- 12.2.1 Company's Key Areas Served
- 12.2.2 Recent Developments
- 12.3. Company Market Share Analysis 2025
- 12.3.1 Top 5 Companies Market Share Analysis
- 12.3.2 Top 3 Companies Market Share Analysis
- 12.4. List of Potential Customers
- 13. Research Methodology
List of Figures
- Figure 1: Global Distributed Renewable Energy Generation Technology Revenue Breakdown (million, %) by Region 2025 & 2033
- Figure 2: North America Distributed Renewable Energy Generation Technology Revenue (million), by Application 2025 & 2033
- Figure 3: North America Distributed Renewable Energy Generation Technology Revenue Share (%), by Application 2025 & 2033
- Figure 4: North America Distributed Renewable Energy Generation Technology Revenue (million), by Types 2025 & 2033
- Figure 5: North America Distributed Renewable Energy Generation Technology Revenue Share (%), by Types 2025 & 2033
- Figure 6: North America Distributed Renewable Energy Generation Technology Revenue (million), by Country 2025 & 2033
- Figure 7: North America Distributed Renewable Energy Generation Technology Revenue Share (%), by Country 2025 & 2033
- Figure 8: South America Distributed Renewable Energy Generation Technology Revenue (million), by Application 2025 & 2033
- Figure 9: South America Distributed Renewable Energy Generation Technology Revenue Share (%), by Application 2025 & 2033
- Figure 10: South America Distributed Renewable Energy Generation Technology Revenue (million), by Types 2025 & 2033
- Figure 11: South America Distributed Renewable Energy Generation Technology Revenue Share (%), by Types 2025 & 2033
- Figure 12: South America Distributed Renewable Energy Generation Technology Revenue (million), by Country 2025 & 2033
- Figure 13: South America Distributed Renewable Energy Generation Technology Revenue Share (%), by Country 2025 & 2033
- Figure 14: Europe Distributed Renewable Energy Generation Technology Revenue (million), by Application 2025 & 2033
- Figure 15: Europe Distributed Renewable Energy Generation Technology Revenue Share (%), by Application 2025 & 2033
- Figure 16: Europe Distributed Renewable Energy Generation Technology Revenue (million), by Types 2025 & 2033
- Figure 17: Europe Distributed Renewable Energy Generation Technology Revenue Share (%), by Types 2025 & 2033
- Figure 18: Europe Distributed Renewable Energy Generation Technology Revenue (million), by Country 2025 & 2033
- Figure 19: Europe Distributed Renewable Energy Generation Technology Revenue Share (%), by Country 2025 & 2033
- Figure 20: Middle East & Africa Distributed Renewable Energy Generation Technology Revenue (million), by Application 2025 & 2033
- Figure 21: Middle East & Africa Distributed Renewable Energy Generation Technology Revenue Share (%), by Application 2025 & 2033
- Figure 22: Middle East & Africa Distributed Renewable Energy Generation Technology Revenue (million), by Types 2025 & 2033
- Figure 23: Middle East & Africa Distributed Renewable Energy Generation Technology Revenue Share (%), by Types 2025 & 2033
- Figure 24: Middle East & Africa Distributed Renewable Energy Generation Technology Revenue (million), by Country 2025 & 2033
- Figure 25: Middle East & Africa Distributed Renewable Energy Generation Technology Revenue Share (%), by Country 2025 & 2033
- Figure 26: Asia Pacific Distributed Renewable Energy Generation Technology Revenue (million), by Application 2025 & 2033
- Figure 27: Asia Pacific Distributed Renewable Energy Generation Technology Revenue Share (%), by Application 2025 & 2033
- Figure 28: Asia Pacific Distributed Renewable Energy Generation Technology Revenue (million), by Types 2025 & 2033
- Figure 29: Asia Pacific Distributed Renewable Energy Generation Technology Revenue Share (%), by Types 2025 & 2033
- Figure 30: Asia Pacific Distributed Renewable Energy Generation Technology Revenue (million), by Country 2025 & 2033
- Figure 31: Asia Pacific Distributed Renewable Energy Generation Technology Revenue Share (%), by Country 2025 & 2033
List of Tables
- Table 1: Global Distributed Renewable Energy Generation Technology Revenue million Forecast, by Application 2020 & 2033
- Table 2: Global Distributed Renewable Energy Generation Technology Revenue million Forecast, by Types 2020 & 2033
- Table 3: Global Distributed Renewable Energy Generation Technology Revenue million Forecast, by Region 2020 & 2033
- Table 4: Global Distributed Renewable Energy Generation Technology Revenue million Forecast, by Application 2020 & 2033
- Table 5: Global Distributed Renewable Energy Generation Technology Revenue million Forecast, by Types 2020 & 2033
- Table 6: Global Distributed Renewable Energy Generation Technology Revenue million Forecast, by Country 2020 & 2033
- Table 7: United States Distributed Renewable Energy Generation Technology Revenue (million) Forecast, by Application 2020 & 2033
- Table 8: Canada Distributed Renewable Energy Generation Technology Revenue (million) Forecast, by Application 2020 & 2033
- Table 9: Mexico Distributed Renewable Energy Generation Technology Revenue (million) Forecast, by Application 2020 & 2033
- Table 10: Global Distributed Renewable Energy Generation Technology Revenue million Forecast, by Application 2020 & 2033
- Table 11: Global Distributed Renewable Energy Generation Technology Revenue million Forecast, by Types 2020 & 2033
- Table 12: Global Distributed Renewable Energy Generation Technology Revenue million Forecast, by Country 2020 & 2033
- Table 13: Brazil Distributed Renewable Energy Generation Technology Revenue (million) Forecast, by Application 2020 & 2033
- Table 14: Argentina Distributed Renewable Energy Generation Technology Revenue (million) Forecast, by Application 2020 & 2033
- Table 15: Rest of South America Distributed Renewable Energy Generation Technology Revenue (million) Forecast, by Application 2020 & 2033
- Table 16: Global Distributed Renewable Energy Generation Technology Revenue million Forecast, by Application 2020 & 2033
- Table 17: Global Distributed Renewable Energy Generation Technology Revenue million Forecast, by Types 2020 & 2033
- Table 18: Global Distributed Renewable Energy Generation Technology Revenue million Forecast, by Country 2020 & 2033
- Table 19: United Kingdom Distributed Renewable Energy Generation Technology Revenue (million) Forecast, by Application 2020 & 2033
- Table 20: Germany Distributed Renewable Energy Generation Technology Revenue (million) Forecast, by Application 2020 & 2033
- Table 21: France Distributed Renewable Energy Generation Technology Revenue (million) Forecast, by Application 2020 & 2033
- Table 22: Italy Distributed Renewable Energy Generation Technology Revenue (million) Forecast, by Application 2020 & 2033
- Table 23: Spain Distributed Renewable Energy Generation Technology Revenue (million) Forecast, by Application 2020 & 2033
- Table 24: Russia Distributed Renewable Energy Generation Technology Revenue (million) Forecast, by Application 2020 & 2033
- Table 25: Benelux Distributed Renewable Energy Generation Technology Revenue (million) Forecast, by Application 2020 & 2033
- Table 26: Nordics Distributed Renewable Energy Generation Technology Revenue (million) Forecast, by Application 2020 & 2033
- Table 27: Rest of Europe Distributed Renewable Energy Generation Technology Revenue (million) Forecast, by Application 2020 & 2033
- Table 28: Global Distributed Renewable Energy Generation Technology Revenue million Forecast, by Application 2020 & 2033
- Table 29: Global Distributed Renewable Energy Generation Technology Revenue million Forecast, by Types 2020 & 2033
- Table 30: Global Distributed Renewable Energy Generation Technology Revenue million Forecast, by Country 2020 & 2033
- Table 31: Turkey Distributed Renewable Energy Generation Technology Revenue (million) Forecast, by Application 2020 & 2033
- Table 32: Israel Distributed Renewable Energy Generation Technology Revenue (million) Forecast, by Application 2020 & 2033
- Table 33: GCC Distributed Renewable Energy Generation Technology Revenue (million) Forecast, by Application 2020 & 2033
- Table 34: North Africa Distributed Renewable Energy Generation Technology Revenue (million) Forecast, by Application 2020 & 2033
- Table 35: South Africa Distributed Renewable Energy Generation Technology Revenue (million) Forecast, by Application 2020 & 2033
- Table 36: Rest of Middle East & Africa Distributed Renewable Energy Generation Technology Revenue (million) Forecast, by Application 2020 & 2033
- Table 37: Global Distributed Renewable Energy Generation Technology Revenue million Forecast, by Application 2020 & 2033
- Table 38: Global Distributed Renewable Energy Generation Technology Revenue million Forecast, by Types 2020 & 2033
- Table 39: Global Distributed Renewable Energy Generation Technology Revenue million Forecast, by Country 2020 & 2033
- Table 40: China Distributed Renewable Energy Generation Technology Revenue (million) Forecast, by Application 2020 & 2033
- Table 41: India Distributed Renewable Energy Generation Technology Revenue (million) Forecast, by Application 2020 & 2033
- Table 42: Japan Distributed Renewable Energy Generation Technology Revenue (million) Forecast, by Application 2020 & 2033
- Table 43: South Korea Distributed Renewable Energy Generation Technology Revenue (million) Forecast, by Application 2020 & 2033
- Table 44: ASEAN Distributed Renewable Energy Generation Technology Revenue (million) Forecast, by Application 2020 & 2033
- Table 45: Oceania Distributed Renewable Energy Generation Technology Revenue (million) Forecast, by Application 2020 & 2033
- Table 46: Rest of Asia Pacific Distributed Renewable Energy Generation Technology Revenue (million) Forecast, by Application 2020 & 2033
Frequently Asked Questions
1. What is the projected Compound Annual Growth Rate (CAGR) of the Distributed Renewable Energy Generation Technology?
The projected CAGR is approximately 8.9%.
2. Which companies are prominent players in the Distributed Renewable Energy Generation Technology?
Key companies in the market include AES Energy Storage, Alevo, GE, LG Chem, ZBB systems, A123 Systems, Active Power, Inc., Altair Nanotechnologies Inc, China Bak Battery Inc., Electrovaya Inc., Energizer Holdings Inc., Enersys, Exide Technologies, GS Yuasa Corporation, Hitachi, Maxwell Technologies Inc., Nippon Chemi-Con Corporation, SAFT, Samsung SDI Co. Ltd., The Furukawa Battery Co. Ltd, Kokam, Ecoult Energy Storage Solutions, Duke Energy, Alstom, Ballard Power Systems Inc., Calnetix Technologies, LLC, Canyon Hydro, Capstone Turbine Corporation, Doosan Fuel Cell America, Enercon.
3. What are the main segments of the Distributed Renewable Energy Generation Technology?
The market segments include Application, Types.
4. Can you provide details about the market size?
The market size is estimated to be USD 283580 million as of 2022.
5. What are some drivers contributing to market growth?
N/A
6. What are the notable trends driving market growth?
N/A
7. Are there any restraints impacting market growth?
N/A
8. Can you provide examples of recent developments in the market?
N/A
9. What pricing options are available for accessing the report?
Pricing options include single-user, multi-user, and enterprise licenses priced at USD 4900.00, USD 7350.00, and USD 9800.00 respectively.
10. Is the market size provided in terms of value or volume?
The market size is provided in terms of value, measured in million.
11. Are there any specific market keywords associated with the report?
Yes, the market keyword associated with the report is "Distributed Renewable Energy Generation Technology," which aids in identifying and referencing the specific market segment covered.
12. How do I determine which pricing option suits my needs best?
The pricing options vary based on user requirements and access needs. Individual users may opt for single-user licenses, while businesses requiring broader access may choose multi-user or enterprise licenses for cost-effective access to the report.
13. Are there any additional resources or data provided in the Distributed Renewable Energy Generation Technology report?
While the report offers comprehensive insights, it's advisable to review the specific contents or supplementary materials provided to ascertain if additional resources or data are available.
14. How can I stay updated on further developments or reports in the Distributed Renewable Energy Generation Technology?
To stay informed about further developments, trends, and reports in the Distributed Renewable Energy Generation Technology, consider subscribing to industry newsletters, following relevant companies and organizations, or regularly checking reputable industry news sources and publications.
Methodology
Step 1 - Identification of Relevant Samples Size from Population Database


Step 2 - Approaches for Defining Global Market Size (Value, Volume* & Price*)

Note*: In applicable scenarios
Step 3 - Data Sources
Primary Research
- Web Analytics
- Survey Reports
- Research Institute
- Latest Research Reports
- Opinion Leaders
Secondary Research
- Annual Reports
- White Paper
- Latest Press Release
- Industry Association
- Paid Database
- Investor Presentations

Step 4 - Data Triangulation
Involves using different sources of information in order to increase the validity of a study
These sources are likely to be stakeholders in a program - participants, other researchers, program staff, other community members, and so on.
Then we put all data in single framework & apply various statistical tools to find out the dynamic on the market.
During the analysis stage, feedback from the stakeholder groups would be compared to determine areas of agreement as well as areas of divergence