

Key Insights
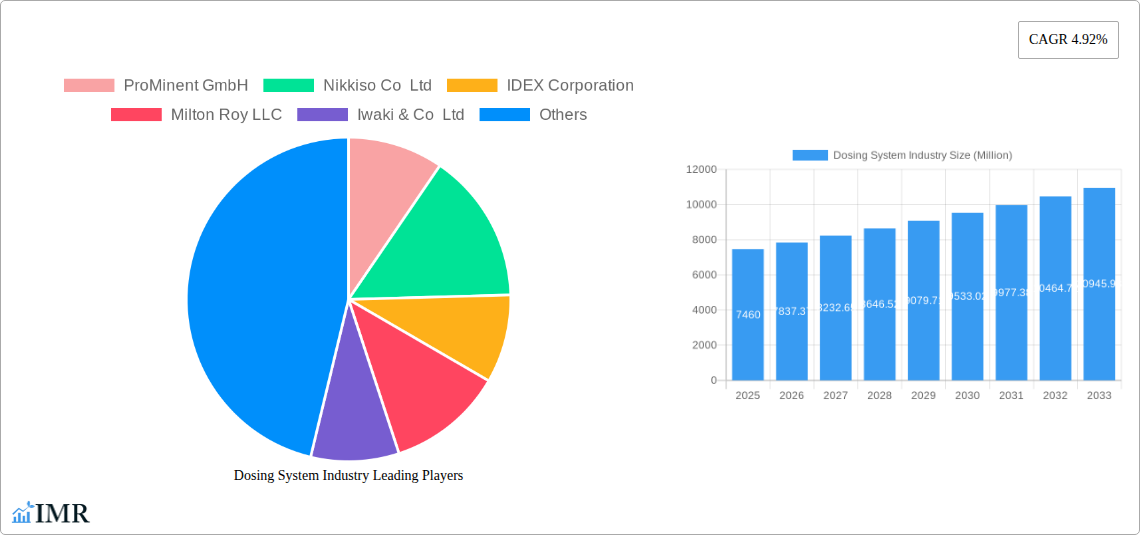
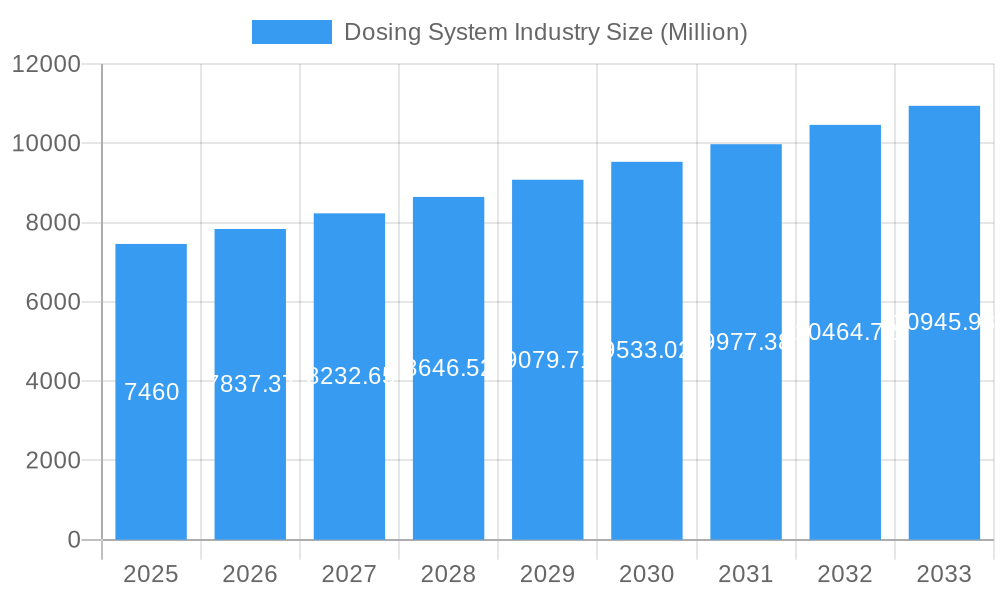
The global dosing system market, valued at $7.46 billion in 2025, is projected to experience robust growth, driven by increasing demand across various sectors. A compound annual growth rate (CAGR) of 4.92% from 2025 to 2033 indicates a significant expansion, primarily fueled by the burgeoning oil and gas industry, the ever-growing need for efficient water and sewage treatment solutions, and the expanding chemical manufacturing sector. Technological advancements in pump types, such as diaphragm and piston pumps, are further contributing to market expansion, offering improved accuracy, reliability, and efficiency in chemical metering and fluid handling. The rising adoption of automation and digitalization in industrial processes is also positively impacting the market, with smart dosing systems gaining traction due to their enhanced monitoring capabilities and predictive maintenance features. While regulatory compliance and environmental concerns present potential restraints, the overall market outlook remains optimistic due to the increasing focus on precision dosing in various applications, including pharmaceutical manufacturing, food processing, and power generation. Regional growth is expected to be diverse, with North America and Europe maintaining significant market share due to established industrial infrastructure and stringent environmental regulations. However, rapidly developing economies in Asia-Pacific are poised to witness faster growth rates, driven by industrialization and infrastructure development.
Dosing System Industry Market Size (In Billion)
The competitive landscape is characterized by a mix of established multinational corporations and specialized regional players. Key players like ProMinent GmbH, Nikkiso Co Ltd, and IDEX Corporation are strategically investing in research and development to enhance product offerings and expand their market presence. The market's future hinges on the continued adoption of advanced technologies, stringent environmental regulations, and sustained growth in end-use industries. Companies are focusing on developing innovative solutions that address evolving customer needs, such as customized dosing systems for specific applications, energy-efficient designs, and improved safety features. The market's segmented nature, encompassing various pump types and applications, offers significant opportunities for specialized players to cater to niche requirements. This specialization coupled with technological innovations will further propel the market's growth trajectory in the coming years.
Dosing System Industry Company Market Share
Dosing System Industry Market Report: 2019-2033
This comprehensive report provides an in-depth analysis of the global dosing system market, encompassing market dynamics, growth trends, regional analysis, product landscape, key players, and future outlook. The study period covers 2019-2033, with 2025 as the base year and forecast period extending to 2033. This report is crucial for industry professionals, investors, and strategic decision-makers seeking to understand and capitalize on opportunities within this dynamic market. The report segments the market by type (Diaphragm Pump, Piston Pump, Other Types) and application (Oil and Gas, Water and Sewage Treatment, Chemicals, Other Applications). The market size is valued in Million Units.
Dosing System Industry Market Dynamics & Structure
The global dosing system market is characterized by moderate concentration, with several key players holding significant market share. Technological innovation, driven by the need for improved efficiency, precision, and automation, is a major driver. Stringent regulatory frameworks concerning environmental protection and safety standards significantly influence market dynamics. Competitive pressures exist from substitute technologies and new entrants. End-user demographics, particularly within the water and wastewater treatment and chemical processing industries, are key determinants of market demand. M&A activity has been relatively consistent, with several strategic acquisitions aimed at expanding product portfolios and market reach.
- Market Concentration: Moderately concentrated, with the top 5 players holding approximately xx% market share in 2024 (estimated).
- Technological Innovation: Focus on IoT integration, advanced control systems, and energy-efficient designs.
- Regulatory Landscape: Stringent environmental regulations drive demand for precise and reliable dosing systems.
- Competitive Substitutes: Limited direct substitutes, but alternative methods for chemical handling pose indirect competition.
- M&A Activity: xx deals recorded between 2019-2024 (estimated), primarily focused on consolidation and technology acquisition.
- Innovation Barriers: High R&D costs and stringent safety certifications create barriers to entry.
Dosing System Industry Growth Trends & Insights
The global dosing system market experienced steady growth during the historical period (2019-2024), driven by increasing industrialization, stricter environmental regulations, and rising demand for precise chemical handling across various sectors. The market size in 2024 is estimated at xx Million Units, exhibiting a CAGR of xx% during this period. The forecast period (2025-2033) projects continued growth, fueled by technological advancements, expanding applications in emerging economies, and the increasing adoption of automated and digitally connected systems. Consumer behavior is shifting towards preference for reliable, efficient, and environmentally friendly solutions. Technological disruptions, such as the integration of IoT and AI, are expected to significantly shape market dynamics. Market penetration in developing countries remains relatively low, presenting significant opportunities for future growth.
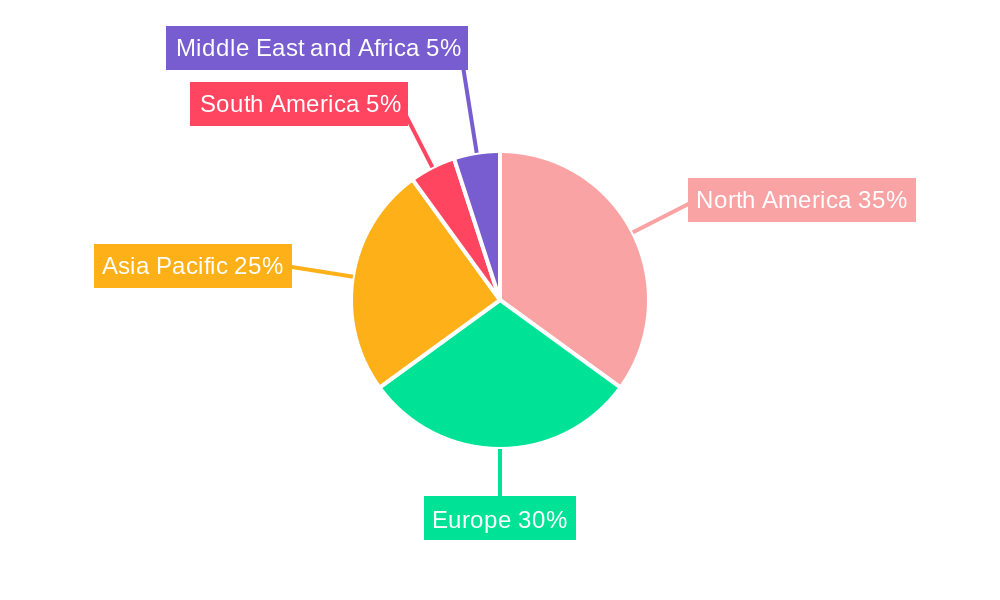
Dominant Regions, Countries, or Segments in Dosing System Industry
The North American region currently dominates the dosing system market, driven by robust industrial activity, stringent environmental regulations, and high investments in water and wastewater treatment infrastructure. Within application segments, water and sewage treatment holds the largest market share, followed by the chemicals industry. The diaphragm pump segment maintains a dominant position due to its versatility and cost-effectiveness. European markets exhibit significant growth potential due to ongoing investments in renewable energy and environmental protection initiatives. Asia-Pacific is experiencing rapid expansion fueled by industrial growth and urbanization in developing economies.
- Key Drivers: Stringent environmental regulations, robust infrastructure development, growing industrialization, and increasing adoption of advanced technologies.
- Dominant Regions: North America (leading market share), followed by Europe and Asia-Pacific.
- Dominant Segments: Water & Sewage Treatment (application) and Diaphragm Pumps (type).
- Growth Potential: Asia-Pacific presents the highest growth potential driven by industrialization and expanding infrastructure.
Dosing System Industry Product Landscape
The dosing system market offers a diverse range of products, including diaphragm pumps, piston pumps, and other specialized types. Recent innovations focus on improving precision, energy efficiency, and ease of operation. Smart dosing systems with integrated connectivity and advanced control features are gaining traction. Key selling propositions include ease of maintenance, enhanced safety features, and precise chemical delivery for various applications.
Key Drivers, Barriers & Challenges in Dosing System Industry
Key Drivers:
- Growing demand for precise chemical handling across industries.
- Stringent environmental regulations driving adoption of advanced systems.
- Technological advancements leading to improved efficiency and automation.
- Increased investments in water and wastewater treatment infrastructure.
Key Challenges and Restraints:
- High initial investment costs for advanced dosing systems.
- Dependence on global supply chains, susceptible to disruptions.
- Complex regulatory compliance requirements in specific regions.
- Intense competition from established players and new entrants. Estimated impact on market growth is xx% (predicted) by 2033 due to these challenges.
Emerging Opportunities in Dosing System Industry
- Untapped markets in developing economies present significant growth potential.
- Growing demand for customized dosing solutions for specific industrial processes.
- Integration of advanced technologies, such as AI and machine learning, for predictive maintenance and optimized performance.
- Development of sustainable and eco-friendly dosing systems to meet environmental concerns.
Growth Accelerators in the Dosing System Industry
Long-term growth will be fueled by technological breakthroughs in pump design, materials science, and control systems. Strategic partnerships between manufacturers and end-users to develop tailored solutions will be crucial. Expansion into new and emerging markets, particularly in developing economies, will play a vital role in driving market expansion.
Key Players Shaping the Dosing System Industry Market
- ProMinent GmbH
- Nikkiso Co Ltd
- IDEX Corporation
- Milton Roy LLC
- Iwaki & Co Ltd
- Grundfos Holding AS
- Dover Corporation
- SPX Flow Inc
- Verder Ltd
- Watson-Marlow Fluid Technology Group
Notable Milestones in Dosing System Industry Sector
- April 2022: SEKO upgrades its WareDose warewash dosing pump systems with integrated Wi-Fi for 24/7 remote monitoring.
- September 2022: Verder Liquids launches the Verderflex Ds500 metering and dosing pump for municipal and industrial applications.
In-Depth Dosing System Industry Market Outlook
The future of the dosing system market is bright, driven by continued technological advancements, expanding applications, and the increasing adoption of smart and sustainable solutions. Strategic partnerships, investments in R&D, and expansion into new markets will be crucial for success. The market is expected to witness substantial growth over the forecast period, presenting significant opportunities for both established players and new entrants. The growing focus on automation, digitalization, and sustainability will further shape market dynamics in the coming years.
Dosing System Industry Segmentation
-
1. Type
- 1.1. Diaphragm Pump
- 1.2. Piston Pump
- 1.3. Other Types
-
2. Application
- 2.1. Oil and Gas
- 2.2. Water and Sewage Treatment
- 2.3. Chemicals
- 2.4. Other Applications
Dosing System Industry Segmentation By Geography
-
1. North America
- 1.1. United States
- 1.2. Canada
- 1.3. Rest of North America
-
2. Europe
- 2.1. Germany
- 2.2. United Kingdom
- 2.3. France
- 2.4. Spain
- 2.5. Italy
- 2.6. Rest of Europe
-
3. Asia Pacific
- 3.1. China
- 3.2. India
- 3.3. Japan
- 3.4. South Korea
- 3.5. Rest of Asia Pacific
-
4. South America
- 4.1. Brazil
- 4.2. Argentina
- 4.3. Rest of South America
-
5. Middle East and Africa
- 5.1. Saudi Arabia
- 5.2. United Arab Emirates
- 5.3. South Africa
- 5.4. Rest of Middle East and Africa
Dosing System Industry Regional Market Share
Geographic Coverage of Dosing System Industry
Dosing System Industry REPORT HIGHLIGHTS
| Aspects | Details |
|---|---|
| Study Period | 2020-2034 |
| Base Year | 2025 |
| Estimated Year | 2026 |
| Forecast Period | 2026-2034 |
| Historical Period | 2020-2025 |
| Growth Rate | CAGR of 4.92% from 2020-2034 |
| Segmentation |
|
Table of Contents
- 1. Introduction
- 1.1. Research Scope
- 1.2. Market Segmentation
- 1.3. Research Objective
- 1.4. Definitions and Assumptions
- 2. Executive Summary
- 2.1. Market Snapshot
- 3. Market Dynamics
- 3.1. Market Drivers
- 3.2. Market Restrains
- 3.3. Market Trends
- 3.4. Market Opportunities
- 4. Market Factor Analysis
- 4.1. Porters Five Forces
- 4.1.1. Bargaining Power of Suppliers
- 4.1.2. Bargaining Power of Buyers
- 4.1.3. Threat of New Entrants
- 4.1.4. Threat of Substitutes
- 4.1.5. Competitive Rivalry
- 4.2. PESTEL analysis
- 4.3. BCG Analysis
- 4.3.1. Stars (High Growth, High Market Share)
- 4.3.2. Cash Cows (Low Growth, High Market Share)
- 4.3.3. Question Mark (High Growth, Low Market Share)
- 4.3.4. Dogs (Low Growth, Low Market Share)
- 4.4. Ansoff Matrix Analysis
- 4.5. Supply Chain Analysis
- 4.6. Regulatory Landscape
- 4.7. Current Market Potential and Opportunity Assessment (TAM–SAM–SOM Framework)
- 4.8. IMR Analyst Note
- 4.1. Porters Five Forces
- 5. Market Analysis, Insights and Forecast 2021-2033
- 5.1. Market Analysis, Insights and Forecast - by Type
- 5.1.1. Diaphragm Pump
- 5.1.2. Piston Pump
- 5.1.3. Other Types
- 5.2. Market Analysis, Insights and Forecast - by Application
- 5.2.1. Oil and Gas
- 5.2.2. Water and Sewage Treatment
- 5.2.3. Chemicals
- 5.2.4. Other Applications
- 5.3. Market Analysis, Insights and Forecast - by Region
- 5.3.1. North America
- 5.3.2. Europe
- 5.3.3. Asia Pacific
- 5.3.4. South America
- 5.3.5. Middle East and Africa
- 5.1. Market Analysis, Insights and Forecast - by Type
- 6. Global Dosing System Industry Analysis, Insights and Forecast, 2021-2033
- 6.1. Market Analysis, Insights and Forecast - by Type
- 6.1.1. Diaphragm Pump
- 6.1.2. Piston Pump
- 6.1.3. Other Types
- 6.2. Market Analysis, Insights and Forecast - by Application
- 6.2.1. Oil and Gas
- 6.2.2. Water and Sewage Treatment
- 6.2.3. Chemicals
- 6.2.4. Other Applications
- 6.1. Market Analysis, Insights and Forecast - by Type
- 7. North America Dosing System Industry Analysis, Insights and Forecast, 2020-2032
- 7.1. Market Analysis, Insights and Forecast - by Type
- 7.1.1. Diaphragm Pump
- 7.1.2. Piston Pump
- 7.1.3. Other Types
- 7.2. Market Analysis, Insights and Forecast - by Application
- 7.2.1. Oil and Gas
- 7.2.2. Water and Sewage Treatment
- 7.2.3. Chemicals
- 7.2.4. Other Applications
- 7.1. Market Analysis, Insights and Forecast - by Type
- 8. Europe Dosing System Industry Analysis, Insights and Forecast, 2020-2032
- 8.1. Market Analysis, Insights and Forecast - by Type
- 8.1.1. Diaphragm Pump
- 8.1.2. Piston Pump
- 8.1.3. Other Types
- 8.2. Market Analysis, Insights and Forecast - by Application
- 8.2.1. Oil and Gas
- 8.2.2. Water and Sewage Treatment
- 8.2.3. Chemicals
- 8.2.4. Other Applications
- 8.1. Market Analysis, Insights and Forecast - by Type
- 9. Asia Pacific Dosing System Industry Analysis, Insights and Forecast, 2020-2032
- 9.1. Market Analysis, Insights and Forecast - by Type
- 9.1.1. Diaphragm Pump
- 9.1.2. Piston Pump
- 9.1.3. Other Types
- 9.2. Market Analysis, Insights and Forecast - by Application
- 9.2.1. Oil and Gas
- 9.2.2. Water and Sewage Treatment
- 9.2.3. Chemicals
- 9.2.4. Other Applications
- 9.1. Market Analysis, Insights and Forecast - by Type
- 10. South America Dosing System Industry Analysis, Insights and Forecast, 2020-2032
- 10.1. Market Analysis, Insights and Forecast - by Type
- 10.1.1. Diaphragm Pump
- 10.1.2. Piston Pump
- 10.1.3. Other Types
- 10.2. Market Analysis, Insights and Forecast - by Application
- 10.2.1. Oil and Gas
- 10.2.2. Water and Sewage Treatment
- 10.2.3. Chemicals
- 10.2.4. Other Applications
- 10.1. Market Analysis, Insights and Forecast - by Type
- 11. Middle East and Africa Dosing System Industry Analysis, Insights and Forecast, 2020-2032
- 11.1. Market Analysis, Insights and Forecast - by Type
- 11.1.1. Diaphragm Pump
- 11.1.2. Piston Pump
- 11.1.3. Other Types
- 11.2. Market Analysis, Insights and Forecast - by Application
- 11.2.1. Oil and Gas
- 11.2.2. Water and Sewage Treatment
- 11.2.3. Chemicals
- 11.2.4. Other Applications
- 11.1. Market Analysis, Insights and Forecast - by Type
- 12. Competitive Analysis
- 12.1. Company Profiles
- 12.1.1 ProMinent GmbH
- 12.1.1.1. Company Overview
- 12.1.1.2. Products
- 12.1.1.3. Company Financials
- 12.1.1.4. SWOT Analysis
- 12.1.2 Nikkiso Co Ltd
- 12.1.2.1. Company Overview
- 12.1.2.2. Products
- 12.1.2.3. Company Financials
- 12.1.2.4. SWOT Analysis
- 12.1.3 IDEX Corporation
- 12.1.3.1. Company Overview
- 12.1.3.2. Products
- 12.1.3.3. Company Financials
- 12.1.3.4. SWOT Analysis
- 12.1.4 Milton Roy LLC
- 12.1.4.1. Company Overview
- 12.1.4.2. Products
- 12.1.4.3. Company Financials
- 12.1.4.4. SWOT Analysis
- 12.1.5 Iwaki & Co Ltd
- 12.1.5.1. Company Overview
- 12.1.5.2. Products
- 12.1.5.3. Company Financials
- 12.1.5.4. SWOT Analysis
- 12.1.6 Grundfos Holding AS
- 12.1.6.1. Company Overview
- 12.1.6.2. Products
- 12.1.6.3. Company Financials
- 12.1.6.4. SWOT Analysis
- 12.1.7 Dover Corporation
- 12.1.7.1. Company Overview
- 12.1.7.2. Products
- 12.1.7.3. Company Financials
- 12.1.7.4. SWOT Analysis
- 12.1.8 SPX Flow Inc
- 12.1.8.1. Company Overview
- 12.1.8.2. Products
- 12.1.8.3. Company Financials
- 12.1.8.4. SWOT Analysis
- 12.1.9 Verder Ltd*List Not Exhaustive
- 12.1.9.1. Company Overview
- 12.1.9.2. Products
- 12.1.9.3. Company Financials
- 12.1.9.4. SWOT Analysis
- 12.1.10 Watson-Marlow Fluid Technology Group
- 12.1.10.1. Company Overview
- 12.1.10.2. Products
- 12.1.10.3. Company Financials
- 12.1.10.4. SWOT Analysis
- 12.1.1 ProMinent GmbH
- 12.2. Market Entropy
- 12.2.1 Company's Key Areas Served
- 12.2.2 Recent Developments
- 12.3. Company Market Share Analysis 2025
- 12.3.1 Top 5 Companies Market Share Analysis
- 12.3.2 Top 3 Companies Market Share Analysis
- 12.4. List of Potential Customers
- 13. Research Methodology
List of Figures
- Figure 1: Global Dosing System Industry Revenue Breakdown (Million, %) by Region 2025 & 2033
- Figure 2: Global Dosing System Industry Volume Breakdown (K Tons, %) by Region 2025 & 2033
- Figure 3: North America Dosing System Industry Revenue (Million), by Type 2025 & 2033
- Figure 4: North America Dosing System Industry Volume (K Tons), by Type 2025 & 2033
- Figure 5: North America Dosing System Industry Revenue Share (%), by Type 2025 & 2033
- Figure 6: North America Dosing System Industry Volume Share (%), by Type 2025 & 2033
- Figure 7: North America Dosing System Industry Revenue (Million), by Application 2025 & 2033
- Figure 8: North America Dosing System Industry Volume (K Tons), by Application 2025 & 2033
- Figure 9: North America Dosing System Industry Revenue Share (%), by Application 2025 & 2033
- Figure 10: North America Dosing System Industry Volume Share (%), by Application 2025 & 2033
- Figure 11: North America Dosing System Industry Revenue (Million), by Country 2025 & 2033
- Figure 12: North America Dosing System Industry Volume (K Tons), by Country 2025 & 2033
- Figure 13: North America Dosing System Industry Revenue Share (%), by Country 2025 & 2033
- Figure 14: North America Dosing System Industry Volume Share (%), by Country 2025 & 2033
- Figure 15: Europe Dosing System Industry Revenue (Million), by Type 2025 & 2033
- Figure 16: Europe Dosing System Industry Volume (K Tons), by Type 2025 & 2033
- Figure 17: Europe Dosing System Industry Revenue Share (%), by Type 2025 & 2033
- Figure 18: Europe Dosing System Industry Volume Share (%), by Type 2025 & 2033
- Figure 19: Europe Dosing System Industry Revenue (Million), by Application 2025 & 2033
- Figure 20: Europe Dosing System Industry Volume (K Tons), by Application 2025 & 2033
- Figure 21: Europe Dosing System Industry Revenue Share (%), by Application 2025 & 2033
- Figure 22: Europe Dosing System Industry Volume Share (%), by Application 2025 & 2033
- Figure 23: Europe Dosing System Industry Revenue (Million), by Country 2025 & 2033
- Figure 24: Europe Dosing System Industry Volume (K Tons), by Country 2025 & 2033
- Figure 25: Europe Dosing System Industry Revenue Share (%), by Country 2025 & 2033
- Figure 26: Europe Dosing System Industry Volume Share (%), by Country 2025 & 2033
- Figure 27: Asia Pacific Dosing System Industry Revenue (Million), by Type 2025 & 2033
- Figure 28: Asia Pacific Dosing System Industry Volume (K Tons), by Type 2025 & 2033
- Figure 29: Asia Pacific Dosing System Industry Revenue Share (%), by Type 2025 & 2033
- Figure 30: Asia Pacific Dosing System Industry Volume Share (%), by Type 2025 & 2033
- Figure 31: Asia Pacific Dosing System Industry Revenue (Million), by Application 2025 & 2033
- Figure 32: Asia Pacific Dosing System Industry Volume (K Tons), by Application 2025 & 2033
- Figure 33: Asia Pacific Dosing System Industry Revenue Share (%), by Application 2025 & 2033
- Figure 34: Asia Pacific Dosing System Industry Volume Share (%), by Application 2025 & 2033
- Figure 35: Asia Pacific Dosing System Industry Revenue (Million), by Country 2025 & 2033
- Figure 36: Asia Pacific Dosing System Industry Volume (K Tons), by Country 2025 & 2033
- Figure 37: Asia Pacific Dosing System Industry Revenue Share (%), by Country 2025 & 2033
- Figure 38: Asia Pacific Dosing System Industry Volume Share (%), by Country 2025 & 2033
- Figure 39: South America Dosing System Industry Revenue (Million), by Type 2025 & 2033
- Figure 40: South America Dosing System Industry Volume (K Tons), by Type 2025 & 2033
- Figure 41: South America Dosing System Industry Revenue Share (%), by Type 2025 & 2033
- Figure 42: South America Dosing System Industry Volume Share (%), by Type 2025 & 2033
- Figure 43: South America Dosing System Industry Revenue (Million), by Application 2025 & 2033
- Figure 44: South America Dosing System Industry Volume (K Tons), by Application 2025 & 2033
- Figure 45: South America Dosing System Industry Revenue Share (%), by Application 2025 & 2033
- Figure 46: South America Dosing System Industry Volume Share (%), by Application 2025 & 2033
- Figure 47: South America Dosing System Industry Revenue (Million), by Country 2025 & 2033
- Figure 48: South America Dosing System Industry Volume (K Tons), by Country 2025 & 2033
- Figure 49: South America Dosing System Industry Revenue Share (%), by Country 2025 & 2033
- Figure 50: South America Dosing System Industry Volume Share (%), by Country 2025 & 2033
- Figure 51: Middle East and Africa Dosing System Industry Revenue (Million), by Type 2025 & 2033
- Figure 52: Middle East and Africa Dosing System Industry Volume (K Tons), by Type 2025 & 2033
- Figure 53: Middle East and Africa Dosing System Industry Revenue Share (%), by Type 2025 & 2033
- Figure 54: Middle East and Africa Dosing System Industry Volume Share (%), by Type 2025 & 2033
- Figure 55: Middle East and Africa Dosing System Industry Revenue (Million), by Application 2025 & 2033
- Figure 56: Middle East and Africa Dosing System Industry Volume (K Tons), by Application 2025 & 2033
- Figure 57: Middle East and Africa Dosing System Industry Revenue Share (%), by Application 2025 & 2033
- Figure 58: Middle East and Africa Dosing System Industry Volume Share (%), by Application 2025 & 2033
- Figure 59: Middle East and Africa Dosing System Industry Revenue (Million), by Country 2025 & 2033
- Figure 60: Middle East and Africa Dosing System Industry Volume (K Tons), by Country 2025 & 2033
- Figure 61: Middle East and Africa Dosing System Industry Revenue Share (%), by Country 2025 & 2033
- Figure 62: Middle East and Africa Dosing System Industry Volume Share (%), by Country 2025 & 2033
List of Tables
- Table 1: Global Dosing System Industry Revenue Million Forecast, by Type 2020 & 2033
- Table 2: Global Dosing System Industry Volume K Tons Forecast, by Type 2020 & 2033
- Table 3: Global Dosing System Industry Revenue Million Forecast, by Application 2020 & 2033
- Table 4: Global Dosing System Industry Volume K Tons Forecast, by Application 2020 & 2033
- Table 5: Global Dosing System Industry Revenue Million Forecast, by Region 2020 & 2033
- Table 6: Global Dosing System Industry Volume K Tons Forecast, by Region 2020 & 2033
- Table 7: Global Dosing System Industry Revenue Million Forecast, by Type 2020 & 2033
- Table 8: Global Dosing System Industry Volume K Tons Forecast, by Type 2020 & 2033
- Table 9: Global Dosing System Industry Revenue Million Forecast, by Application 2020 & 2033
- Table 10: Global Dosing System Industry Volume K Tons Forecast, by Application 2020 & 2033
- Table 11: Global Dosing System Industry Revenue Million Forecast, by Country 2020 & 2033
- Table 12: Global Dosing System Industry Volume K Tons Forecast, by Country 2020 & 2033
- Table 13: United States Dosing System Industry Revenue (Million) Forecast, by Application 2020 & 2033
- Table 14: United States Dosing System Industry Volume (K Tons) Forecast, by Application 2020 & 2033
- Table 15: Canada Dosing System Industry Revenue (Million) Forecast, by Application 2020 & 2033
- Table 16: Canada Dosing System Industry Volume (K Tons) Forecast, by Application 2020 & 2033
- Table 17: Rest of North America Dosing System Industry Revenue (Million) Forecast, by Application 2020 & 2033
- Table 18: Rest of North America Dosing System Industry Volume (K Tons) Forecast, by Application 2020 & 2033
- Table 19: Global Dosing System Industry Revenue Million Forecast, by Type 2020 & 2033
- Table 20: Global Dosing System Industry Volume K Tons Forecast, by Type 2020 & 2033
- Table 21: Global Dosing System Industry Revenue Million Forecast, by Application 2020 & 2033
- Table 22: Global Dosing System Industry Volume K Tons Forecast, by Application 2020 & 2033
- Table 23: Global Dosing System Industry Revenue Million Forecast, by Country 2020 & 2033
- Table 24: Global Dosing System Industry Volume K Tons Forecast, by Country 2020 & 2033
- Table 25: Germany Dosing System Industry Revenue (Million) Forecast, by Application 2020 & 2033
- Table 26: Germany Dosing System Industry Volume (K Tons) Forecast, by Application 2020 & 2033
- Table 27: United Kingdom Dosing System Industry Revenue (Million) Forecast, by Application 2020 & 2033
- Table 28: United Kingdom Dosing System Industry Volume (K Tons) Forecast, by Application 2020 & 2033
- Table 29: France Dosing System Industry Revenue (Million) Forecast, by Application 2020 & 2033
- Table 30: France Dosing System Industry Volume (K Tons) Forecast, by Application 2020 & 2033
- Table 31: Spain Dosing System Industry Revenue (Million) Forecast, by Application 2020 & 2033
- Table 32: Spain Dosing System Industry Volume (K Tons) Forecast, by Application 2020 & 2033
- Table 33: Italy Dosing System Industry Revenue (Million) Forecast, by Application 2020 & 2033
- Table 34: Italy Dosing System Industry Volume (K Tons) Forecast, by Application 2020 & 2033
- Table 35: Rest of Europe Dosing System Industry Revenue (Million) Forecast, by Application 2020 & 2033
- Table 36: Rest of Europe Dosing System Industry Volume (K Tons) Forecast, by Application 2020 & 2033
- Table 37: Global Dosing System Industry Revenue Million Forecast, by Type 2020 & 2033
- Table 38: Global Dosing System Industry Volume K Tons Forecast, by Type 2020 & 2033
- Table 39: Global Dosing System Industry Revenue Million Forecast, by Application 2020 & 2033
- Table 40: Global Dosing System Industry Volume K Tons Forecast, by Application 2020 & 2033
- Table 41: Global Dosing System Industry Revenue Million Forecast, by Country 2020 & 2033
- Table 42: Global Dosing System Industry Volume K Tons Forecast, by Country 2020 & 2033
- Table 43: China Dosing System Industry Revenue (Million) Forecast, by Application 2020 & 2033
- Table 44: China Dosing System Industry Volume (K Tons) Forecast, by Application 2020 & 2033
- Table 45: India Dosing System Industry Revenue (Million) Forecast, by Application 2020 & 2033
- Table 46: India Dosing System Industry Volume (K Tons) Forecast, by Application 2020 & 2033
- Table 47: Japan Dosing System Industry Revenue (Million) Forecast, by Application 2020 & 2033
- Table 48: Japan Dosing System Industry Volume (K Tons) Forecast, by Application 2020 & 2033
- Table 49: South Korea Dosing System Industry Revenue (Million) Forecast, by Application 2020 & 2033
- Table 50: South Korea Dosing System Industry Volume (K Tons) Forecast, by Application 2020 & 2033
- Table 51: Rest of Asia Pacific Dosing System Industry Revenue (Million) Forecast, by Application 2020 & 2033
- Table 52: Rest of Asia Pacific Dosing System Industry Volume (K Tons) Forecast, by Application 2020 & 2033
- Table 53: Global Dosing System Industry Revenue Million Forecast, by Type 2020 & 2033
- Table 54: Global Dosing System Industry Volume K Tons Forecast, by Type 2020 & 2033
- Table 55: Global Dosing System Industry Revenue Million Forecast, by Application 2020 & 2033
- Table 56: Global Dosing System Industry Volume K Tons Forecast, by Application 2020 & 2033
- Table 57: Global Dosing System Industry Revenue Million Forecast, by Country 2020 & 2033
- Table 58: Global Dosing System Industry Volume K Tons Forecast, by Country 2020 & 2033
- Table 59: Brazil Dosing System Industry Revenue (Million) Forecast, by Application 2020 & 2033
- Table 60: Brazil Dosing System Industry Volume (K Tons) Forecast, by Application 2020 & 2033
- Table 61: Argentina Dosing System Industry Revenue (Million) Forecast, by Application 2020 & 2033
- Table 62: Argentina Dosing System Industry Volume (K Tons) Forecast, by Application 2020 & 2033
- Table 63: Rest of South America Dosing System Industry Revenue (Million) Forecast, by Application 2020 & 2033
- Table 64: Rest of South America Dosing System Industry Volume (K Tons) Forecast, by Application 2020 & 2033
- Table 65: Global Dosing System Industry Revenue Million Forecast, by Type 2020 & 2033
- Table 66: Global Dosing System Industry Volume K Tons Forecast, by Type 2020 & 2033
- Table 67: Global Dosing System Industry Revenue Million Forecast, by Application 2020 & 2033
- Table 68: Global Dosing System Industry Volume K Tons Forecast, by Application 2020 & 2033
- Table 69: Global Dosing System Industry Revenue Million Forecast, by Country 2020 & 2033
- Table 70: Global Dosing System Industry Volume K Tons Forecast, by Country 2020 & 2033
- Table 71: Saudi Arabia Dosing System Industry Revenue (Million) Forecast, by Application 2020 & 2033
- Table 72: Saudi Arabia Dosing System Industry Volume (K Tons) Forecast, by Application 2020 & 2033
- Table 73: United Arab Emirates Dosing System Industry Revenue (Million) Forecast, by Application 2020 & 2033
- Table 74: United Arab Emirates Dosing System Industry Volume (K Tons) Forecast, by Application 2020 & 2033
- Table 75: South Africa Dosing System Industry Revenue (Million) Forecast, by Application 2020 & 2033
- Table 76: South Africa Dosing System Industry Volume (K Tons) Forecast, by Application 2020 & 2033
- Table 77: Rest of Middle East and Africa Dosing System Industry Revenue (Million) Forecast, by Application 2020 & 2033
- Table 78: Rest of Middle East and Africa Dosing System Industry Volume (K Tons) Forecast, by Application 2020 & 2033
Frequently Asked Questions
1. What is the projected Compound Annual Growth Rate (CAGR) of the Dosing System Industry?
The projected CAGR is approximately 4.92%.
2. Which companies are prominent players in the Dosing System Industry?
Key companies in the market include ProMinent GmbH, Nikkiso Co Ltd, IDEX Corporation, Milton Roy LLC, Iwaki & Co Ltd, Grundfos Holding AS, Dover Corporation, SPX Flow Inc, Verder Ltd*List Not Exhaustive, Watson-Marlow Fluid Technology Group.
3. What are the main segments of the Dosing System Industry?
The market segments include Type, Application.
4. Can you provide details about the market size?
The market size is estimated to be USD 7460 Million as of 2022.
5. What are some drivers contributing to market growth?
4.; Increasing Investments in Water Treatment by Developing Countries4.; Growing Demand for the Various End-Use Sectors.
6. What are the notable trends driving market growth?
Water and Sewage Treatment Sector to Dominate the Market.
7. Are there any restraints impacting market growth?
4.; Availability of Cheap and Alternative Pumps.
8. Can you provide examples of recent developments in the market?
Apr 2022: SEKO, manufacturer of chemical dosing pumps and metering, announced the upgradation of its WareDose warewash dosing pump systems to include an integrated Wi-Fi hub, enabling operators to connect to their systems 24/7 via smartphone.
9. What pricing options are available for accessing the report?
Pricing options include single-user, multi-user, and enterprise licenses priced at USD 4750, USD 5250, and USD 8750 respectively.
10. Is the market size provided in terms of value or volume?
The market size is provided in terms of value, measured in Million and volume, measured in K Tons.
11. Are there any specific market keywords associated with the report?
Yes, the market keyword associated with the report is "Dosing System Industry," which aids in identifying and referencing the specific market segment covered.
12. How do I determine which pricing option suits my needs best?
The pricing options vary based on user requirements and access needs. Individual users may opt for single-user licenses, while businesses requiring broader access may choose multi-user or enterprise licenses for cost-effective access to the report.
13. Are there any additional resources or data provided in the Dosing System Industry report?
While the report offers comprehensive insights, it's advisable to review the specific contents or supplementary materials provided to ascertain if additional resources or data are available.
14. How can I stay updated on further developments or reports in the Dosing System Industry?
To stay informed about further developments, trends, and reports in the Dosing System Industry, consider subscribing to industry newsletters, following relevant companies and organizations, or regularly checking reputable industry news sources and publications.
Methodology
Step 1 - Identification of Relevant Samples Size from Population Database


Step 2 - Approaches for Defining Global Market Size (Value, Volume* & Price*)

Note*: In applicable scenarios
Step 3 - Data Sources
Primary Research
- Web Analytics
- Survey Reports
- Research Institute
- Latest Research Reports
- Opinion Leaders
Secondary Research
- Annual Reports
- White Paper
- Latest Press Release
- Industry Association
- Paid Database
- Investor Presentations

Step 4 - Data Triangulation
Involves using different sources of information in order to increase the validity of a study
These sources are likely to be stakeholders in a program - participants, other researchers, program staff, other community members, and so on.
Then we put all data in single framework & apply various statistical tools to find out the dynamic on the market.
During the analysis stage, feedback from the stakeholder groups would be compared to determine areas of agreement as well as areas of divergence