

Key Insights
The global dry rosé wine market is experiencing robust growth, driven by increasing consumer preference for lighter, refreshing wines, particularly among millennials and Gen Z. This preference is fueled by the perception of rosé as a versatile beverage suitable for various occasions, from casual gatherings to upscale dining. The market's expansion is further bolstered by innovative product development, including the introduction of high-quality, premium rosé wines from diverse regions, and creative marketing strategies that emphasize the wine's sophisticated image. While traditional rosé-producing regions like Provence maintain strong market positions, emerging regions are also contributing significantly to the overall growth. The increasing availability of rosé wines in various formats, such as cans and smaller bottles, caters to evolving consumer lifestyles and preferences for convenience and portability.
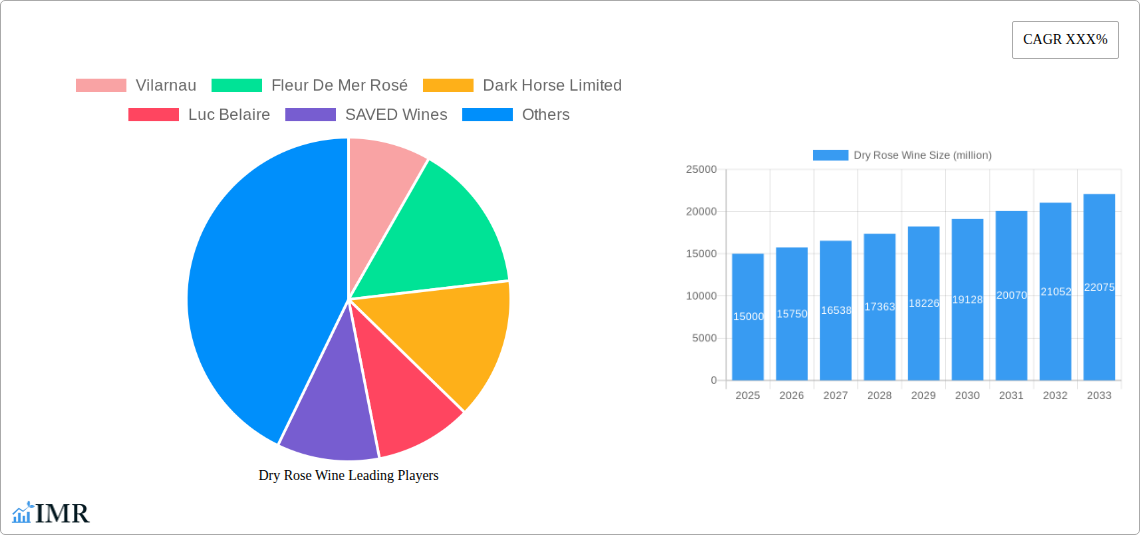
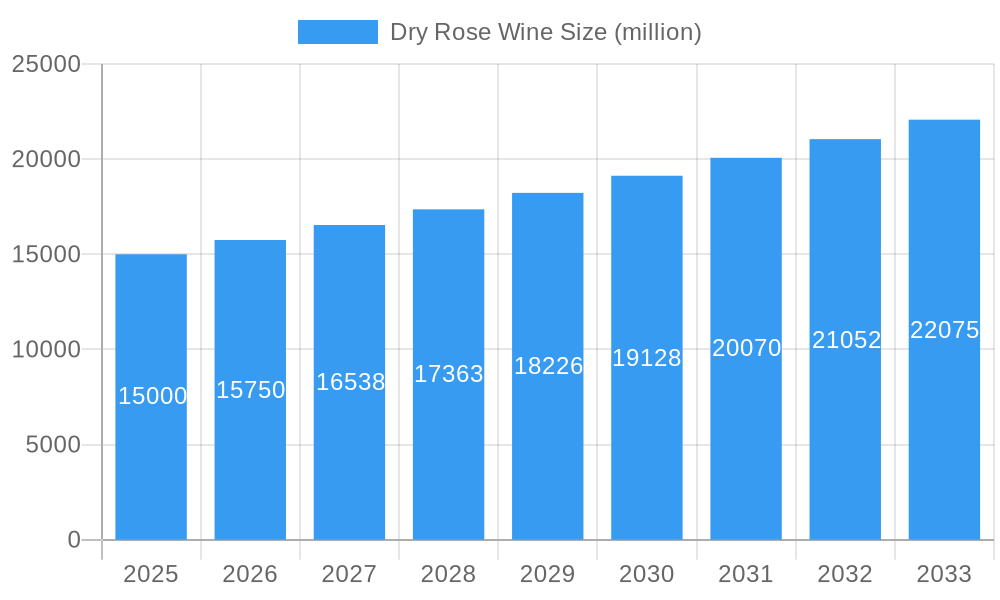
Dry Rose Wine Market Size (In Billion)
Despite the positive growth trajectory, the market faces certain challenges. Fluctuations in grape yields due to climate change and unpredictable weather patterns pose a risk to supply chain stability and pricing. Furthermore, intense competition among established and emerging brands necessitates ongoing innovation and marketing efforts to maintain market share. The rise of alternative alcoholic beverages also presents a competitive threat, requiring producers to actively communicate the unique qualities and appeal of dry rosé wine to maintain consumer loyalty. However, the overall market outlook remains positive, with projections indicating sustained growth fueled by increasing demand and expanding consumer base over the forecast period. We estimate the market size in 2025 to be $15 billion, growing at a CAGR of 5% to reach $22 billion by 2033. This growth is primarily attributed to the aforementioned drivers and increasing global wine consumption.
Dry Rose Wine Company Market Share
Dry Rosé Wine Market Report: 2019-2033 – A Comprehensive Analysis
This comprehensive report provides an in-depth analysis of the global dry rosé wine market, covering the period from 2019 to 2033. It meticulously examines market dynamics, growth trends, regional dominance, product innovation, key players, and future outlook, providing invaluable insights for industry professionals, investors, and strategic decision-makers. The report leverages extensive data analysis to forecast market size, penetration rates, and CAGR, offering a precise view of this dynamic sector. The report covers both parent (wine) and child (dry rosé) markets.
Dry Rosé Wine Market Dynamics & Structure
The global dry rosé wine market is characterized by moderate concentration, with several key players vying for market share. Technological innovation, driven by improved grape cultivation and winemaking techniques, is a significant driver. Regulatory frameworks concerning alcohol production and labeling vary across regions, impacting market access and competitiveness. The market faces competition from other alcoholic beverages, particularly white and red wines, and ready-to-drink cocktails. End-user demographics show a strong preference amongst millennials and Gen Z, fueling market expansion. M&A activity in the sector has been relatively stable in recent years, with xx million units in deals recorded between 2019 and 2024.
- Market Concentration: Moderately concentrated, with top 5 players holding approximately xx% market share in 2025.
- Technological Innovation: Focus on sustainable viticulture, precision fermentation, and improved packaging.
- Regulatory Landscape: Varied across regions, impacting pricing and distribution.
- Competitive Substitutes: White wines, red wines, sparkling wines, and ready-to-drink beverages.
- End-User Demographics: Millennials and Gen Z are key consumer segments.
- M&A Activity: xx million units in deals between 2019-2024, indicating consolidation trends.
Dry Rosé Wine Growth Trends & Insights
The global dry rosé wine market has witnessed consistent growth during the historical period (2019-2024), driven by changing consumer preferences and increasing demand. The market size, valued at xx million units in 2025, is projected to reach xx million units by 2033, exhibiting a CAGR of xx% during the forecast period (2025-2033). This growth is primarily fueled by the rising popularity of rosé wines among younger demographics, increased disposable incomes, and innovative marketing strategies adopted by key players. Technological disruptions, particularly in sustainable viticulture and winemaking, are also contributing to this expansion.
Increased adoption rates, especially in regions with established wine cultures and emerging markets, are driving market penetration. Consumer behavior shifts towards healthier lifestyle choices and premiumization have also boosted demand for higher-quality rosé wines. The market experienced a slight dip in 202x due to xx, but quickly recovered demonstrating resilience.
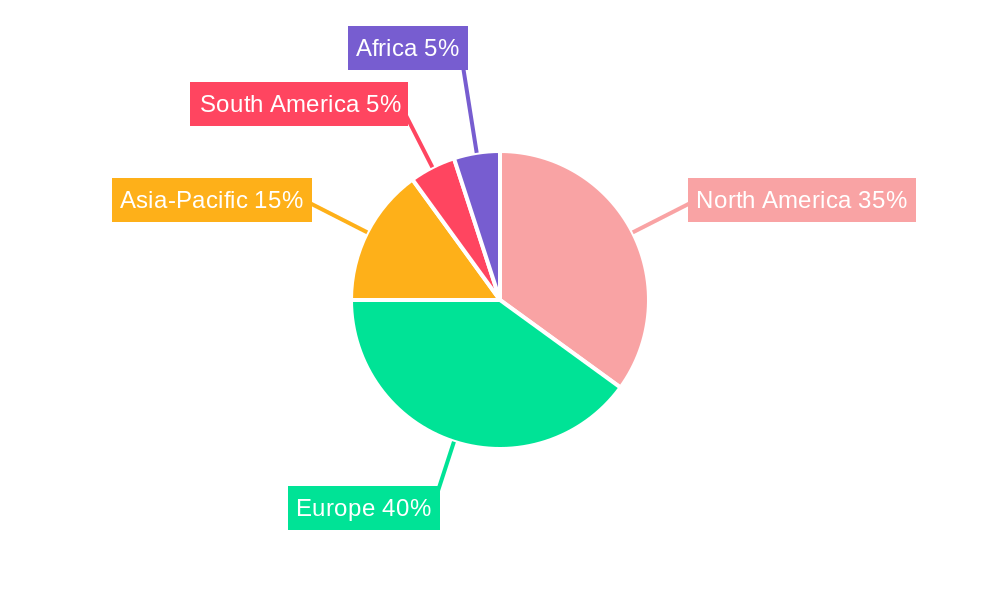
Dominant Regions, Countries, or Segments in Dry Rosé Wine
The North American region currently dominates the dry rosé wine market, accounting for approximately xx% of the global market share in 2025. This dominance is attributed to factors such as high consumer spending, strong established wine culture, and effective marketing campaigns by leading brands. Europe also holds a significant market share, with specific countries like France and Italy exhibiting strong regional growth driven by established vineyards and tourism.
- Key Drivers in North America: High disposable incomes, strong wine culture, targeted marketing campaigns.
- Key Drivers in Europe: Established vineyards, tourism, regional wine traditions.
- Growth Potential: Asia-Pacific and Latin America present significant untapped potential.
Dry Rosé Wine Product Landscape
Dry rosé wine products demonstrate significant diversity, ranging from traditional Provence-style rosés to more modern, fruit-forward variations. Innovation focuses on organic and biodynamic production, creating a wider appeal to health-conscious consumers. Producers are experimenting with unique grape varietals and blending techniques, catering to diverse palates and preferences. This constant evolution leads to higher quality, greater diversity and increased consumer engagement.
Key Drivers, Barriers & Challenges in Dry Rosé Wine
Key Drivers:
- Growing consumer preference for lighter, refreshing wines.
- Increased disposable income in emerging markets.
- Innovative marketing and distribution strategies.
- Technological advancements in winemaking.
Key Barriers and Challenges:
- Climate change impacting grape yields and quality.
- Fluctuations in grape prices and raw material costs.
- Intense competition among established and emerging players.
- Regulatory restrictions on alcohol production and distribution.
- Supply chain disruptions impacting logistics and costs.
Emerging Opportunities in Dry Rosé Wine
- Expansion into untapped markets, such as in Asia and Africa, targeting the increasing middle class.
- Development of innovative packaging options, such as canned rosé and smaller bottle formats.
- Growing demand for organic, biodynamic, and sustainably produced rosé wines.
- Creation of unique flavor profiles through experimentation with grape varietals and blending techniques.
Growth Accelerators in the Dry Rosé Wine Industry
Technological advancements in grape cultivation and winemaking are enhancing quality and efficiency. Strategic partnerships between producers and distributors facilitate wider market penetration. Expansion into emerging markets and the development of novel product formats are driving significant growth in the sector.
Key Players Shaping the Dry Rosé Wine Market
- Vilarnau
- Fleur De Mer Rosé
- Dark Horse Limited
- Luc Belaire
- SAVED Wines
- Minuty
- Rotari
- MeGao
Notable Milestones in Dry Rosé Wine Sector
- 2020: Launch of a new line of organic rosé wines by a major producer (Company Name).
- 2022: Acquisition of a smaller rosé wine producer by a multinational beverage company (Company Name).
- 2023: Introduction of a new sustainable packaging solution for rosé wines.
- 2024: Significant increase in rosé wine exports from specific regions.
In-Depth Dry Rosé Wine Market Outlook
The future of the dry rosé wine market appears bright, with continued growth driven by evolving consumer preferences, technological advancements, and strategic market expansion. The market's potential for innovation and diversification presents numerous opportunities for existing players and new entrants. Strategic partnerships, sustainable practices, and targeted marketing efforts will play a crucial role in shaping the market's trajectory in the coming years.
Dry Rose Wine Segmentation
-
1. Application
- 1.1. Online Sales
- 1.2. Offline Sales
-
2. Type
- 2.1. Semi-sweet
- 2.2. Sweet
Dry Rose Wine Segmentation By Geography
-
1. North America
- 1.1. United States
- 1.2. Canada
- 1.3. Mexico
-
2. South America
- 2.1. Brazil
- 2.2. Argentina
- 2.3. Rest of South America
-
3. Europe
- 3.1. United Kingdom
- 3.2. Germany
- 3.3. France
- 3.4. Italy
- 3.5. Spain
- 3.6. Russia
- 3.7. Benelux
- 3.8. Nordics
- 3.9. Rest of Europe
-
4. Middle East & Africa
- 4.1. Turkey
- 4.2. Israel
- 4.3. GCC
- 4.4. North Africa
- 4.5. South Africa
- 4.6. Rest of Middle East & Africa
-
5. Asia Pacific
- 5.1. China
- 5.2. India
- 5.3. Japan
- 5.4. South Korea
- 5.5. ASEAN
- 5.6. Oceania
- 5.7. Rest of Asia Pacific
Dry Rose Wine Regional Market Share
Geographic Coverage of Dry Rose Wine
Dry Rose Wine REPORT HIGHLIGHTS
| Aspects | Details |
|---|---|
| Study Period | 2020-2034 |
| Base Year | 2025 |
| Estimated Year | 2026 |
| Forecast Period | 2026-2034 |
| Historical Period | 2020-2025 |
| Growth Rate | CAGR of 9.1% from 2020-2034 |
| Segmentation |
|
Table of Contents
- 1. Introduction
- 1.1. Research Scope
- 1.2. Market Segmentation
- 1.3. Research Methodology
- 1.4. Definitions and Assumptions
- 2. Executive Summary
- 2.1. Introduction
- 3. Market Dynamics
- 3.1. Introduction
- 3.2. Market Drivers
- 3.3. Market Restrains
- 3.4. Market Trends
- 4. Market Factor Analysis
- 4.1. Porters Five Forces
- 4.2. Supply/Value Chain
- 4.3. PESTEL analysis
- 4.4. Market Entropy
- 4.5. Patent/Trademark Analysis
- 5. Global Dry Rose Wine Analysis, Insights and Forecast, 2020-2032
- 5.1. Market Analysis, Insights and Forecast - by Application
- 5.1.1. Online Sales
- 5.1.2. Offline Sales
- 5.2. Market Analysis, Insights and Forecast - by Type
- 5.2.1. Semi-sweet
- 5.2.2. Sweet
- 5.3. Market Analysis, Insights and Forecast - by Region
- 5.3.1. North America
- 5.3.2. South America
- 5.3.3. Europe
- 5.3.4. Middle East & Africa
- 5.3.5. Asia Pacific
- 5.1. Market Analysis, Insights and Forecast - by Application
- 6. North America Dry Rose Wine Analysis, Insights and Forecast, 2020-2032
- 6.1. Market Analysis, Insights and Forecast - by Application
- 6.1.1. Online Sales
- 6.1.2. Offline Sales
- 6.2. Market Analysis, Insights and Forecast - by Type
- 6.2.1. Semi-sweet
- 6.2.2. Sweet
- 6.1. Market Analysis, Insights and Forecast - by Application
- 7. South America Dry Rose Wine Analysis, Insights and Forecast, 2020-2032
- 7.1. Market Analysis, Insights and Forecast - by Application
- 7.1.1. Online Sales
- 7.1.2. Offline Sales
- 7.2. Market Analysis, Insights and Forecast - by Type
- 7.2.1. Semi-sweet
- 7.2.2. Sweet
- 7.1. Market Analysis, Insights and Forecast - by Application
- 8. Europe Dry Rose Wine Analysis, Insights and Forecast, 2020-2032
- 8.1. Market Analysis, Insights and Forecast - by Application
- 8.1.1. Online Sales
- 8.1.2. Offline Sales
- 8.2. Market Analysis, Insights and Forecast - by Type
- 8.2.1. Semi-sweet
- 8.2.2. Sweet
- 8.1. Market Analysis, Insights and Forecast - by Application
- 9. Middle East & Africa Dry Rose Wine Analysis, Insights and Forecast, 2020-2032
- 9.1. Market Analysis, Insights and Forecast - by Application
- 9.1.1. Online Sales
- 9.1.2. Offline Sales
- 9.2. Market Analysis, Insights and Forecast - by Type
- 9.2.1. Semi-sweet
- 9.2.2. Sweet
- 9.1. Market Analysis, Insights and Forecast - by Application
- 10. Asia Pacific Dry Rose Wine Analysis, Insights and Forecast, 2020-2032
- 10.1. Market Analysis, Insights and Forecast - by Application
- 10.1.1. Online Sales
- 10.1.2. Offline Sales
- 10.2. Market Analysis, Insights and Forecast - by Type
- 10.2.1. Semi-sweet
- 10.2.2. Sweet
- 10.1. Market Analysis, Insights and Forecast - by Application
- 11. Competitive Analysis
- 11.1. Global Market Share Analysis 2025
- 11.2. Company Profiles
- 11.2.1 Vilarnau
- 11.2.1.1. Overview
- 11.2.1.2. Products
- 11.2.1.3. SWOT Analysis
- 11.2.1.4. Recent Developments
- 11.2.1.5. Financials (Based on Availability)
- 11.2.2 Fleur De Mer Rosé
- 11.2.2.1. Overview
- 11.2.2.2. Products
- 11.2.2.3. SWOT Analysis
- 11.2.2.4. Recent Developments
- 11.2.2.5. Financials (Based on Availability)
- 11.2.3 Dark Horse Limited
- 11.2.3.1. Overview
- 11.2.3.2. Products
- 11.2.3.3. SWOT Analysis
- 11.2.3.4. Recent Developments
- 11.2.3.5. Financials (Based on Availability)
- 11.2.4 Luc Belaire
- 11.2.4.1. Overview
- 11.2.4.2. Products
- 11.2.4.3. SWOT Analysis
- 11.2.4.4. Recent Developments
- 11.2.4.5. Financials (Based on Availability)
- 11.2.5 SAVED Wines
- 11.2.5.1. Overview
- 11.2.5.2. Products
- 11.2.5.3. SWOT Analysis
- 11.2.5.4. Recent Developments
- 11.2.5.5. Financials (Based on Availability)
- 11.2.6 Minuty
- 11.2.6.1. Overview
- 11.2.6.2. Products
- 11.2.6.3. SWOT Analysis
- 11.2.6.4. Recent Developments
- 11.2.6.5. Financials (Based on Availability)
- 11.2.7 Rotari
- 11.2.7.1. Overview
- 11.2.7.2. Products
- 11.2.7.3. SWOT Analysis
- 11.2.7.4. Recent Developments
- 11.2.7.5. Financials (Based on Availability)
- 11.2.8 MeGao
- 11.2.8.1. Overview
- 11.2.8.2. Products
- 11.2.8.3. SWOT Analysis
- 11.2.8.4. Recent Developments
- 11.2.8.5. Financials (Based on Availability)
- 11.2.1 Vilarnau
List of Figures
- Figure 1: Global Dry Rose Wine Revenue Breakdown (undefined, %) by Region 2025 & 2033
- Figure 2: Global Dry Rose Wine Volume Breakdown (K, %) by Region 2025 & 2033
- Figure 3: North America Dry Rose Wine Revenue (undefined), by Application 2025 & 2033
- Figure 4: North America Dry Rose Wine Volume (K), by Application 2025 & 2033
- Figure 5: North America Dry Rose Wine Revenue Share (%), by Application 2025 & 2033
- Figure 6: North America Dry Rose Wine Volume Share (%), by Application 2025 & 2033
- Figure 7: North America Dry Rose Wine Revenue (undefined), by Type 2025 & 2033
- Figure 8: North America Dry Rose Wine Volume (K), by Type 2025 & 2033
- Figure 9: North America Dry Rose Wine Revenue Share (%), by Type 2025 & 2033
- Figure 10: North America Dry Rose Wine Volume Share (%), by Type 2025 & 2033
- Figure 11: North America Dry Rose Wine Revenue (undefined), by Country 2025 & 2033
- Figure 12: North America Dry Rose Wine Volume (K), by Country 2025 & 2033
- Figure 13: North America Dry Rose Wine Revenue Share (%), by Country 2025 & 2033
- Figure 14: North America Dry Rose Wine Volume Share (%), by Country 2025 & 2033
- Figure 15: South America Dry Rose Wine Revenue (undefined), by Application 2025 & 2033
- Figure 16: South America Dry Rose Wine Volume (K), by Application 2025 & 2033
- Figure 17: South America Dry Rose Wine Revenue Share (%), by Application 2025 & 2033
- Figure 18: South America Dry Rose Wine Volume Share (%), by Application 2025 & 2033
- Figure 19: South America Dry Rose Wine Revenue (undefined), by Type 2025 & 2033
- Figure 20: South America Dry Rose Wine Volume (K), by Type 2025 & 2033
- Figure 21: South America Dry Rose Wine Revenue Share (%), by Type 2025 & 2033
- Figure 22: South America Dry Rose Wine Volume Share (%), by Type 2025 & 2033
- Figure 23: South America Dry Rose Wine Revenue (undefined), by Country 2025 & 2033
- Figure 24: South America Dry Rose Wine Volume (K), by Country 2025 & 2033
- Figure 25: South America Dry Rose Wine Revenue Share (%), by Country 2025 & 2033
- Figure 26: South America Dry Rose Wine Volume Share (%), by Country 2025 & 2033
- Figure 27: Europe Dry Rose Wine Revenue (undefined), by Application 2025 & 2033
- Figure 28: Europe Dry Rose Wine Volume (K), by Application 2025 & 2033
- Figure 29: Europe Dry Rose Wine Revenue Share (%), by Application 2025 & 2033
- Figure 30: Europe Dry Rose Wine Volume Share (%), by Application 2025 & 2033
- Figure 31: Europe Dry Rose Wine Revenue (undefined), by Type 2025 & 2033
- Figure 32: Europe Dry Rose Wine Volume (K), by Type 2025 & 2033
- Figure 33: Europe Dry Rose Wine Revenue Share (%), by Type 2025 & 2033
- Figure 34: Europe Dry Rose Wine Volume Share (%), by Type 2025 & 2033
- Figure 35: Europe Dry Rose Wine Revenue (undefined), by Country 2025 & 2033
- Figure 36: Europe Dry Rose Wine Volume (K), by Country 2025 & 2033
- Figure 37: Europe Dry Rose Wine Revenue Share (%), by Country 2025 & 2033
- Figure 38: Europe Dry Rose Wine Volume Share (%), by Country 2025 & 2033
- Figure 39: Middle East & Africa Dry Rose Wine Revenue (undefined), by Application 2025 & 2033
- Figure 40: Middle East & Africa Dry Rose Wine Volume (K), by Application 2025 & 2033
- Figure 41: Middle East & Africa Dry Rose Wine Revenue Share (%), by Application 2025 & 2033
- Figure 42: Middle East & Africa Dry Rose Wine Volume Share (%), by Application 2025 & 2033
- Figure 43: Middle East & Africa Dry Rose Wine Revenue (undefined), by Type 2025 & 2033
- Figure 44: Middle East & Africa Dry Rose Wine Volume (K), by Type 2025 & 2033
- Figure 45: Middle East & Africa Dry Rose Wine Revenue Share (%), by Type 2025 & 2033
- Figure 46: Middle East & Africa Dry Rose Wine Volume Share (%), by Type 2025 & 2033
- Figure 47: Middle East & Africa Dry Rose Wine Revenue (undefined), by Country 2025 & 2033
- Figure 48: Middle East & Africa Dry Rose Wine Volume (K), by Country 2025 & 2033
- Figure 49: Middle East & Africa Dry Rose Wine Revenue Share (%), by Country 2025 & 2033
- Figure 50: Middle East & Africa Dry Rose Wine Volume Share (%), by Country 2025 & 2033
- Figure 51: Asia Pacific Dry Rose Wine Revenue (undefined), by Application 2025 & 2033
- Figure 52: Asia Pacific Dry Rose Wine Volume (K), by Application 2025 & 2033
- Figure 53: Asia Pacific Dry Rose Wine Revenue Share (%), by Application 2025 & 2033
- Figure 54: Asia Pacific Dry Rose Wine Volume Share (%), by Application 2025 & 2033
- Figure 55: Asia Pacific Dry Rose Wine Revenue (undefined), by Type 2025 & 2033
- Figure 56: Asia Pacific Dry Rose Wine Volume (K), by Type 2025 & 2033
- Figure 57: Asia Pacific Dry Rose Wine Revenue Share (%), by Type 2025 & 2033
- Figure 58: Asia Pacific Dry Rose Wine Volume Share (%), by Type 2025 & 2033
- Figure 59: Asia Pacific Dry Rose Wine Revenue (undefined), by Country 2025 & 2033
- Figure 60: Asia Pacific Dry Rose Wine Volume (K), by Country 2025 & 2033
- Figure 61: Asia Pacific Dry Rose Wine Revenue Share (%), by Country 2025 & 2033
- Figure 62: Asia Pacific Dry Rose Wine Volume Share (%), by Country 2025 & 2033
List of Tables
- Table 1: Global Dry Rose Wine Revenue undefined Forecast, by Application 2020 & 2033
- Table 2: Global Dry Rose Wine Volume K Forecast, by Application 2020 & 2033
- Table 3: Global Dry Rose Wine Revenue undefined Forecast, by Type 2020 & 2033
- Table 4: Global Dry Rose Wine Volume K Forecast, by Type 2020 & 2033
- Table 5: Global Dry Rose Wine Revenue undefined Forecast, by Region 2020 & 2033
- Table 6: Global Dry Rose Wine Volume K Forecast, by Region 2020 & 2033
- Table 7: Global Dry Rose Wine Revenue undefined Forecast, by Application 2020 & 2033
- Table 8: Global Dry Rose Wine Volume K Forecast, by Application 2020 & 2033
- Table 9: Global Dry Rose Wine Revenue undefined Forecast, by Type 2020 & 2033
- Table 10: Global Dry Rose Wine Volume K Forecast, by Type 2020 & 2033
- Table 11: Global Dry Rose Wine Revenue undefined Forecast, by Country 2020 & 2033
- Table 12: Global Dry Rose Wine Volume K Forecast, by Country 2020 & 2033
- Table 13: United States Dry Rose Wine Revenue (undefined) Forecast, by Application 2020 & 2033
- Table 14: United States Dry Rose Wine Volume (K) Forecast, by Application 2020 & 2033
- Table 15: Canada Dry Rose Wine Revenue (undefined) Forecast, by Application 2020 & 2033
- Table 16: Canada Dry Rose Wine Volume (K) Forecast, by Application 2020 & 2033
- Table 17: Mexico Dry Rose Wine Revenue (undefined) Forecast, by Application 2020 & 2033
- Table 18: Mexico Dry Rose Wine Volume (K) Forecast, by Application 2020 & 2033
- Table 19: Global Dry Rose Wine Revenue undefined Forecast, by Application 2020 & 2033
- Table 20: Global Dry Rose Wine Volume K Forecast, by Application 2020 & 2033
- Table 21: Global Dry Rose Wine Revenue undefined Forecast, by Type 2020 & 2033
- Table 22: Global Dry Rose Wine Volume K Forecast, by Type 2020 & 2033
- Table 23: Global Dry Rose Wine Revenue undefined Forecast, by Country 2020 & 2033
- Table 24: Global Dry Rose Wine Volume K Forecast, by Country 2020 & 2033
- Table 25: Brazil Dry Rose Wine Revenue (undefined) Forecast, by Application 2020 & 2033
- Table 26: Brazil Dry Rose Wine Volume (K) Forecast, by Application 2020 & 2033
- Table 27: Argentina Dry Rose Wine Revenue (undefined) Forecast, by Application 2020 & 2033
- Table 28: Argentina Dry Rose Wine Volume (K) Forecast, by Application 2020 & 2033
- Table 29: Rest of South America Dry Rose Wine Revenue (undefined) Forecast, by Application 2020 & 2033
- Table 30: Rest of South America Dry Rose Wine Volume (K) Forecast, by Application 2020 & 2033
- Table 31: Global Dry Rose Wine Revenue undefined Forecast, by Application 2020 & 2033
- Table 32: Global Dry Rose Wine Volume K Forecast, by Application 2020 & 2033
- Table 33: Global Dry Rose Wine Revenue undefined Forecast, by Type 2020 & 2033
- Table 34: Global Dry Rose Wine Volume K Forecast, by Type 2020 & 2033
- Table 35: Global Dry Rose Wine Revenue undefined Forecast, by Country 2020 & 2033
- Table 36: Global Dry Rose Wine Volume K Forecast, by Country 2020 & 2033
- Table 37: United Kingdom Dry Rose Wine Revenue (undefined) Forecast, by Application 2020 & 2033
- Table 38: United Kingdom Dry Rose Wine Volume (K) Forecast, by Application 2020 & 2033
- Table 39: Germany Dry Rose Wine Revenue (undefined) Forecast, by Application 2020 & 2033
- Table 40: Germany Dry Rose Wine Volume (K) Forecast, by Application 2020 & 2033
- Table 41: France Dry Rose Wine Revenue (undefined) Forecast, by Application 2020 & 2033
- Table 42: France Dry Rose Wine Volume (K) Forecast, by Application 2020 & 2033
- Table 43: Italy Dry Rose Wine Revenue (undefined) Forecast, by Application 2020 & 2033
- Table 44: Italy Dry Rose Wine Volume (K) Forecast, by Application 2020 & 2033
- Table 45: Spain Dry Rose Wine Revenue (undefined) Forecast, by Application 2020 & 2033
- Table 46: Spain Dry Rose Wine Volume (K) Forecast, by Application 2020 & 2033
- Table 47: Russia Dry Rose Wine Revenue (undefined) Forecast, by Application 2020 & 2033
- Table 48: Russia Dry Rose Wine Volume (K) Forecast, by Application 2020 & 2033
- Table 49: Benelux Dry Rose Wine Revenue (undefined) Forecast, by Application 2020 & 2033
- Table 50: Benelux Dry Rose Wine Volume (K) Forecast, by Application 2020 & 2033
- Table 51: Nordics Dry Rose Wine Revenue (undefined) Forecast, by Application 2020 & 2033
- Table 52: Nordics Dry Rose Wine Volume (K) Forecast, by Application 2020 & 2033
- Table 53: Rest of Europe Dry Rose Wine Revenue (undefined) Forecast, by Application 2020 & 2033
- Table 54: Rest of Europe Dry Rose Wine Volume (K) Forecast, by Application 2020 & 2033
- Table 55: Global Dry Rose Wine Revenue undefined Forecast, by Application 2020 & 2033
- Table 56: Global Dry Rose Wine Volume K Forecast, by Application 2020 & 2033
- Table 57: Global Dry Rose Wine Revenue undefined Forecast, by Type 2020 & 2033
- Table 58: Global Dry Rose Wine Volume K Forecast, by Type 2020 & 2033
- Table 59: Global Dry Rose Wine Revenue undefined Forecast, by Country 2020 & 2033
- Table 60: Global Dry Rose Wine Volume K Forecast, by Country 2020 & 2033
- Table 61: Turkey Dry Rose Wine Revenue (undefined) Forecast, by Application 2020 & 2033
- Table 62: Turkey Dry Rose Wine Volume (K) Forecast, by Application 2020 & 2033
- Table 63: Israel Dry Rose Wine Revenue (undefined) Forecast, by Application 2020 & 2033
- Table 64: Israel Dry Rose Wine Volume (K) Forecast, by Application 2020 & 2033
- Table 65: GCC Dry Rose Wine Revenue (undefined) Forecast, by Application 2020 & 2033
- Table 66: GCC Dry Rose Wine Volume (K) Forecast, by Application 2020 & 2033
- Table 67: North Africa Dry Rose Wine Revenue (undefined) Forecast, by Application 2020 & 2033
- Table 68: North Africa Dry Rose Wine Volume (K) Forecast, by Application 2020 & 2033
- Table 69: South Africa Dry Rose Wine Revenue (undefined) Forecast, by Application 2020 & 2033
- Table 70: South Africa Dry Rose Wine Volume (K) Forecast, by Application 2020 & 2033
- Table 71: Rest of Middle East & Africa Dry Rose Wine Revenue (undefined) Forecast, by Application 2020 & 2033
- Table 72: Rest of Middle East & Africa Dry Rose Wine Volume (K) Forecast, by Application 2020 & 2033
- Table 73: Global Dry Rose Wine Revenue undefined Forecast, by Application 2020 & 2033
- Table 74: Global Dry Rose Wine Volume K Forecast, by Application 2020 & 2033
- Table 75: Global Dry Rose Wine Revenue undefined Forecast, by Type 2020 & 2033
- Table 76: Global Dry Rose Wine Volume K Forecast, by Type 2020 & 2033
- Table 77: Global Dry Rose Wine Revenue undefined Forecast, by Country 2020 & 2033
- Table 78: Global Dry Rose Wine Volume K Forecast, by Country 2020 & 2033
- Table 79: China Dry Rose Wine Revenue (undefined) Forecast, by Application 2020 & 2033
- Table 80: China Dry Rose Wine Volume (K) Forecast, by Application 2020 & 2033
- Table 81: India Dry Rose Wine Revenue (undefined) Forecast, by Application 2020 & 2033
- Table 82: India Dry Rose Wine Volume (K) Forecast, by Application 2020 & 2033
- Table 83: Japan Dry Rose Wine Revenue (undefined) Forecast, by Application 2020 & 2033
- Table 84: Japan Dry Rose Wine Volume (K) Forecast, by Application 2020 & 2033
- Table 85: South Korea Dry Rose Wine Revenue (undefined) Forecast, by Application 2020 & 2033
- Table 86: South Korea Dry Rose Wine Volume (K) Forecast, by Application 2020 & 2033
- Table 87: ASEAN Dry Rose Wine Revenue (undefined) Forecast, by Application 2020 & 2033
- Table 88: ASEAN Dry Rose Wine Volume (K) Forecast, by Application 2020 & 2033
- Table 89: Oceania Dry Rose Wine Revenue (undefined) Forecast, by Application 2020 & 2033
- Table 90: Oceania Dry Rose Wine Volume (K) Forecast, by Application 2020 & 2033
- Table 91: Rest of Asia Pacific Dry Rose Wine Revenue (undefined) Forecast, by Application 2020 & 2033
- Table 92: Rest of Asia Pacific Dry Rose Wine Volume (K) Forecast, by Application 2020 & 2033
Frequently Asked Questions
1. What is the projected Compound Annual Growth Rate (CAGR) of the Dry Rose Wine?
The projected CAGR is approximately 9.1%.
2. Which companies are prominent players in the Dry Rose Wine?
Key companies in the market include Vilarnau, Fleur De Mer Rosé, Dark Horse Limited, Luc Belaire, SAVED Wines, Minuty, Rotari, MeGao.
3. What are the main segments of the Dry Rose Wine?
The market segments include Application, Type.
4. Can you provide details about the market size?
The market size is estimated to be USD XXX N/A as of 2022.
5. What are some drivers contributing to market growth?
N/A
6. What are the notable trends driving market growth?
N/A
7. Are there any restraints impacting market growth?
N/A
8. Can you provide examples of recent developments in the market?
N/A
9. What pricing options are available for accessing the report?
Pricing options include single-user, multi-user, and enterprise licenses priced at USD 3950.00, USD 5925.00, and USD 7900.00 respectively.
10. Is the market size provided in terms of value or volume?
The market size is provided in terms of value, measured in N/A and volume, measured in K.
11. Are there any specific market keywords associated with the report?
Yes, the market keyword associated with the report is "Dry Rose Wine," which aids in identifying and referencing the specific market segment covered.
12. How do I determine which pricing option suits my needs best?
The pricing options vary based on user requirements and access needs. Individual users may opt for single-user licenses, while businesses requiring broader access may choose multi-user or enterprise licenses for cost-effective access to the report.
13. Are there any additional resources or data provided in the Dry Rose Wine report?
While the report offers comprehensive insights, it's advisable to review the specific contents or supplementary materials provided to ascertain if additional resources or data are available.
14. How can I stay updated on further developments or reports in the Dry Rose Wine?
To stay informed about further developments, trends, and reports in the Dry Rose Wine, consider subscribing to industry newsletters, following relevant companies and organizations, or regularly checking reputable industry news sources and publications.
Methodology
Step 1 - Identification of Relevant Samples Size from Population Database


Step 2 - Approaches for Defining Global Market Size (Value, Volume* & Price*)

Note*: In applicable scenarios
Step 3 - Data Sources
Primary Research
- Web Analytics
- Survey Reports
- Research Institute
- Latest Research Reports
- Opinion Leaders
Secondary Research
- Annual Reports
- White Paper
- Latest Press Release
- Industry Association
- Paid Database
- Investor Presentations

Step 4 - Data Triangulation
Involves using different sources of information in order to increase the validity of a study
These sources are likely to be stakeholders in a program - participants, other researchers, program staff, other community members, and so on.
Then we put all data in single framework & apply various statistical tools to find out the dynamic on the market.
During the analysis stage, feedback from the stakeholder groups would be compared to determine areas of agreement as well as areas of divergence