

Key Insights
The Dysphagia Friendly Food market is experiencing significant growth, projected to reach an estimated $8.1 billion in 2025. This expansion is fueled by a rising global prevalence of swallowing difficulties, often associated with an aging population and the increasing incidence of neurological disorders and certain medical conditions. As healthcare systems and care facilities prioritize improved patient outcomes and quality of life, the demand for specialized food products designed for easier consumption is escalating. The 7% CAGR anticipated over the forecast period underscores the market's robust upward trajectory. Key market drivers include technological advancements in food processing that allow for improved texture modification and palatability, alongside greater awareness among healthcare professionals and consumers about the benefits of dysphagia-friendly diets. The market is segmented by application into Medical Institutions, Elderly Care Service Institutions, and Individuals and Families, with each segment demonstrating distinct growth patterns influenced by demographic shifts and healthcare spending.
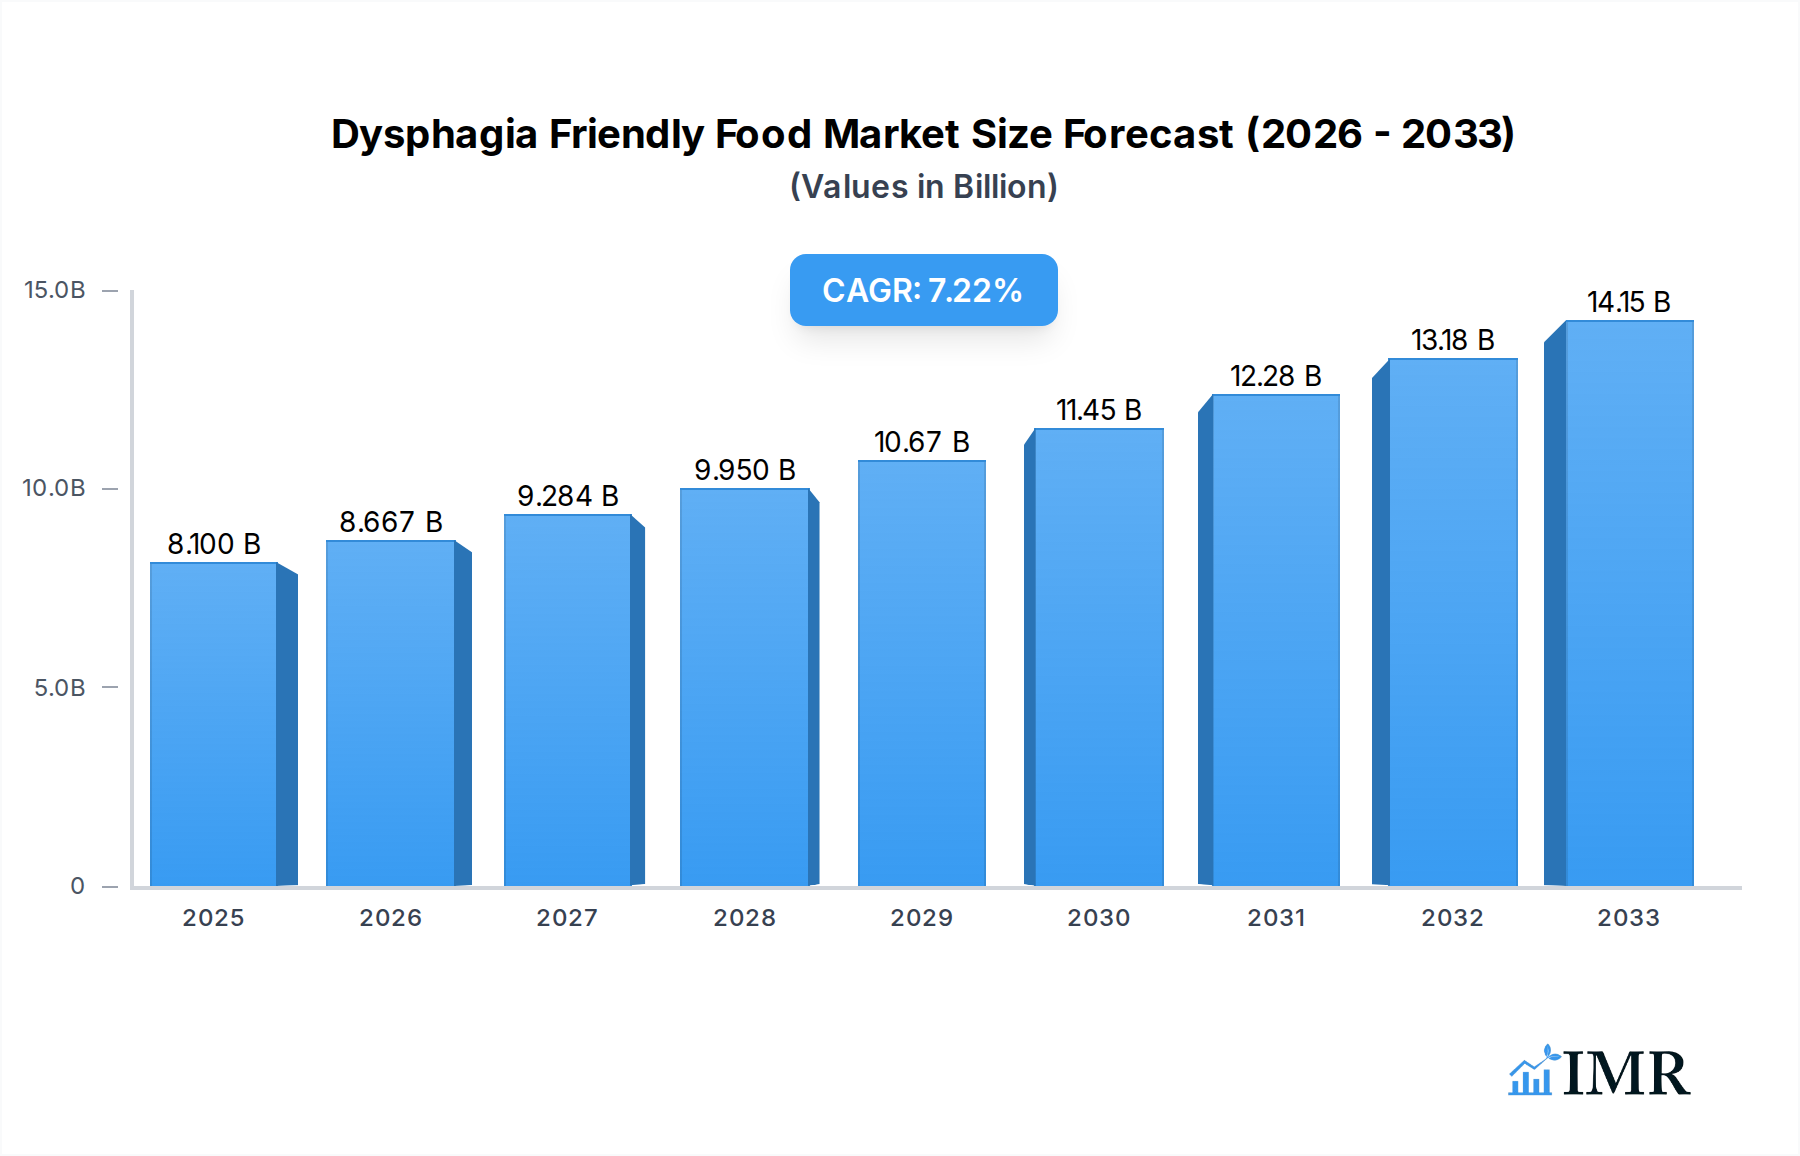
Dysphagia Friendly Food Market Size (In Billion)
Further analysis reveals that the "Frozen Storage" segment is poised for substantial growth, offering convenience and extended shelf life, which is particularly beneficial for both institutions and home-based care. While the market offers significant opportunities, certain restraints, such as the initial cost of specialized food production and the need for consistent quality and taste, could temper rapid adoption in some regions. However, the increasing focus on nutritional adequacy and the prevention of malnutrition and dehydration among individuals with dysphagia are powerful counterforces driving innovation and market penetration. Companies like Maruha Nichiro, Kewpie, Ajinomoto, Nestlé Health Science, and Campbell are actively investing in product development and expanding their portfolios to cater to this evolving demand, indicating a highly competitive yet dynamic market landscape. The penetration of these products across North America, Europe, and the Asia Pacific region is expected to be particularly strong due to advanced healthcare infrastructure and higher disposable incomes.

Dysphagia Friendly Food Company Market Share
Dysphagia Friendly Food Market: Navigating Growth in a Specialized Nutrition Landscape (2019-2033)
This comprehensive report delves into the dynamic Dysphagia Friendly Food market, providing an in-depth analysis of its structure, growth trajectory, dominant players, and future outlook. With a projected market size of $XX billion in 2025 and an anticipated Compound Annual Growth Rate (CAGR) of XX% during the forecast period of 2025-2033, this market presents significant opportunities for stakeholders in the healthcare, food manufacturing, and elderly care sectors. Our analysis covers the historical period from 2019-2024, the base year of 2025, and forecasts through 2033, offering critical insights for strategic decision-making.
Dysphagia Friendly Food Market Dynamics & Structure
The Dysphagia Friendly Food market is characterized by a moderate level of concentration, with a few key players holding significant shares, particularly in developed regions. Technological innovation is a primary driver, focusing on texture modification, palatability enhancement, and improved nutritional profiles to cater to the specific needs of individuals with swallowing difficulties. Regulatory frameworks, such as food safety standards and medical device classifications for specialized dietary products, play a crucial role in shaping market entry and product development. Competitive product substitutes include traditional pureed foods, thickeners, and alternative feeding methods, but the demand for convenient, palatable, and nutritionally complete dysphagia-friendly options is steadily growing. End-user demographics are predominantly the elderly population, followed by individuals with neurological conditions, post-surgical patients, and pediatric cases requiring modified diets. Mergers and acquisitions (M&A) trends are observed as larger food and healthcare companies seek to expand their specialized nutrition portfolios, indicating a consolidation phase driven by market potential.
- Market Concentration: Moderate, with a gradual increase in activity from new entrants targeting niche segments.
- Technological Innovation Drivers: Advanced food processing techniques (e.g., 3D printing, ultrasonic processing), novel thickeners, and flavor encapsulation technologies.
- Regulatory Frameworks: Adherence to WHO guidelines on food safety, national food administration regulations, and specific medical nutrition certifications.
- Competitive Product Substitutes: Traditional pureed foods, independent thickening agents, enteral nutrition.
- End-User Demographics: Elderly population (over 65 years) constitutes the largest segment, followed by patients with stroke, Parkinson's disease, ALS, and head/neck cancer.
- M&A Trends: Strategic acquisitions by major food conglomerates to bolster their presence in the lucrative medical nutrition sector.
Dysphagia Friendly Food Growth Trends & Insights
The Dysphagia Friendly Food market is experiencing robust growth, propelled by a confluence of demographic shifts, increasing healthcare awareness, and advancements in food science. The global market size, estimated at $XX billion in the base year of 2025, is projected to reach $XX billion by 2033, exhibiting a healthy CAGR of XX% during the forecast period. This expansion is underpinned by an aging global population, a key demographic segment highly susceptible to dysphagia. As awareness about the importance of specialized nutrition for individuals with swallowing difficulties rises, adoption rates for dysphagia-friendly food products are increasing across various settings. Technological disruptions, including innovative food processing methods that improve texture, taste, and nutritional bioavailability, are crucial enablers. Consumer behavior shifts are also evident, with a growing demand for convenient, ready-to-eat options that maintain palatability and offer a sense of normalcy to meals. The market penetration of these specialized foods is expanding beyond traditional medical institutions to encompass home-based care and assisted living facilities. The increasing prevalence of chronic diseases that often lead to dysphagia, such as neurological disorders and cancer, further fuels the demand. Investments in research and development by key players are continuously introducing new product formulations that cater to diverse dietary needs and preferences. The shift towards preventative healthcare and improved quality of life for individuals with swallowing impairments is a significant growth driver, encouraging greater product innovation and market accessibility. The growing understanding of the link between adequate nutrition and recovery from illness or injury is also driving the adoption of dysphagia-friendly diets in clinical settings.
Dominant Regions, Countries, or Segments in Dysphagia Friendly Food
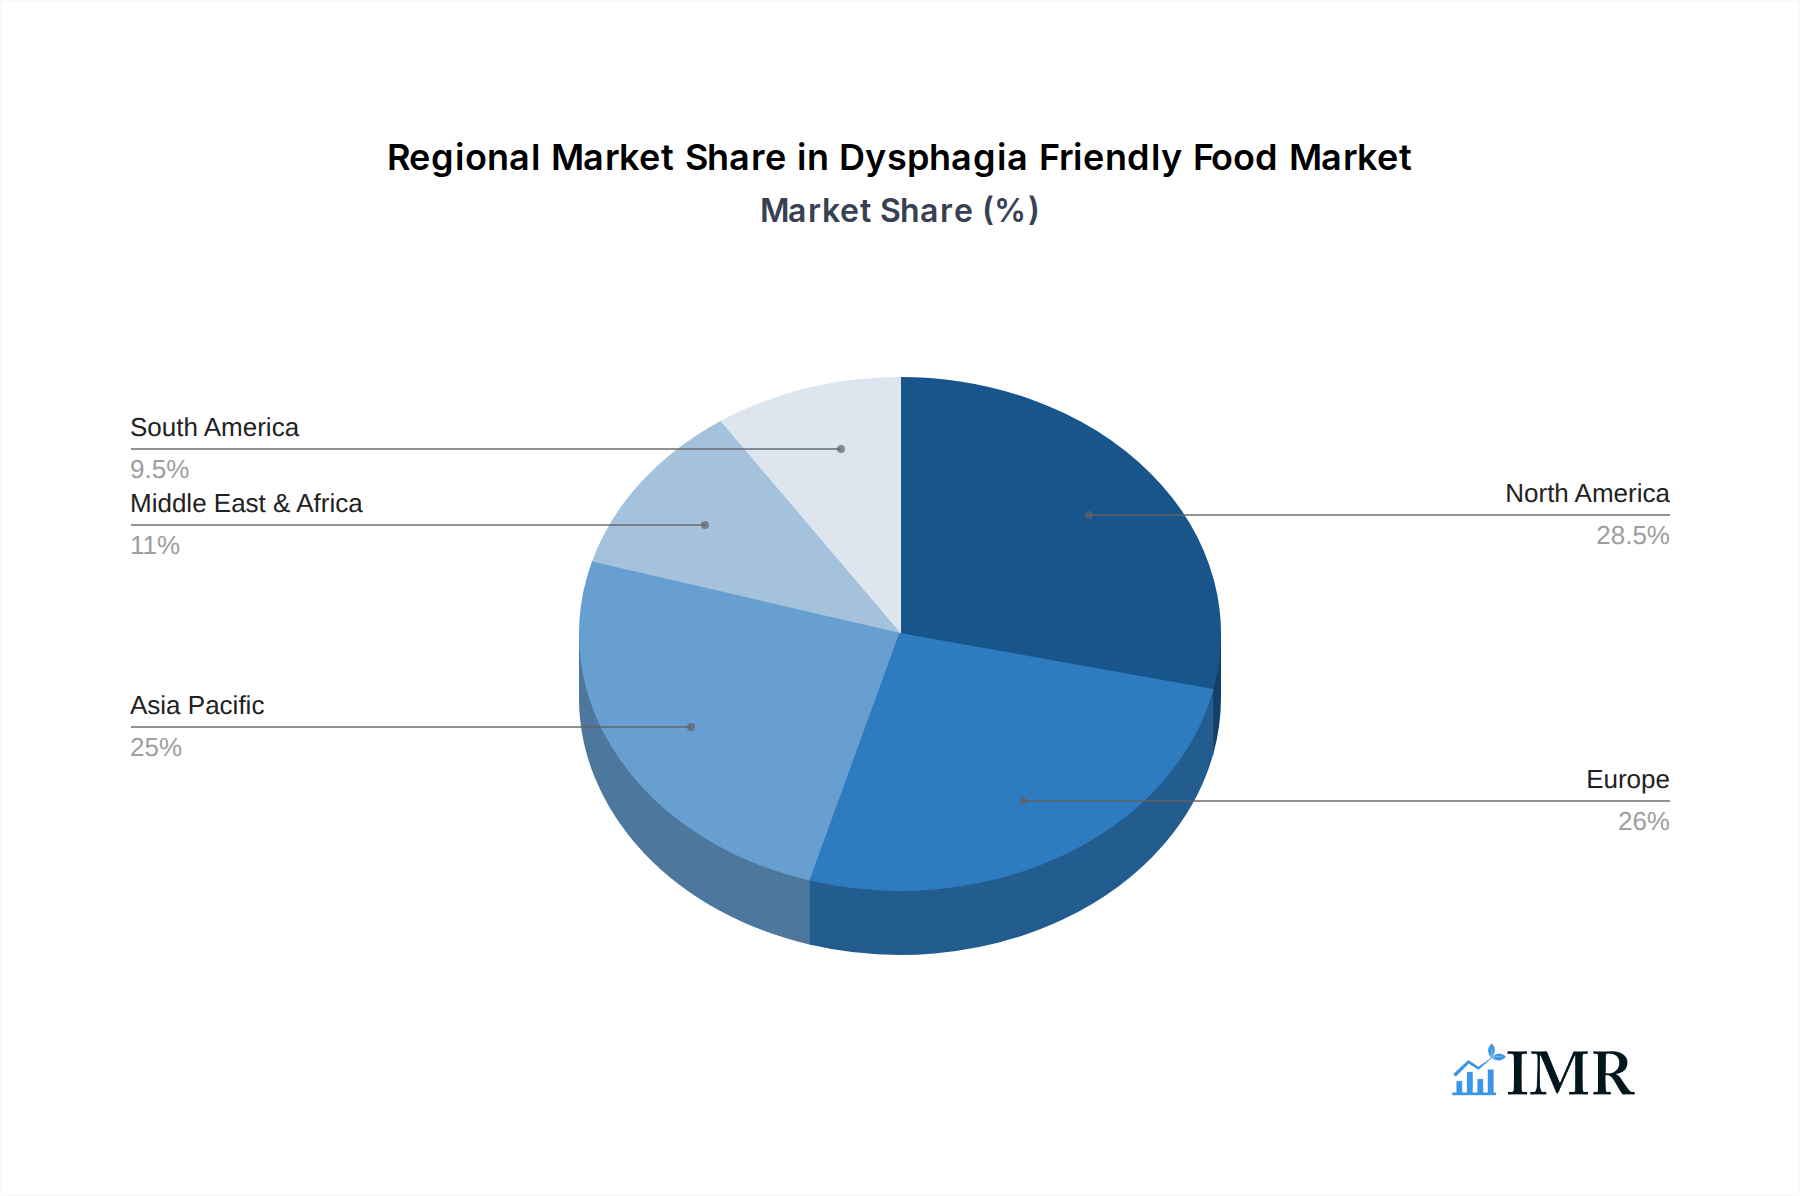
The Dysphagia Friendly Food market exhibits significant regional variations in growth and adoption, with North America and Europe currently dominating due to their aging populations, advanced healthcare infrastructure, and higher disposable incomes. Within these regions, countries like the United States, Germany, and the United Kingdom are leading the market. The Individuals and Families segment, particularly within the Room Temperature Storage type, is emerging as a significant growth driver, reflecting an increasing number of individuals seeking convenient and palatable solutions for home care. However, Medical Institutions and Elderly Care Service Institutions, leveraging Frozen Storage for bulk supply and extended shelf life, remain the largest application segments due to the concentrated patient populations requiring specialized diets. Economic policies supporting healthcare and eldercare, coupled with robust distribution networks, are key factors contributing to the dominance of developed regions.
- Dominant Region: North America, driven by a large elderly population and a well-established healthcare system.
- Leading Country: United States, with high per capita healthcare spending and a strong demand for specialized nutritional products.
- Dominant Application Segment: Medical Institutions, including hospitals and rehabilitation centers, due to the high prevalence of dysphagia in patients.
- Key Type Segment Driving Growth: Room Temperature Storage, catering to the convenience needs of individuals and families at home.
- Growth Potential: Asia-Pacific and Latin America are expected to witness substantial growth driven by improving healthcare access and rising awareness.
Dysphagia Friendly Food Product Landscape
The Dysphagia Friendly Food product landscape is continuously evolving, marked by innovations focused on texture modification, enhanced palatability, and improved nutritional profiles. Companies are employing advanced techniques like hydrocolloid-based thickening, microencapsulation of flavors, and precise processing to achieve desired consistencies ranging from thickened liquids to soft, easily swallowable solids. Product applications span various meal types, including soups, purees, desserts, and complete meal replacements, often fortified with essential vitamins and minerals. Key performance metrics include achieving specific International Dysphagia Diet Standardisation Initiative (IDDSI) levels, taste profiles, and ease of preparation. Unique selling propositions often revolve around "natural" ingredients, allergen-free formulations, and culturally relevant flavors.
Key Drivers, Barriers & Challenges in Dysphagia Friendly Food
The Dysphagia Friendly Food market is propelled by several key drivers. The aging global population is the primary catalyst, leading to a higher incidence of dysphagia. Increased awareness of the impact of proper nutrition on patient outcomes in healthcare settings is another significant driver. Technological advancements in food processing and formulation allow for the creation of more palatable and effective dysphagia-friendly foods. Furthermore, a growing focus on improving the quality of life for individuals with swallowing difficulties fuels demand.
- Technological Drivers: Advanced hydrocolloids, flavor masking technologies, 3D food printing for custom textures.
- Economic Drivers: Rising healthcare expenditure, increased disposable incomes in target demographics.
- Policy-Driven Factors: Government initiatives to improve eldercare and specialized nutrition access.
Key challenges and restraints in the market include high production costs associated with specialized ingredients and processing, which can lead to premium pricing that limits accessibility for some consumers. Limited consumer awareness and acceptance of specialized dysphagia-friendly products can hinder adoption. Regulatory complexities and varying standards across regions can also pose challenges. Furthermore, supply chain disruptions and the need for specialized cold chain logistics for certain product types can impact availability and cost.
- Supply Chain Issues: Maintaining consistent texture and quality throughout the distribution network, especially for frozen products.
- Regulatory Hurdles: Navigating diverse food labeling and medical nutrition regulations globally.
- Competitive Pressures: Competition from generic pureed foods and the DIY approach of home preparation.
Emerging Opportunities in Dysphagia Friendly Food
Emerging opportunities in the Dysphagia Friendly Food industry lie in expanding product portfolios to cater to diverse ethnic cuisines and specialized dietary needs, such as low-sodium or diabetic-friendly dysphagia diets. The development of ready-to-eat, shelf-stable dysphagia-friendly meals offers significant potential for the retail and travel sectors. Furthermore, leveraging digital platforms for direct-to-consumer sales and offering personalized nutrition plans based on individual dysphagia severity and preferences presents a vast untapped market. The growing demand for convenient and nutritious options in pediatric dysphagia care also represents a promising avenue for innovation.
Growth Accelerators in the Dysphagia Friendly Food Industry
Long-term growth in the Dysphagia Friendly Food industry is being accelerated by significant technological breakthroughs in texture modification and palatability enhancement. Strategic partnerships between food manufacturers and healthcare providers are crucial for market penetration and product validation. Furthermore, market expansion strategies targeting emerging economies with rapidly aging populations and improving healthcare infrastructure will be key growth accelerators. The increasing integration of dysphagia-friendly food options into home healthcare services and telehealth platforms is also expected to drive sustained growth.
Key Players Shaping the Dysphagia Friendly Food Market
- Maruha Nichiro
- Kewpie
- Ajinomoto
- Hormel
- Ever-smile
- Asahi
- Yayoi Sun Foods
- Nestlé Health Science
- Campbell
- Nisshin
- Hokko DELI
- DAIREI
- AEON TOPVALU
- Tanaka Foods
- NittoBest
- Forica Foods
- Senior Deli
Notable Milestones in Dysphagia Friendly Food Sector
- 2019: Launch of a new line of IDDSI-compliant pureed meals by Nestlé Health Science, improving patient compliance.
- 2020: Kewpie Corporation invests in advanced food processing technology to enhance texture and flavor of dysphagia-friendly products.
- 2021: Hormel introduces a range of shelf-stable dysphagia-friendly soups, expanding home care accessibility.
- 2022: Maruha Nichiro expands its research into novel thickening agents for improved mouthfeel in dysphagia diets.
- 2023: Ever-smile launches a subscription service for personalized dysphagia-friendly meal plans, increasing consumer convenience.
- 2024: Ajinomoto develops advanced flavor profiles to counter the blandness often associated with dysphagia-friendly foods.
In-Depth Dysphagia Friendly Food Market Outlook
The Dysphagia Friendly Food market is poised for substantial expansion, driven by sustained demographic trends and continuous innovation. Growth accelerators include the increasing integration of these specialized foods into mainstream healthcare pathways and the growing consumer demand for convenient, high-quality nutritional solutions. Strategic partnerships between food manufacturers and healthcare institutions will continue to foster product development and market penetration. As technology advances, we can expect more personalized and palatable dysphagia-friendly options, further solidifying the market's potential and offering significant opportunities for stakeholders dedicated to improving the lives of individuals with swallowing difficulties.
Dysphagia Friendly Food Segmentation
-
1. Application
- 1.1. Medical Institutions
- 1.2. Elderly Care Service Institutions
- 1.3. Individuals and Families
-
2. Type
- 2.1. Frozen Storage
- 2.2. Room Temperature Storage
Dysphagia Friendly Food Segmentation By Geography
-
1. North America
- 1.1. United States
- 1.2. Canada
- 1.3. Mexico
-
2. South America
- 2.1. Brazil
- 2.2. Argentina
- 2.3. Rest of South America
-
3. Europe
- 3.1. United Kingdom
- 3.2. Germany
- 3.3. France
- 3.4. Italy
- 3.5. Spain
- 3.6. Russia
- 3.7. Benelux
- 3.8. Nordics
- 3.9. Rest of Europe
-
4. Middle East & Africa
- 4.1. Turkey
- 4.2. Israel
- 4.3. GCC
- 4.4. North Africa
- 4.5. South Africa
- 4.6. Rest of Middle East & Africa
-
5. Asia Pacific
- 5.1. China
- 5.2. India
- 5.3. Japan
- 5.4. South Korea
- 5.5. ASEAN
- 5.6. Oceania
- 5.7. Rest of Asia Pacific
Dysphagia Friendly Food Regional Market Share
Geographic Coverage of Dysphagia Friendly Food
Dysphagia Friendly Food REPORT HIGHLIGHTS
| Aspects | Details |
|---|---|
| Study Period | 2020-2034 |
| Base Year | 2025 |
| Estimated Year | 2026 |
| Forecast Period | 2026-2034 |
| Historical Period | 2020-2025 |
| Growth Rate | CAGR of 7% from 2020-2034 |
| Segmentation |
|
Table of Contents
- 1. Introduction
- 1.1. Research Scope
- 1.2. Market Segmentation
- 1.3. Research Methodology
- 1.4. Definitions and Assumptions
- 2. Executive Summary
- 2.1. Introduction
- 3. Market Dynamics
- 3.1. Introduction
- 3.2. Market Drivers
- 3.3. Market Restrains
- 3.4. Market Trends
- 4. Market Factor Analysis
- 4.1. Porters Five Forces
- 4.2. Supply/Value Chain
- 4.3. PESTEL analysis
- 4.4. Market Entropy
- 4.5. Patent/Trademark Analysis
- 5. Global Dysphagia Friendly Food Analysis, Insights and Forecast, 2020-2032
- 5.1. Market Analysis, Insights and Forecast - by Application
- 5.1.1. Medical Institutions
- 5.1.2. Elderly Care Service Institutions
- 5.1.3. Individuals and Families
- 5.2. Market Analysis, Insights and Forecast - by Type
- 5.2.1. Frozen Storage
- 5.2.2. Room Temperature Storage
- 5.3. Market Analysis, Insights and Forecast - by Region
- 5.3.1. North America
- 5.3.2. South America
- 5.3.3. Europe
- 5.3.4. Middle East & Africa
- 5.3.5. Asia Pacific
- 5.1. Market Analysis, Insights and Forecast - by Application
- 6. North America Dysphagia Friendly Food Analysis, Insights and Forecast, 2020-2032
- 6.1. Market Analysis, Insights and Forecast - by Application
- 6.1.1. Medical Institutions
- 6.1.2. Elderly Care Service Institutions
- 6.1.3. Individuals and Families
- 6.2. Market Analysis, Insights and Forecast - by Type
- 6.2.1. Frozen Storage
- 6.2.2. Room Temperature Storage
- 6.1. Market Analysis, Insights and Forecast - by Application
- 7. South America Dysphagia Friendly Food Analysis, Insights and Forecast, 2020-2032
- 7.1. Market Analysis, Insights and Forecast - by Application
- 7.1.1. Medical Institutions
- 7.1.2. Elderly Care Service Institutions
- 7.1.3. Individuals and Families
- 7.2. Market Analysis, Insights and Forecast - by Type
- 7.2.1. Frozen Storage
- 7.2.2. Room Temperature Storage
- 7.1. Market Analysis, Insights and Forecast - by Application
- 8. Europe Dysphagia Friendly Food Analysis, Insights and Forecast, 2020-2032
- 8.1. Market Analysis, Insights and Forecast - by Application
- 8.1.1. Medical Institutions
- 8.1.2. Elderly Care Service Institutions
- 8.1.3. Individuals and Families
- 8.2. Market Analysis, Insights and Forecast - by Type
- 8.2.1. Frozen Storage
- 8.2.2. Room Temperature Storage
- 8.1. Market Analysis, Insights and Forecast - by Application
- 9. Middle East & Africa Dysphagia Friendly Food Analysis, Insights and Forecast, 2020-2032
- 9.1. Market Analysis, Insights and Forecast - by Application
- 9.1.1. Medical Institutions
- 9.1.2. Elderly Care Service Institutions
- 9.1.3. Individuals and Families
- 9.2. Market Analysis, Insights and Forecast - by Type
- 9.2.1. Frozen Storage
- 9.2.2. Room Temperature Storage
- 9.1. Market Analysis, Insights and Forecast - by Application
- 10. Asia Pacific Dysphagia Friendly Food Analysis, Insights and Forecast, 2020-2032
- 10.1. Market Analysis, Insights and Forecast - by Application
- 10.1.1. Medical Institutions
- 10.1.2. Elderly Care Service Institutions
- 10.1.3. Individuals and Families
- 10.2. Market Analysis, Insights and Forecast - by Type
- 10.2.1. Frozen Storage
- 10.2.2. Room Temperature Storage
- 10.1. Market Analysis, Insights and Forecast - by Application
- 11. Competitive Analysis
- 11.1. Global Market Share Analysis 2025
- 11.2. Company Profiles
- 11.2.1 Maruha Nichiro
- 11.2.1.1. Overview
- 11.2.1.2. Products
- 11.2.1.3. SWOT Analysis
- 11.2.1.4. Recent Developments
- 11.2.1.5. Financials (Based on Availability)
- 11.2.2 Kewpie
- 11.2.2.1. Overview
- 11.2.2.2. Products
- 11.2.2.3. SWOT Analysis
- 11.2.2.4. Recent Developments
- 11.2.2.5. Financials (Based on Availability)
- 11.2.3 Ajinomoto
- 11.2.3.1. Overview
- 11.2.3.2. Products
- 11.2.3.3. SWOT Analysis
- 11.2.3.4. Recent Developments
- 11.2.3.5. Financials (Based on Availability)
- 11.2.4 Hormel
- 11.2.4.1. Overview
- 11.2.4.2. Products
- 11.2.4.3. SWOT Analysis
- 11.2.4.4. Recent Developments
- 11.2.4.5. Financials (Based on Availability)
- 11.2.5 Ever-smile
- 11.2.5.1. Overview
- 11.2.5.2. Products
- 11.2.5.3. SWOT Analysis
- 11.2.5.4. Recent Developments
- 11.2.5.5. Financials (Based on Availability)
- 11.2.6 Asahi
- 11.2.6.1. Overview
- 11.2.6.2. Products
- 11.2.6.3. SWOT Analysis
- 11.2.6.4. Recent Developments
- 11.2.6.5. Financials (Based on Availability)
- 11.2.7 Yayoi Sun Foods
- 11.2.7.1. Overview
- 11.2.7.2. Products
- 11.2.7.3. SWOT Analysis
- 11.2.7.4. Recent Developments
- 11.2.7.5. Financials (Based on Availability)
- 11.2.8 Nestlé Health Science
- 11.2.8.1. Overview
- 11.2.8.2. Products
- 11.2.8.3. SWOT Analysis
- 11.2.8.4. Recent Developments
- 11.2.8.5. Financials (Based on Availability)
- 11.2.9 Campbell
- 11.2.9.1. Overview
- 11.2.9.2. Products
- 11.2.9.3. SWOT Analysis
- 11.2.9.4. Recent Developments
- 11.2.9.5. Financials (Based on Availability)
- 11.2.10 Nisshin
- 11.2.10.1. Overview
- 11.2.10.2. Products
- 11.2.10.3. SWOT Analysis
- 11.2.10.4. Recent Developments
- 11.2.10.5. Financials (Based on Availability)
- 11.2.11 Hokko DELI
- 11.2.11.1. Overview
- 11.2.11.2. Products
- 11.2.11.3. SWOT Analysis
- 11.2.11.4. Recent Developments
- 11.2.11.5. Financials (Based on Availability)
- 11.2.12 DAIREI
- 11.2.12.1. Overview
- 11.2.12.2. Products
- 11.2.12.3. SWOT Analysis
- 11.2.12.4. Recent Developments
- 11.2.12.5. Financials (Based on Availability)
- 11.2.13 AEON TOPVALU
- 11.2.13.1. Overview
- 11.2.13.2. Products
- 11.2.13.3. SWOT Analysis
- 11.2.13.4. Recent Developments
- 11.2.13.5. Financials (Based on Availability)
- 11.2.14 Tanaka Foods
- 11.2.14.1. Overview
- 11.2.14.2. Products
- 11.2.14.3. SWOT Analysis
- 11.2.14.4. Recent Developments
- 11.2.14.5. Financials (Based on Availability)
- 11.2.15 NittoBest
- 11.2.15.1. Overview
- 11.2.15.2. Products
- 11.2.15.3. SWOT Analysis
- 11.2.15.4. Recent Developments
- 11.2.15.5. Financials (Based on Availability)
- 11.2.16 Forica Foods
- 11.2.16.1. Overview
- 11.2.16.2. Products
- 11.2.16.3. SWOT Analysis
- 11.2.16.4. Recent Developments
- 11.2.16.5. Financials (Based on Availability)
- 11.2.17 Senior Deli
- 11.2.17.1. Overview
- 11.2.17.2. Products
- 11.2.17.3. SWOT Analysis
- 11.2.17.4. Recent Developments
- 11.2.17.5. Financials (Based on Availability)
- 11.2.1 Maruha Nichiro
List of Figures
- Figure 1: Global Dysphagia Friendly Food Revenue Breakdown (undefined, %) by Region 2025 & 2033
- Figure 2: North America Dysphagia Friendly Food Revenue (undefined), by Application 2025 & 2033
- Figure 3: North America Dysphagia Friendly Food Revenue Share (%), by Application 2025 & 2033
- Figure 4: North America Dysphagia Friendly Food Revenue (undefined), by Type 2025 & 2033
- Figure 5: North America Dysphagia Friendly Food Revenue Share (%), by Type 2025 & 2033
- Figure 6: North America Dysphagia Friendly Food Revenue (undefined), by Country 2025 & 2033
- Figure 7: North America Dysphagia Friendly Food Revenue Share (%), by Country 2025 & 2033
- Figure 8: South America Dysphagia Friendly Food Revenue (undefined), by Application 2025 & 2033
- Figure 9: South America Dysphagia Friendly Food Revenue Share (%), by Application 2025 & 2033
- Figure 10: South America Dysphagia Friendly Food Revenue (undefined), by Type 2025 & 2033
- Figure 11: South America Dysphagia Friendly Food Revenue Share (%), by Type 2025 & 2033
- Figure 12: South America Dysphagia Friendly Food Revenue (undefined), by Country 2025 & 2033
- Figure 13: South America Dysphagia Friendly Food Revenue Share (%), by Country 2025 & 2033
- Figure 14: Europe Dysphagia Friendly Food Revenue (undefined), by Application 2025 & 2033
- Figure 15: Europe Dysphagia Friendly Food Revenue Share (%), by Application 2025 & 2033
- Figure 16: Europe Dysphagia Friendly Food Revenue (undefined), by Type 2025 & 2033
- Figure 17: Europe Dysphagia Friendly Food Revenue Share (%), by Type 2025 & 2033
- Figure 18: Europe Dysphagia Friendly Food Revenue (undefined), by Country 2025 & 2033
- Figure 19: Europe Dysphagia Friendly Food Revenue Share (%), by Country 2025 & 2033
- Figure 20: Middle East & Africa Dysphagia Friendly Food Revenue (undefined), by Application 2025 & 2033
- Figure 21: Middle East & Africa Dysphagia Friendly Food Revenue Share (%), by Application 2025 & 2033
- Figure 22: Middle East & Africa Dysphagia Friendly Food Revenue (undefined), by Type 2025 & 2033
- Figure 23: Middle East & Africa Dysphagia Friendly Food Revenue Share (%), by Type 2025 & 2033
- Figure 24: Middle East & Africa Dysphagia Friendly Food Revenue (undefined), by Country 2025 & 2033
- Figure 25: Middle East & Africa Dysphagia Friendly Food Revenue Share (%), by Country 2025 & 2033
- Figure 26: Asia Pacific Dysphagia Friendly Food Revenue (undefined), by Application 2025 & 2033
- Figure 27: Asia Pacific Dysphagia Friendly Food Revenue Share (%), by Application 2025 & 2033
- Figure 28: Asia Pacific Dysphagia Friendly Food Revenue (undefined), by Type 2025 & 2033
- Figure 29: Asia Pacific Dysphagia Friendly Food Revenue Share (%), by Type 2025 & 2033
- Figure 30: Asia Pacific Dysphagia Friendly Food Revenue (undefined), by Country 2025 & 2033
- Figure 31: Asia Pacific Dysphagia Friendly Food Revenue Share (%), by Country 2025 & 2033
List of Tables
- Table 1: Global Dysphagia Friendly Food Revenue undefined Forecast, by Application 2020 & 2033
- Table 2: Global Dysphagia Friendly Food Revenue undefined Forecast, by Type 2020 & 2033
- Table 3: Global Dysphagia Friendly Food Revenue undefined Forecast, by Region 2020 & 2033
- Table 4: Global Dysphagia Friendly Food Revenue undefined Forecast, by Application 2020 & 2033
- Table 5: Global Dysphagia Friendly Food Revenue undefined Forecast, by Type 2020 & 2033
- Table 6: Global Dysphagia Friendly Food Revenue undefined Forecast, by Country 2020 & 2033
- Table 7: United States Dysphagia Friendly Food Revenue (undefined) Forecast, by Application 2020 & 2033
- Table 8: Canada Dysphagia Friendly Food Revenue (undefined) Forecast, by Application 2020 & 2033
- Table 9: Mexico Dysphagia Friendly Food Revenue (undefined) Forecast, by Application 2020 & 2033
- Table 10: Global Dysphagia Friendly Food Revenue undefined Forecast, by Application 2020 & 2033
- Table 11: Global Dysphagia Friendly Food Revenue undefined Forecast, by Type 2020 & 2033
- Table 12: Global Dysphagia Friendly Food Revenue undefined Forecast, by Country 2020 & 2033
- Table 13: Brazil Dysphagia Friendly Food Revenue (undefined) Forecast, by Application 2020 & 2033
- Table 14: Argentina Dysphagia Friendly Food Revenue (undefined) Forecast, by Application 2020 & 2033
- Table 15: Rest of South America Dysphagia Friendly Food Revenue (undefined) Forecast, by Application 2020 & 2033
- Table 16: Global Dysphagia Friendly Food Revenue undefined Forecast, by Application 2020 & 2033
- Table 17: Global Dysphagia Friendly Food Revenue undefined Forecast, by Type 2020 & 2033
- Table 18: Global Dysphagia Friendly Food Revenue undefined Forecast, by Country 2020 & 2033
- Table 19: United Kingdom Dysphagia Friendly Food Revenue (undefined) Forecast, by Application 2020 & 2033
- Table 20: Germany Dysphagia Friendly Food Revenue (undefined) Forecast, by Application 2020 & 2033
- Table 21: France Dysphagia Friendly Food Revenue (undefined) Forecast, by Application 2020 & 2033
- Table 22: Italy Dysphagia Friendly Food Revenue (undefined) Forecast, by Application 2020 & 2033
- Table 23: Spain Dysphagia Friendly Food Revenue (undefined) Forecast, by Application 2020 & 2033
- Table 24: Russia Dysphagia Friendly Food Revenue (undefined) Forecast, by Application 2020 & 2033
- Table 25: Benelux Dysphagia Friendly Food Revenue (undefined) Forecast, by Application 2020 & 2033
- Table 26: Nordics Dysphagia Friendly Food Revenue (undefined) Forecast, by Application 2020 & 2033
- Table 27: Rest of Europe Dysphagia Friendly Food Revenue (undefined) Forecast, by Application 2020 & 2033
- Table 28: Global Dysphagia Friendly Food Revenue undefined Forecast, by Application 2020 & 2033
- Table 29: Global Dysphagia Friendly Food Revenue undefined Forecast, by Type 2020 & 2033
- Table 30: Global Dysphagia Friendly Food Revenue undefined Forecast, by Country 2020 & 2033
- Table 31: Turkey Dysphagia Friendly Food Revenue (undefined) Forecast, by Application 2020 & 2033
- Table 32: Israel Dysphagia Friendly Food Revenue (undefined) Forecast, by Application 2020 & 2033
- Table 33: GCC Dysphagia Friendly Food Revenue (undefined) Forecast, by Application 2020 & 2033
- Table 34: North Africa Dysphagia Friendly Food Revenue (undefined) Forecast, by Application 2020 & 2033
- Table 35: South Africa Dysphagia Friendly Food Revenue (undefined) Forecast, by Application 2020 & 2033
- Table 36: Rest of Middle East & Africa Dysphagia Friendly Food Revenue (undefined) Forecast, by Application 2020 & 2033
- Table 37: Global Dysphagia Friendly Food Revenue undefined Forecast, by Application 2020 & 2033
- Table 38: Global Dysphagia Friendly Food Revenue undefined Forecast, by Type 2020 & 2033
- Table 39: Global Dysphagia Friendly Food Revenue undefined Forecast, by Country 2020 & 2033
- Table 40: China Dysphagia Friendly Food Revenue (undefined) Forecast, by Application 2020 & 2033
- Table 41: India Dysphagia Friendly Food Revenue (undefined) Forecast, by Application 2020 & 2033
- Table 42: Japan Dysphagia Friendly Food Revenue (undefined) Forecast, by Application 2020 & 2033
- Table 43: South Korea Dysphagia Friendly Food Revenue (undefined) Forecast, by Application 2020 & 2033
- Table 44: ASEAN Dysphagia Friendly Food Revenue (undefined) Forecast, by Application 2020 & 2033
- Table 45: Oceania Dysphagia Friendly Food Revenue (undefined) Forecast, by Application 2020 & 2033
- Table 46: Rest of Asia Pacific Dysphagia Friendly Food Revenue (undefined) Forecast, by Application 2020 & 2033
Frequently Asked Questions
1. What is the projected Compound Annual Growth Rate (CAGR) of the Dysphagia Friendly Food?
The projected CAGR is approximately 7%.
2. Which companies are prominent players in the Dysphagia Friendly Food?
Key companies in the market include Maruha Nichiro, Kewpie, Ajinomoto, Hormel, Ever-smile, Asahi, Yayoi Sun Foods, Nestlé Health Science, Campbell, Nisshin, Hokko DELI, DAIREI, AEON TOPVALU, Tanaka Foods, NittoBest, Forica Foods, Senior Deli.
3. What are the main segments of the Dysphagia Friendly Food?
The market segments include Application, Type.
4. Can you provide details about the market size?
The market size is estimated to be USD XXX N/A as of 2022.
5. What are some drivers contributing to market growth?
N/A
6. What are the notable trends driving market growth?
N/A
7. Are there any restraints impacting market growth?
N/A
8. Can you provide examples of recent developments in the market?
N/A
9. What pricing options are available for accessing the report?
Pricing options include single-user, multi-user, and enterprise licenses priced at USD 3950.00, USD 5925.00, and USD 7900.00 respectively.
10. Is the market size provided in terms of value or volume?
The market size is provided in terms of value, measured in N/A.
11. Are there any specific market keywords associated with the report?
Yes, the market keyword associated with the report is "Dysphagia Friendly Food," which aids in identifying and referencing the specific market segment covered.
12. How do I determine which pricing option suits my needs best?
The pricing options vary based on user requirements and access needs. Individual users may opt for single-user licenses, while businesses requiring broader access may choose multi-user or enterprise licenses for cost-effective access to the report.
13. Are there any additional resources or data provided in the Dysphagia Friendly Food report?
While the report offers comprehensive insights, it's advisable to review the specific contents or supplementary materials provided to ascertain if additional resources or data are available.
14. How can I stay updated on further developments or reports in the Dysphagia Friendly Food?
To stay informed about further developments, trends, and reports in the Dysphagia Friendly Food, consider subscribing to industry newsletters, following relevant companies and organizations, or regularly checking reputable industry news sources and publications.
Methodology
Step 1 - Identification of Relevant Samples Size from Population Database


Step 2 - Approaches for Defining Global Market Size (Value, Volume* & Price*)

Note*: In applicable scenarios
Step 3 - Data Sources
Primary Research
- Web Analytics
- Survey Reports
- Research Institute
- Latest Research Reports
- Opinion Leaders
Secondary Research
- Annual Reports
- White Paper
- Latest Press Release
- Industry Association
- Paid Database
- Investor Presentations

Step 4 - Data Triangulation
Involves using different sources of information in order to increase the validity of a study
These sources are likely to be stakeholders in a program - participants, other researchers, program staff, other community members, and so on.
Then we put all data in single framework & apply various statistical tools to find out the dynamic on the market.
During the analysis stage, feedback from the stakeholder groups would be compared to determine areas of agreement as well as areas of divergence