

Key Insights
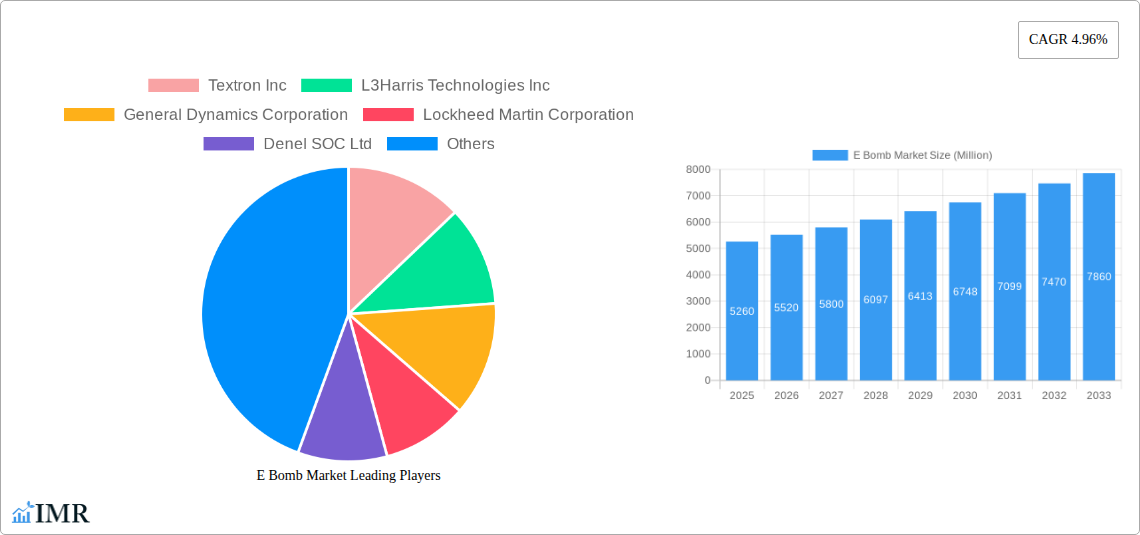
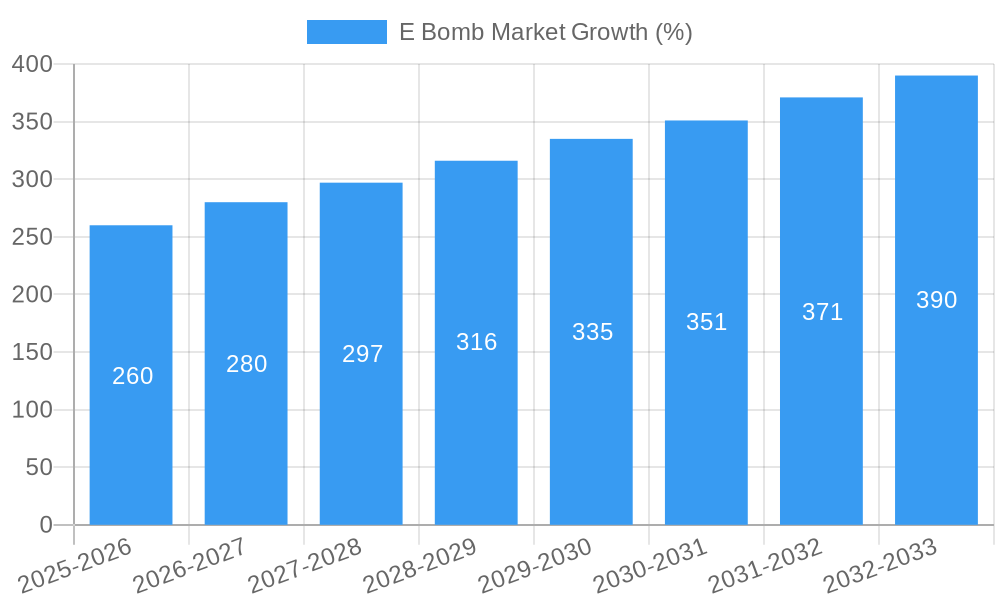
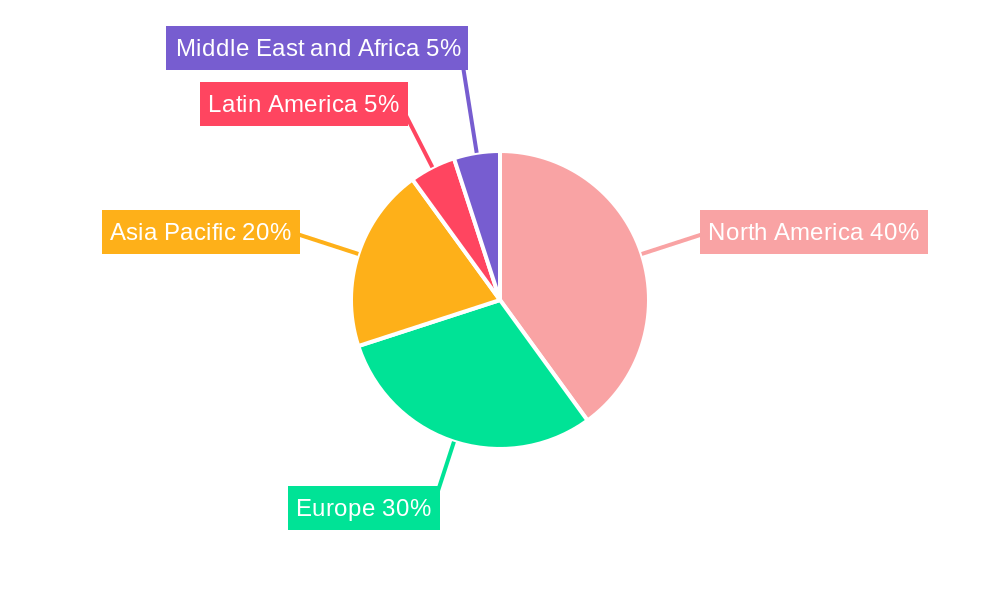
The Electromagnetic Bomb (E-Bomb) market, valued at $5.26 billion in 2025, is projected to experience robust growth, driven by escalating geopolitical tensions and the increasing need for advanced non-lethal warfare capabilities. A Compound Annual Growth Rate (CAGR) of 4.96% from 2025 to 2033 indicates a significant expansion of the market, reaching an estimated $7.8 billion by 2033. Key drivers include the modernization of military arsenals across various nations, the development of more sophisticated and targeted E-bomb technologies, and a growing demand for effective countermeasures against electronic warfare. Market segmentation reveals strong demand across all end-user segments (Army, Navy, Air Force), with the nuclear E-bomb segment potentially commanding a higher price point and driving substantial revenue. Regional analysis suggests North America and Europe will retain significant market share due to substantial defense budgets and technological advancements. However, the Asia-Pacific region is expected to witness the fastest growth, fueled by increased defense spending and technological adoption in countries like China and India. While potential regulatory hurdles and technological limitations could pose restraints, the overall market outlook remains positive, driven by ongoing research and development in the field and the persistent need for effective electronic warfare capabilities.
The competitive landscape is characterized by major defense contractors including Textron Inc, L3Harris Technologies Inc, General Dynamics Corporation, Lockheed Martin Corporation, Denel SOC Ltd, RTX Corporation, BAE Systems plc, Northrop Grumman Corporation, The Boeing Company, and the Defense Research and Development Organization (DRDO). These companies are actively engaged in developing advanced E-bomb technologies, focusing on enhancing their range, precision, and effectiveness. Strategic partnerships, mergers, and acquisitions are likely to further consolidate the market and shape the future competitive dynamics. The sustained demand for sophisticated electronic warfare systems across both conventional and asymmetric warfare scenarios will continue to propel market growth, although economic fluctuations and shifts in global geopolitical dynamics may influence the pace of expansion. This growth will be further facilitated by continuous advancements in high-power microwave technology and improvements in the targeting and delivery systems.
E Bomb Market Report: 2019-2033
This comprehensive report provides an in-depth analysis of the E Bomb Market, encompassing historical data (2019-2024), current estimates (2025), and future projections (2025-2033). It delves into market dynamics, growth trends, regional dominance, product landscapes, and key players, offering invaluable insights for industry professionals and strategic decision-makers. The report covers both parent (Electromagnetic Pulse Weapons Market) and child (E Bomb Market) markets for a holistic view. The market size is presented in Million units.
E Bomb Market Dynamics & Structure
The E Bomb market, a crucial segment of the Electromagnetic Pulse Weapons Market, is characterized by a moderately concentrated structure with key players holding significant market share. Technological innovation, particularly in high-power microwave (HPM) systems and advanced EMP warhead designs, is a primary growth driver. Stringent regulatory frameworks governing the development, testing, and deployment of E bombs significantly impact market dynamics. The market also faces competition from alternative defense technologies. End-user demographics, largely comprised of military branches (Army, Navy, Air Force), heavily influence market demand. M&A activity within the defense sector has been moderate, with a focus on consolidating technological capabilities and expanding market reach.
- Market Concentration: Moderately concentrated; top 5 players hold approximately xx% of market share (2024).
- Technological Innovation: HPM systems, advanced EMP warheads, and miniaturization are key drivers.
- Regulatory Framework: Stringent international treaties and national regulations impact market growth.
- Competitive Substitutes: Conventional weaponry, cyber warfare strategies, and other countermeasures pose competition.
- End-User Demographics: Predominantly military (Army: xx%, Navy: xx%, Air Force: xx%), with growing interest from homeland security agencies.
- M&A Trends: Moderate activity focusing on technology integration and geographic expansion; xx major deals in the past 5 years.
E Bomb Market Growth Trends & Insights
The E Bomb market has witnessed robust growth over the historical period (2019-2024), driven by increasing geopolitical instability and the need for advanced defense systems. The market size reached xx Million units in 2024, exhibiting a CAGR of xx% during this period. Technological disruptions, such as the development of more precise and effective HPM weapons, have accelerated adoption rates. Shifting consumer behavior, particularly increased government spending on defense modernization, further fuels market expansion. The forecast period (2025-2033) anticipates continued growth, with a projected CAGR of xx%, reaching xx Million units by 2033. Market penetration is expected to increase significantly in developing nations with growing defense budgets. Specific factors driving market growth include rising defense expenditure, technological advancements in weapon systems, and increased strategic partnerships between government and private contractors.
Dominant Regions, Countries, or Segments in E Bomb Market
North America currently dominates the E Bomb market, driven by substantial defense budgets, advanced technological capabilities, and a strong domestic defense industry. The US military’s significant investment in HPM weapon systems significantly contributes to this dominance. The Asia-Pacific region displays rapid growth potential, fueled by increasing defense spending and modernization efforts by several nations in the region. Within end-user segments, the Army currently accounts for the largest share of the market due to its need for battlefield dominance and suppression of enemy electronic systems. The Non-Nuclear segment holds a larger market share compared to the Nuclear segment due to lower development costs and deployment flexibility.
- North America: Strong domestic industry, high defense spending, technological advancements.
- Asia-Pacific: Rapidly growing defense budgets, regional geopolitical tensions.
- End-User Segment: Army (largest market share), followed by Air Force and Navy.
- Type: Non-Nuclear (larger market share due to cost and deployment advantages)
E Bomb Market Product Landscape
E Bomb technology encompasses a range of systems, from high-power microwave (HPM) weapons capable of disabling electronic equipment to advanced electromagnetic pulse (EMP) warheads designed to disrupt entire power grids. Key innovations include miniaturization of HPM systems for increased portability and deployment flexibility, improved energy efficiency, and the integration of advanced targeting and guidance systems. The unique selling propositions revolve around precise targeting, non-lethal effects (in non-nuclear variants), and the ability to disrupt enemy electronic warfare capabilities. Recent advancements include improved EMP shielding and hardening technologies.
Key Drivers, Barriers & Challenges in E Bomb Market
Key Drivers: Increased defense budgets globally, technological advancements in HPM and EMP technologies, growing demand for asymmetric warfare capabilities, and rising geopolitical tensions. For example, the increasing sophistication of drones necessitates countermeasures like HPM systems.
Challenges and Restraints: Stringent regulations concerning the development and deployment of E-bombs, high development and production costs, ethical concerns regarding the potential for collateral damage, and the emergence of effective countermeasures. The cost of developing sophisticated EMP shielding technologies acts as a substantial barrier to widespread adoption.
Emerging Opportunities in E Bomb Market
Untapped markets in developing nations with growing defense spending represent significant opportunities. Innovative applications, such as using E bombs for counter-drone operations or protecting critical infrastructure from cyber attacks, are gaining traction. The development of more precise and directed-energy weapons offers significant growth potential.
Growth Accelerators in the E Bomb Market Industry
Technological breakthroughs in areas such as HPM generation and EMP shielding will accelerate market growth. Strategic partnerships between government agencies and private defense contractors will lead to faster innovation and development. Expansion into new markets and applications will create further opportunities.
Key Players Shaping the E Bomb Market Market
- Textron Inc
- L3Harris Technologies Inc
- General Dynamics Corporation
- Lockheed Martin Corporation
- Denel SOC Ltd
- RTX Corporation
- BAE Systems plc
- Northrop Grumman Corporation
- The Boeing Company
- Defense Research and Development Organization (DRDO)
Notable Milestones in E Bomb Market Sector
- January 2023: Epirus receives a USD 66 million contract from the US Army for its Leonidas HPM system, signifying growing interest in directed-energy weapons.
- October 2021: China's development of a hypersonic missile with a non-nuclear EMP warhead highlights the strategic importance of this technology.
In-Depth E Bomb Market Market Outlook
The E Bomb market is poised for sustained growth, driven by ongoing technological advancements, increasing geopolitical instability, and the growing need for effective countermeasures against sophisticated threats. Strategic partnerships and investments in R&D will shape the future landscape. The market's evolution will heavily depend on the balance between technological innovation, regulatory oversight, and ethical considerations. Opportunities abound for companies that can deliver innovative, cost-effective, and reliable E-bomb solutions.
E Bomb Market Segmentation
-
1. End User
- 1.1. Army
- 1.2. Navy
- 1.3. Air Force
-
2. Type
- 2.1. Nuclear
- 2.2. Non-Nuclear
E Bomb Market Segmentation By Geography
-
1. North America
- 1.1. United States
- 1.2. Canada
-
2. Europe
- 2.1. United Kingdom
- 2.2. France
- 2.3. Germany
- 2.4. Russia
- 2.5. Rest of Europe
-
3. Asia Pacific
- 3.1. China
- 3.2. India
- 3.3. Japan
- 3.4. South Korea
- 3.5. Rest of Asia Pacific
-
4. Latin America
- 4.1. Brazil
- 4.2. Rest of Latin America
-
5. Middle East and Africa
- 5.1. Saudi Arabia
- 5.2. United Arab Emirates
- 5.3. Egypt
- 5.4. Rest of Middle East and Africa
E Bomb Market REPORT HIGHLIGHTS
| Aspects | Details |
|---|---|
| Study Period | 2019-2033 |
| Base Year | 2024 |
| Estimated Year | 2025 |
| Forecast Period | 2025-2033 |
| Historical Period | 2019-2024 |
| Growth Rate | CAGR of 4.96% from 2019-2033 |
| Segmentation |
|
Table of Contents
- 1. Introduction
- 1.1. Research Scope
- 1.2. Market Segmentation
- 1.3. Research Methodology
- 1.4. Definitions and Assumptions
- 2. Executive Summary
- 2.1. Introduction
- 3. Market Dynamics
- 3.1. Introduction
- 3.2. Market Drivers
- 3.3. Market Restrains
- 3.4. Market Trends
- 3.4.1. Air Force Segment is Expected to Show Highest Growth During the Forecast Period
- 4. Market Factor Analysis
- 4.1. Porters Five Forces
- 4.2. Supply/Value Chain
- 4.3. PESTEL analysis
- 4.4. Market Entropy
- 4.5. Patent/Trademark Analysis
- 5. Global E Bomb Market Analysis, Insights and Forecast, 2019-2031
- 5.1. Market Analysis, Insights and Forecast - by End User
- 5.1.1. Army
- 5.1.2. Navy
- 5.1.3. Air Force
- 5.2. Market Analysis, Insights and Forecast - by Type
- 5.2.1. Nuclear
- 5.2.2. Non-Nuclear
- 5.3. Market Analysis, Insights and Forecast - by Region
- 5.3.1. North America
- 5.3.2. Europe
- 5.3.3. Asia Pacific
- 5.3.4. Latin America
- 5.3.5. Middle East and Africa
- 5.1. Market Analysis, Insights and Forecast - by End User
- 6. North America E Bomb Market Analysis, Insights and Forecast, 2019-2031
- 6.1. Market Analysis, Insights and Forecast - by End User
- 6.1.1. Army
- 6.1.2. Navy
- 6.1.3. Air Force
- 6.2. Market Analysis, Insights and Forecast - by Type
- 6.2.1. Nuclear
- 6.2.2. Non-Nuclear
- 6.1. Market Analysis, Insights and Forecast - by End User
- 7. Europe E Bomb Market Analysis, Insights and Forecast, 2019-2031
- 7.1. Market Analysis, Insights and Forecast - by End User
- 7.1.1. Army
- 7.1.2. Navy
- 7.1.3. Air Force
- 7.2. Market Analysis, Insights and Forecast - by Type
- 7.2.1. Nuclear
- 7.2.2. Non-Nuclear
- 7.1. Market Analysis, Insights and Forecast - by End User
- 8. Asia Pacific E Bomb Market Analysis, Insights and Forecast, 2019-2031
- 8.1. Market Analysis, Insights and Forecast - by End User
- 8.1.1. Army
- 8.1.2. Navy
- 8.1.3. Air Force
- 8.2. Market Analysis, Insights and Forecast - by Type
- 8.2.1. Nuclear
- 8.2.2. Non-Nuclear
- 8.1. Market Analysis, Insights and Forecast - by End User
- 9. Latin America E Bomb Market Analysis, Insights and Forecast, 2019-2031
- 9.1. Market Analysis, Insights and Forecast - by End User
- 9.1.1. Army
- 9.1.2. Navy
- 9.1.3. Air Force
- 9.2. Market Analysis, Insights and Forecast - by Type
- 9.2.1. Nuclear
- 9.2.2. Non-Nuclear
- 9.1. Market Analysis, Insights and Forecast - by End User
- 10. Middle East and Africa E Bomb Market Analysis, Insights and Forecast, 2019-2031
- 10.1. Market Analysis, Insights and Forecast - by End User
- 10.1.1. Army
- 10.1.2. Navy
- 10.1.3. Air Force
- 10.2. Market Analysis, Insights and Forecast - by Type
- 10.2.1. Nuclear
- 10.2.2. Non-Nuclear
- 10.1. Market Analysis, Insights and Forecast - by End User
- 11. North America E Bomb Market Analysis, Insights and Forecast, 2019-2031
- 11.1. Market Analysis, Insights and Forecast - By Country/Sub-region
- 11.1.1 United States
- 11.1.2 Canada
- 12. Europe E Bomb Market Analysis, Insights and Forecast, 2019-2031
- 12.1. Market Analysis, Insights and Forecast - By Country/Sub-region
- 12.1.1 United Kingdom
- 12.1.2 France
- 12.1.3 Germany
- 12.1.4 Russia
- 12.1.5 Rest of Europe
- 13. Asia Pacific E Bomb Market Analysis, Insights and Forecast, 2019-2031
- 13.1. Market Analysis, Insights and Forecast - By Country/Sub-region
- 13.1.1 China
- 13.1.2 India
- 13.1.3 Japan
- 13.1.4 South Korea
- 13.1.5 Rest of Asia Pacific
- 14. Latin America E Bomb Market Analysis, Insights and Forecast, 2019-2031
- 14.1. Market Analysis, Insights and Forecast - By Country/Sub-region
- 14.1.1 Brazil
- 14.1.2 Rest of Latin America
- 15. Middle East and Africa E Bomb Market Analysis, Insights and Forecast, 2019-2031
- 15.1. Market Analysis, Insights and Forecast - By Country/Sub-region
- 15.1.1 Saudi Arabia
- 15.1.2 United Arab Emirates
- 15.1.3 Egypt
- 15.1.4 Rest of Middle East and Africa
- 16. Competitive Analysis
- 16.1. Global Market Share Analysis 2024
- 16.2. Company Profiles
- 16.2.1 Textron Inc
- 16.2.1.1. Overview
- 16.2.1.2. Products
- 16.2.1.3. SWOT Analysis
- 16.2.1.4. Recent Developments
- 16.2.1.5. Financials (Based on Availability)
- 16.2.2 L3Harris Technologies Inc
- 16.2.2.1. Overview
- 16.2.2.2. Products
- 16.2.2.3. SWOT Analysis
- 16.2.2.4. Recent Developments
- 16.2.2.5. Financials (Based on Availability)
- 16.2.3 General Dynamics Corporation
- 16.2.3.1. Overview
- 16.2.3.2. Products
- 16.2.3.3. SWOT Analysis
- 16.2.3.4. Recent Developments
- 16.2.3.5. Financials (Based on Availability)
- 16.2.4 Lockheed Martin Corporation
- 16.2.4.1. Overview
- 16.2.4.2. Products
- 16.2.4.3. SWOT Analysis
- 16.2.4.4. Recent Developments
- 16.2.4.5. Financials (Based on Availability)
- 16.2.5 Denel SOC Ltd
- 16.2.5.1. Overview
- 16.2.5.2. Products
- 16.2.5.3. SWOT Analysis
- 16.2.5.4. Recent Developments
- 16.2.5.5. Financials (Based on Availability)
- 16.2.6 RTX Corporation
- 16.2.6.1. Overview
- 16.2.6.2. Products
- 16.2.6.3. SWOT Analysis
- 16.2.6.4. Recent Developments
- 16.2.6.5. Financials (Based on Availability)
- 16.2.7 BAE Systems plc
- 16.2.7.1. Overview
- 16.2.7.2. Products
- 16.2.7.3. SWOT Analysis
- 16.2.7.4. Recent Developments
- 16.2.7.5. Financials (Based on Availability)
- 16.2.8 Northrop Grumman Corporation
- 16.2.8.1. Overview
- 16.2.8.2. Products
- 16.2.8.3. SWOT Analysis
- 16.2.8.4. Recent Developments
- 16.2.8.5. Financials (Based on Availability)
- 16.2.9 The Boeing Company
- 16.2.9.1. Overview
- 16.2.9.2. Products
- 16.2.9.3. SWOT Analysis
- 16.2.9.4. Recent Developments
- 16.2.9.5. Financials (Based on Availability)
- 16.2.10 Defense Research and Development Organization (DRDO
- 16.2.10.1. Overview
- 16.2.10.2. Products
- 16.2.10.3. SWOT Analysis
- 16.2.10.4. Recent Developments
- 16.2.10.5. Financials (Based on Availability)
- 16.2.1 Textron Inc
List of Figures
- Figure 1: Global E Bomb Market Revenue Breakdown (Million, %) by Region 2024 & 2032
- Figure 2: North America E Bomb Market Revenue (Million), by Country 2024 & 2032
- Figure 3: North America E Bomb Market Revenue Share (%), by Country 2024 & 2032
- Figure 4: Europe E Bomb Market Revenue (Million), by Country 2024 & 2032
- Figure 5: Europe E Bomb Market Revenue Share (%), by Country 2024 & 2032
- Figure 6: Asia Pacific E Bomb Market Revenue (Million), by Country 2024 & 2032
- Figure 7: Asia Pacific E Bomb Market Revenue Share (%), by Country 2024 & 2032
- Figure 8: Latin America E Bomb Market Revenue (Million), by Country 2024 & 2032
- Figure 9: Latin America E Bomb Market Revenue Share (%), by Country 2024 & 2032
- Figure 10: Middle East and Africa E Bomb Market Revenue (Million), by Country 2024 & 2032
- Figure 11: Middle East and Africa E Bomb Market Revenue Share (%), by Country 2024 & 2032
- Figure 12: North America E Bomb Market Revenue (Million), by End User 2024 & 2032
- Figure 13: North America E Bomb Market Revenue Share (%), by End User 2024 & 2032
- Figure 14: North America E Bomb Market Revenue (Million), by Type 2024 & 2032
- Figure 15: North America E Bomb Market Revenue Share (%), by Type 2024 & 2032
- Figure 16: North America E Bomb Market Revenue (Million), by Country 2024 & 2032
- Figure 17: North America E Bomb Market Revenue Share (%), by Country 2024 & 2032
- Figure 18: Europe E Bomb Market Revenue (Million), by End User 2024 & 2032
- Figure 19: Europe E Bomb Market Revenue Share (%), by End User 2024 & 2032
- Figure 20: Europe E Bomb Market Revenue (Million), by Type 2024 & 2032
- Figure 21: Europe E Bomb Market Revenue Share (%), by Type 2024 & 2032
- Figure 22: Europe E Bomb Market Revenue (Million), by Country 2024 & 2032
- Figure 23: Europe E Bomb Market Revenue Share (%), by Country 2024 & 2032
- Figure 24: Asia Pacific E Bomb Market Revenue (Million), by End User 2024 & 2032
- Figure 25: Asia Pacific E Bomb Market Revenue Share (%), by End User 2024 & 2032
- Figure 26: Asia Pacific E Bomb Market Revenue (Million), by Type 2024 & 2032
- Figure 27: Asia Pacific E Bomb Market Revenue Share (%), by Type 2024 & 2032
- Figure 28: Asia Pacific E Bomb Market Revenue (Million), by Country 2024 & 2032
- Figure 29: Asia Pacific E Bomb Market Revenue Share (%), by Country 2024 & 2032
- Figure 30: Latin America E Bomb Market Revenue (Million), by End User 2024 & 2032
- Figure 31: Latin America E Bomb Market Revenue Share (%), by End User 2024 & 2032
- Figure 32: Latin America E Bomb Market Revenue (Million), by Type 2024 & 2032
- Figure 33: Latin America E Bomb Market Revenue Share (%), by Type 2024 & 2032
- Figure 34: Latin America E Bomb Market Revenue (Million), by Country 2024 & 2032
- Figure 35: Latin America E Bomb Market Revenue Share (%), by Country 2024 & 2032
- Figure 36: Middle East and Africa E Bomb Market Revenue (Million), by End User 2024 & 2032
- Figure 37: Middle East and Africa E Bomb Market Revenue Share (%), by End User 2024 & 2032
- Figure 38: Middle East and Africa E Bomb Market Revenue (Million), by Type 2024 & 2032
- Figure 39: Middle East and Africa E Bomb Market Revenue Share (%), by Type 2024 & 2032
- Figure 40: Middle East and Africa E Bomb Market Revenue (Million), by Country 2024 & 2032
- Figure 41: Middle East and Africa E Bomb Market Revenue Share (%), by Country 2024 & 2032
List of Tables
- Table 1: Global E Bomb Market Revenue Million Forecast, by Region 2019 & 2032
- Table 2: Global E Bomb Market Revenue Million Forecast, by End User 2019 & 2032
- Table 3: Global E Bomb Market Revenue Million Forecast, by Type 2019 & 2032
- Table 4: Global E Bomb Market Revenue Million Forecast, by Region 2019 & 2032
- Table 5: Global E Bomb Market Revenue Million Forecast, by Country 2019 & 2032
- Table 6: United States E Bomb Market Revenue (Million) Forecast, by Application 2019 & 2032
- Table 7: Canada E Bomb Market Revenue (Million) Forecast, by Application 2019 & 2032
- Table 8: Global E Bomb Market Revenue Million Forecast, by Country 2019 & 2032
- Table 9: United Kingdom E Bomb Market Revenue (Million) Forecast, by Application 2019 & 2032
- Table 10: France E Bomb Market Revenue (Million) Forecast, by Application 2019 & 2032
- Table 11: Germany E Bomb Market Revenue (Million) Forecast, by Application 2019 & 2032
- Table 12: Russia E Bomb Market Revenue (Million) Forecast, by Application 2019 & 2032
- Table 13: Rest of Europe E Bomb Market Revenue (Million) Forecast, by Application 2019 & 2032
- Table 14: Global E Bomb Market Revenue Million Forecast, by Country 2019 & 2032
- Table 15: China E Bomb Market Revenue (Million) Forecast, by Application 2019 & 2032
- Table 16: India E Bomb Market Revenue (Million) Forecast, by Application 2019 & 2032
- Table 17: Japan E Bomb Market Revenue (Million) Forecast, by Application 2019 & 2032
- Table 18: South Korea E Bomb Market Revenue (Million) Forecast, by Application 2019 & 2032
- Table 19: Rest of Asia Pacific E Bomb Market Revenue (Million) Forecast, by Application 2019 & 2032
- Table 20: Global E Bomb Market Revenue Million Forecast, by Country 2019 & 2032
- Table 21: Brazil E Bomb Market Revenue (Million) Forecast, by Application 2019 & 2032
- Table 22: Rest of Latin America E Bomb Market Revenue (Million) Forecast, by Application 2019 & 2032
- Table 23: Global E Bomb Market Revenue Million Forecast, by Country 2019 & 2032
- Table 24: Saudi Arabia E Bomb Market Revenue (Million) Forecast, by Application 2019 & 2032
- Table 25: United Arab Emirates E Bomb Market Revenue (Million) Forecast, by Application 2019 & 2032
- Table 26: Egypt E Bomb Market Revenue (Million) Forecast, by Application 2019 & 2032
- Table 27: Rest of Middle East and Africa E Bomb Market Revenue (Million) Forecast, by Application 2019 & 2032
- Table 28: Global E Bomb Market Revenue Million Forecast, by End User 2019 & 2032
- Table 29: Global E Bomb Market Revenue Million Forecast, by Type 2019 & 2032
- Table 30: Global E Bomb Market Revenue Million Forecast, by Country 2019 & 2032
- Table 31: United States E Bomb Market Revenue (Million) Forecast, by Application 2019 & 2032
- Table 32: Canada E Bomb Market Revenue (Million) Forecast, by Application 2019 & 2032
- Table 33: Global E Bomb Market Revenue Million Forecast, by End User 2019 & 2032
- Table 34: Global E Bomb Market Revenue Million Forecast, by Type 2019 & 2032
- Table 35: Global E Bomb Market Revenue Million Forecast, by Country 2019 & 2032
- Table 36: United Kingdom E Bomb Market Revenue (Million) Forecast, by Application 2019 & 2032
- Table 37: France E Bomb Market Revenue (Million) Forecast, by Application 2019 & 2032
- Table 38: Germany E Bomb Market Revenue (Million) Forecast, by Application 2019 & 2032
- Table 39: Russia E Bomb Market Revenue (Million) Forecast, by Application 2019 & 2032
- Table 40: Rest of Europe E Bomb Market Revenue (Million) Forecast, by Application 2019 & 2032
- Table 41: Global E Bomb Market Revenue Million Forecast, by End User 2019 & 2032
- Table 42: Global E Bomb Market Revenue Million Forecast, by Type 2019 & 2032
- Table 43: Global E Bomb Market Revenue Million Forecast, by Country 2019 & 2032
- Table 44: China E Bomb Market Revenue (Million) Forecast, by Application 2019 & 2032
- Table 45: India E Bomb Market Revenue (Million) Forecast, by Application 2019 & 2032
- Table 46: Japan E Bomb Market Revenue (Million) Forecast, by Application 2019 & 2032
- Table 47: South Korea E Bomb Market Revenue (Million) Forecast, by Application 2019 & 2032
- Table 48: Rest of Asia Pacific E Bomb Market Revenue (Million) Forecast, by Application 2019 & 2032
- Table 49: Global E Bomb Market Revenue Million Forecast, by End User 2019 & 2032
- Table 50: Global E Bomb Market Revenue Million Forecast, by Type 2019 & 2032
- Table 51: Global E Bomb Market Revenue Million Forecast, by Country 2019 & 2032
- Table 52: Brazil E Bomb Market Revenue (Million) Forecast, by Application 2019 & 2032
- Table 53: Rest of Latin America E Bomb Market Revenue (Million) Forecast, by Application 2019 & 2032
- Table 54: Global E Bomb Market Revenue Million Forecast, by End User 2019 & 2032
- Table 55: Global E Bomb Market Revenue Million Forecast, by Type 2019 & 2032
- Table 56: Global E Bomb Market Revenue Million Forecast, by Country 2019 & 2032
- Table 57: Saudi Arabia E Bomb Market Revenue (Million) Forecast, by Application 2019 & 2032
- Table 58: United Arab Emirates E Bomb Market Revenue (Million) Forecast, by Application 2019 & 2032
- Table 59: Egypt E Bomb Market Revenue (Million) Forecast, by Application 2019 & 2032
- Table 60: Rest of Middle East and Africa E Bomb Market Revenue (Million) Forecast, by Application 2019 & 2032
Frequently Asked Questions
1. What is the projected Compound Annual Growth Rate (CAGR) of the E Bomb Market?
The projected CAGR is approximately 4.96%.
2. Which companies are prominent players in the E Bomb Market?
Key companies in the market include Textron Inc, L3Harris Technologies Inc, General Dynamics Corporation, Lockheed Martin Corporation, Denel SOC Ltd, RTX Corporation, BAE Systems plc, Northrop Grumman Corporation, The Boeing Company, Defense Research and Development Organization (DRDO.
3. What are the main segments of the E Bomb Market?
The market segments include End User, Type.
4. Can you provide details about the market size?
The market size is estimated to be USD 5.26 Million as of 2022.
5. What are some drivers contributing to market growth?
N/A
6. What are the notable trends driving market growth?
Air Force Segment is Expected to Show Highest Growth During the Forecast Period.
7. Are there any restraints impacting market growth?
N/A
8. Can you provide examples of recent developments in the market?
January 2023: Epirus received a contract worth USD 66 million from the US Army's Rapid Capabilities and Critical Technologies Office for prototypes of its Leonidas high-power microwave system that can kill drones by zapping their electronics. The Leonidas system will support the US Army's Indirect Fire Protection Capability-High-Power Microwave Program.
9. What pricing options are available for accessing the report?
Pricing options include single-user, multi-user, and enterprise licenses priced at USD 4750, USD 5250, and USD 8750 respectively.
10. Is the market size provided in terms of value or volume?
The market size is provided in terms of value, measured in Million.
11. Are there any specific market keywords associated with the report?
Yes, the market keyword associated with the report is "E Bomb Market," which aids in identifying and referencing the specific market segment covered.
12. How do I determine which pricing option suits my needs best?
The pricing options vary based on user requirements and access needs. Individual users may opt for single-user licenses, while businesses requiring broader access may choose multi-user or enterprise licenses for cost-effective access to the report.
13. Are there any additional resources or data provided in the E Bomb Market report?
While the report offers comprehensive insights, it's advisable to review the specific contents or supplementary materials provided to ascertain if additional resources or data are available.
14. How can I stay updated on further developments or reports in the E Bomb Market?
To stay informed about further developments, trends, and reports in the E Bomb Market, consider subscribing to industry newsletters, following relevant companies and organizations, or regularly checking reputable industry news sources and publications.
Methodology
Step 1 - Identification of Relevant Samples Size from Population Database


Step 2 - Approaches for Defining Global Market Size (Value, Volume* & Price*)

Note*: In applicable scenarios
Step 3 - Data Sources
Primary Research
- Web Analytics
- Survey Reports
- Research Institute
- Latest Research Reports
- Opinion Leaders
Secondary Research
- Annual Reports
- White Paper
- Latest Press Release
- Industry Association
- Paid Database
- Investor Presentations

Step 4 - Data Triangulation
Involves using different sources of information in order to increase the validity of a study
These sources are likely to be stakeholders in a program - participants, other researchers, program staff, other community members, and so on.
Then we put all data in single framework & apply various statistical tools to find out the dynamic on the market.
During the analysis stage, feedback from the stakeholder groups would be compared to determine areas of agreement as well as areas of divergence
