

Key Insights
The global Energy Audit market is poised for significant expansion, projected to reach an estimated $0.35 billion by 2025. This robust growth is underpinned by a compelling Compound Annual Growth Rate (CAGR) of 8%, indicating sustained momentum throughout the forecast period from 2025 to 2033. The market's trajectory is primarily driven by a confluence of factors including escalating energy costs, increasing regulatory pressures for energy efficiency, and a growing corporate commitment to sustainability and carbon footprint reduction. Industries across building materials, lighting, transportation, and a broad "Others" segment are actively seeking energy audit services to optimize consumption, identify cost-saving opportunities, and comply with evolving environmental standards. The rising awareness of climate change and the imperative for businesses to adopt eco-friendly practices are further amplifying the demand for these essential assessments.
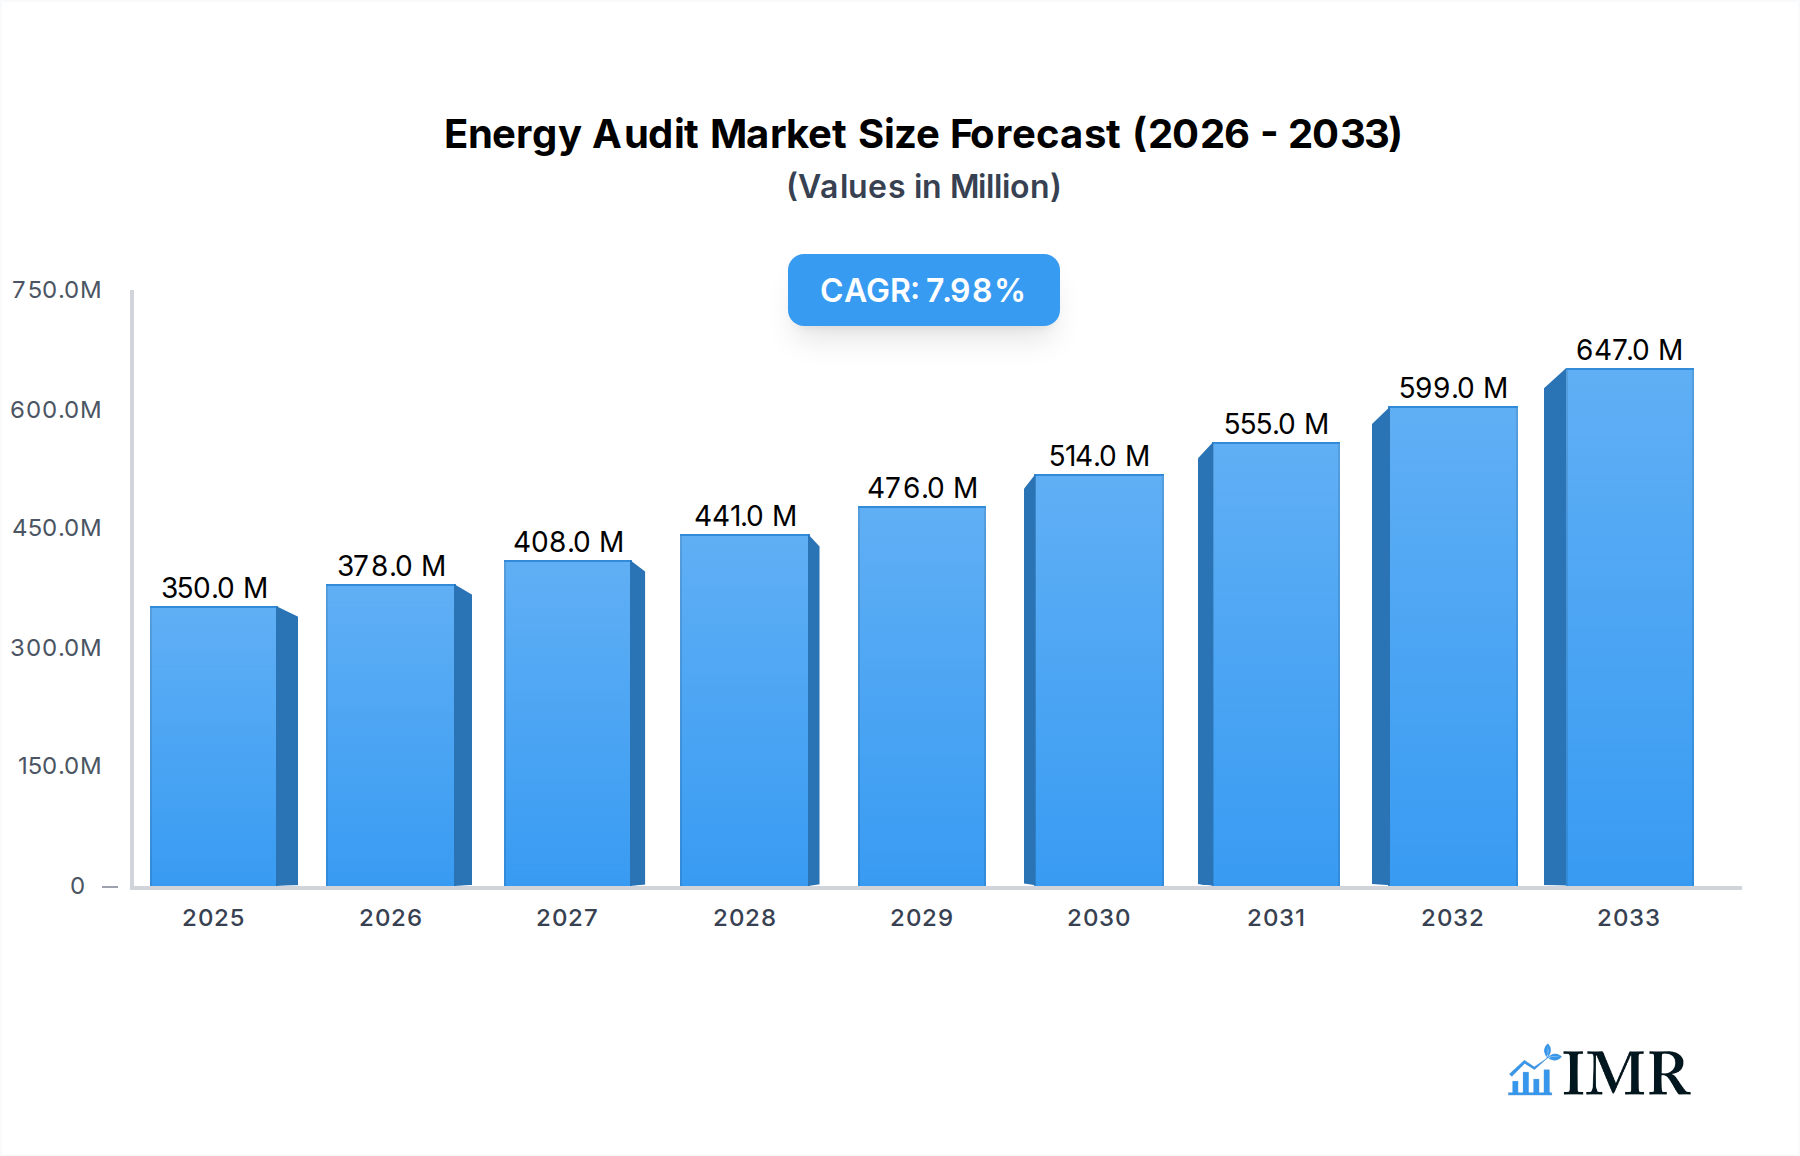
Energy Audit Market Size (In Million)
The Energy Audit market is further segmented by the type of audit offered, encompassing Preliminary Energy Audits for initial assessments, Comprehensive Energy Audits for in-depth analysis, and Special Energy Audits for targeted evaluations. This diversity caters to a wide spectrum of client needs, from small enterprises seeking basic energy efficiency guidance to large industrial complexes requiring intricate operational analyses. Key players like HQTS, SGS, and NORESCO are at the forefront, offering specialized solutions and technological advancements to meet the dynamic demands of this sector. The market's expansion is also influenced by ongoing trends such as the integration of advanced analytics, IoT-enabled monitoring, and AI-driven recommendations, which enhance the accuracy and actionable insights derived from energy audits. While the market exhibits strong growth, potential restraints may include the initial investment costs associated with comprehensive audits for some smaller businesses and the availability of skilled energy auditors, though these are being addressed by industry consolidation and specialized training initiatives.

Energy Audit Company Market Share
This comprehensive report delves into the dynamic energy audit market, providing an in-depth analysis of its structure, growth trajectories, and future potential. Covering the period from 2019 to 2033, with a base and estimated year of 2025, this research is an essential resource for industry professionals seeking to understand the evolving landscape of energy efficiency solutions. The report meticulously examines market dynamics, growth trends, dominant segments, product innovations, key drivers, barriers, emerging opportunities, and growth accelerators, all while highlighting the strategies of leading companies and significant industry milestones.
The global energy audit market is projected to reach a substantial value, estimated to grow from \$xx billion in 2025 to \$xx billion by 2033, exhibiting a Compound Annual Growth Rate (CAGR) of xx%. This growth is fueled by increasing awareness of climate change, stringent government regulations mandating energy efficiency, and the pursuit of operational cost reductions across various industries. The report segments the market by application and type, offering granular insights into specific sectors and service offerings.
Key market players profiled include HQTS, SGS, WESSLING GmbH, NORESCO, DB Energy, Höppner Management & Consultant GmbH, Ekodoma, HRL Technology, ProCycla, CMC Energy Services, Home Works Energy, ProEnergy, Synergy Companies, Green Audit USA, Carroll Energy Solutions, and Home Energy Medics. The analysis leverages extensive historical data (2019-2024) and robust forecasting (2025-2033) to provide actionable intelligence.
Energy Audit Market Dynamics & Structure
The energy audit market exhibits a moderately concentrated structure, with a mix of established global players and specialized regional providers. Technological innovation is a primary driver, with advancements in data analytics, IoT sensors, and AI-powered diagnostics enabling more precise and effective energy assessments. Regulatory frameworks, such as energy performance standards and incentives for energy efficiency upgrades, play a crucial role in shaping market demand and adoption rates. Competitive product substitutes include in-house energy management teams and less comprehensive energy assessments, though these often lack the depth and expertise of professional energy audits. End-user demographics span residential, commercial, and industrial sectors, each with unique energy consumption patterns and audit requirements. Mergers and acquisitions (M&A) trends indicate consolidation among larger players aiming to expand service portfolios and geographical reach, while smaller firms focus on niche markets or specialized audit types.
- Market Concentration: Dominated by a few key players, but with significant room for niche specialists.
- Technological Innovation: Driven by AI, IoT, and advanced data analytics for enhanced accuracy.
- Regulatory Frameworks: Stringent mandates and incentives are key market shapers.
- Competitive Substitutes: In-house solutions and basic assessments are less comprehensive.
- End-User Demographics: Broad spectrum from residential to industrial clients.
- M&A Trends: Consolidation for portfolio expansion and market dominance.
Energy Audit Growth Trends & Insights
The energy audit market is experiencing robust growth, driven by a confluence of economic, environmental, and technological factors. The market size is projected to expand significantly, with adoption rates of energy audits accelerating across all sectors. Consumers and businesses are increasingly recognizing the dual benefits of energy audits: substantial cost savings through reduced energy consumption and enhanced environmental responsibility. Technological disruptions, such as the integration of Building Information Modeling (BIM) with energy audit software and the development of more sophisticated diagnostic tools, are revolutionizing the accuracy and scope of audits. Consumer behavior shifts are evident, with a growing preference for sustainable practices and a proactive approach to energy management. The market penetration of comprehensive energy audits is rising, particularly in commercial and industrial segments where the ROI is more pronounced. Forecasts indicate a sustained upward trajectory, underscoring the critical role of energy audits in achieving global sustainability goals and optimizing energy resource utilization. The integration of smart meter data and advanced analytics further refines the audit process, leading to more tailored and impactful recommendations.
- Market Size Evolution: Significant growth projected, driven by increasing demand.
- Adoption Rates: Accelerating across residential, commercial, and industrial sectors.
- Technological Disruptions: AI, IoT, and BIM integration are transforming audit methodologies.
- Consumer Behavior Shifts: Growing preference for sustainability and proactive energy management.
- Market Penetration: Increasing adoption of comprehensive audit services.
Dominant Regions, Countries, or Segments in Energy Audit
The Building Material Department segment, within the Application category, is emerging as a dominant force in the global energy audit market. This dominance is driven by a heightened awareness of the significant energy consumption associated with the lifecycle of building materials, from manufacturing to installation and long-term performance. Stringent building codes and energy efficiency standards globally are compelling developers and manufacturers to invest in energy audits to optimize their products and processes. Countries with robust construction industries and a strong commitment to sustainable building practices are leading this trend.
Comprehensive Energy Audits, as a Type, are witnessing the highest growth and adoption rates within the energy audit market. This is due to their thoroughness in identifying all potential energy saving opportunities, encompassing a detailed analysis of energy use across an entire facility or system. The increasing complexity of energy consumption patterns and the desire for maximum cost savings are driving demand for these in-depth assessments over preliminary or specialized audits.
- Dominant Application Segment: Building Material Department, driven by construction regulations and sustainability demands.
- Dominant Type Segment: Comprehensive Energy Audits, offering in-depth analysis and maximum savings potential.
- Key Drivers: Stricter building codes, evolving sustainability standards, and the pursuit of significant cost reductions.
- Regional Influence: Growth particularly strong in regions with advanced construction sectors and environmental policies.
- Market Share & Growth Potential: Comprehensive audits and building material-focused services are poised for substantial expansion.
Energy Audit Product Landscape
The energy audit product landscape is characterized by continuous innovation, focusing on enhancing accuracy, efficiency, and user-friendliness. Advanced diagnostic tools, such as infrared thermography cameras and ultrasonic leak detectors, are now standard in comprehensive audits, enabling the precise identification of energy waste. Software solutions are increasingly incorporating AI and machine learning to analyze vast datasets, providing deeper insights into energy consumption patterns and predictive maintenance. The applications range from detailed building envelope assessments to optimizing HVAC systems and industrial machinery. Unique selling propositions lie in the ability of these products to deliver quantifiable energy savings and a clear return on investment, supported by detailed reporting and actionable recommendations. Technological advancements are also leading to more portable and integrated audit kits, facilitating on-site data collection and analysis.
Key Drivers, Barriers & Challenges in Energy Audit
Key Drivers: The primary forces propelling the energy audit market are increasing global energy costs, stringent environmental regulations mandating energy efficiency, and growing corporate social responsibility initiatives. Technological advancements, particularly in data analytics and smart metering, are also significant drivers, enabling more precise and cost-effective audits. Government incentives and subsidies for energy efficiency upgrades further accelerate market growth.
Key Barriers & Challenges: Supply chain disruptions for specialized audit equipment can pose a challenge. Regulatory hurdles, such as varying standards across different regions, can create complexity. Intense competition from a growing number of providers, including some offering less comprehensive services, can put pressure on pricing. The initial cost of comprehensive energy audits, although offering long-term savings, can be a barrier for smaller businesses.
Emerging Opportunities in Energy Audit
Emerging opportunities in the energy audit market are abundant, particularly in the development of smart building technologies and the integration of renewable energy solutions. The increasing demand for retrofitting older buildings to meet modern energy efficiency standards presents a significant untapped market. Furthermore, the rise of electric vehicles and the need for optimized charging infrastructure create new avenues for specialized energy audits in the transport sector. Evolving consumer preferences for sustainable living and a desire to reduce their carbon footprint are also driving demand for residential energy audits. The application of AI and machine learning for predictive energy management, going beyond traditional audit scopes, represents a key innovation frontier.
Growth Accelerators in the Energy Audit Industry
Technological breakthroughs, such as the miniaturization of sophisticated sensors and the advancement of cloud-based data platforms, are key growth accelerators. Strategic partnerships between audit firms and technology providers are enabling the development of integrated solutions that offer a seamless customer experience. Market expansion strategies, including targeting new geographical regions with increasing energy efficiency mandates and developing specialized audit services for emerging industries like data centers and vertical farming, are further fueling growth. The increasing focus on energy resilience and security also positions energy audits as a critical tool for optimizing resource allocation and minimizing vulnerabilities.
Key Players Shaping the Energy Audit Market
- HQTS
- SGS
- WESSLING GmbH
- NORESCO
- DB Energy
- Höppner Management & Consultant GmbH
- Ekodoma
- HRL Technology
- ProCycla
- CMC Energy Services
- Home Works Energy
- ProEnergy
- Synergy Companies
- Green Audit USA
- Carroll Energy Solutions
- Home Energy Medics
Notable Milestones in Energy Audit Sector
- 2019: Increased governmental focus on energy efficiency policies globally, leading to a rise in mandated audits.
- 2020: Widespread adoption of remote audit technologies due to global events, accelerating digital transformation.
- 2021: Introduction of advanced AI-powered analytics for energy consumption prediction.
- 2022: Growing integration of IoT sensors for real-time energy monitoring in audits.
- 2023: Enhanced regulatory push for decarbonization in the building sector, boosting demand for specialized audits.
- 2024: Emergence of comprehensive ESG (Environmental, Social, and Governance) reporting frameworks, where energy audits play a crucial role.
In-Depth Energy Audit Market Outlook
The future outlook for the energy audit market is exceptionally bright, driven by an unyielding commitment to sustainability and operational efficiency. Growth accelerators will continue to be fueled by technological innovation, particularly in the areas of predictive analytics and smart grid integration, leading to more proactive and intelligent energy management. Strategic partnerships between audit providers and technology firms will foster the development of holistic energy solutions. Market expansion will see a deeper penetration into emerging economies and the development of specialized audit services for nascent industries. The increasing emphasis on energy resilience and security will further solidify the indispensable role of energy audits in safeguarding critical infrastructure and optimizing resource utilization for a sustainable future.
Energy Audit Segmentation
-
1. Application
- 1.1. Building Material Department
- 1.2. Lighting Department
- 1.3. Transport Department
- 1.4. Others
-
2. Types
- 2.1. Preliminary Energy Audit
- 2.2. Comprehensive Energy Audit
- 2.3. Special Energy Audit
Energy Audit Segmentation By Geography
-
1. North America
- 1.1. United States
- 1.2. Canada
- 1.3. Mexico
-
2. South America
- 2.1. Brazil
- 2.2. Argentina
- 2.3. Rest of South America
-
3. Europe
- 3.1. United Kingdom
- 3.2. Germany
- 3.3. France
- 3.4. Italy
- 3.5. Spain
- 3.6. Russia
- 3.7. Benelux
- 3.8. Nordics
- 3.9. Rest of Europe
-
4. Middle East & Africa
- 4.1. Turkey
- 4.2. Israel
- 4.3. GCC
- 4.4. North Africa
- 4.5. South Africa
- 4.6. Rest of Middle East & Africa
-
5. Asia Pacific
- 5.1. China
- 5.2. India
- 5.3. Japan
- 5.4. South Korea
- 5.5. ASEAN
- 5.6. Oceania
- 5.7. Rest of Asia Pacific
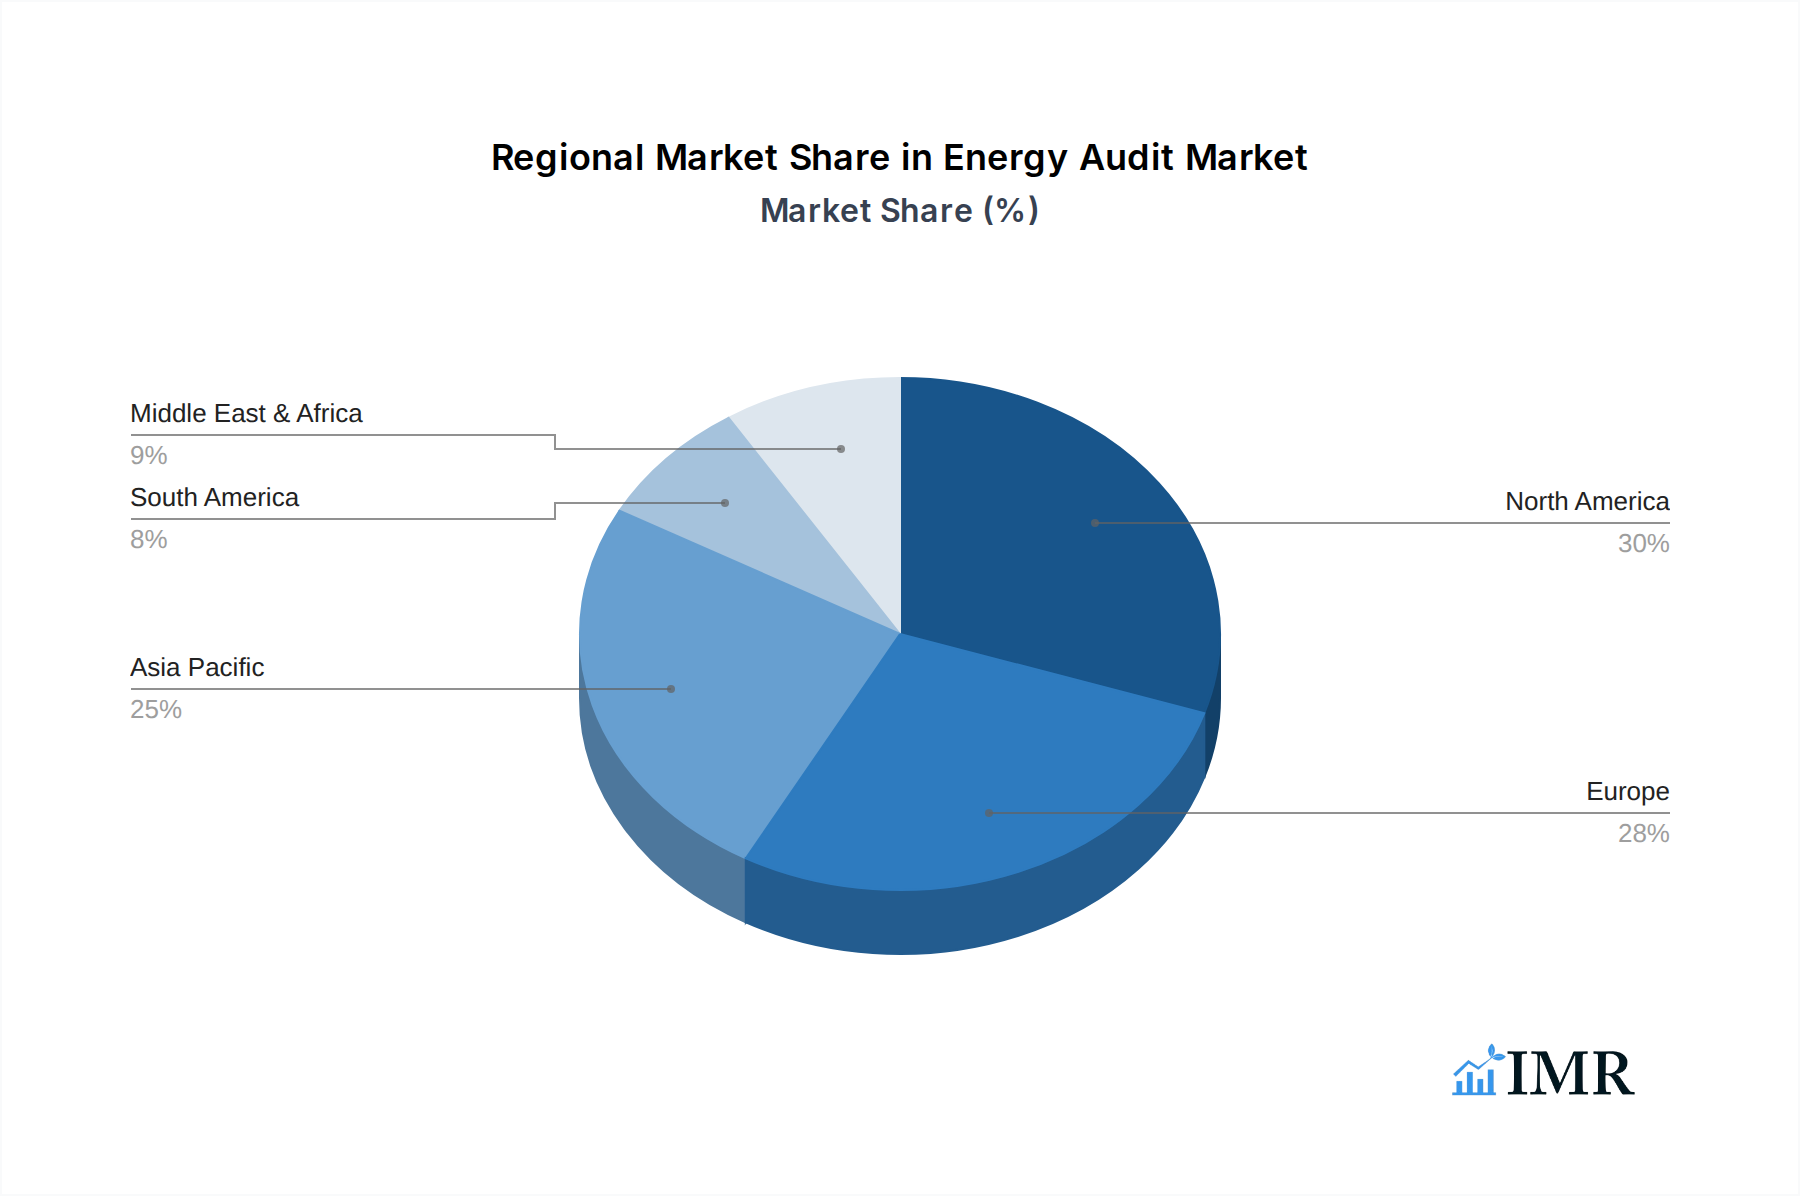
Energy Audit Regional Market Share
Geographic Coverage of Energy Audit
Energy Audit REPORT HIGHLIGHTS
| Aspects | Details |
|---|---|
| Study Period | 2020-2034 |
| Base Year | 2025 |
| Estimated Year | 2026 |
| Forecast Period | 2026-2034 |
| Historical Period | 2020-2025 |
| Growth Rate | CAGR of 8% from 2020-2034 |
| Segmentation |
|
Table of Contents
- 1. Introduction
- 1.1. Research Scope
- 1.2. Market Segmentation
- 1.3. Research Objective
- 1.4. Definitions and Assumptions
- 2. Executive Summary
- 2.1. Market Snapshot
- 3. Market Dynamics
- 3.1. Market Drivers
- 3.2. Market Restrains
- 3.3. Market Trends
- 3.4. Market Opportunities
- 4. Market Factor Analysis
- 4.1. Porters Five Forces
- 4.1.1. Bargaining Power of Suppliers
- 4.1.2. Bargaining Power of Buyers
- 4.1.3. Threat of New Entrants
- 4.1.4. Threat of Substitutes
- 4.1.5. Competitive Rivalry
- 4.2. PESTEL analysis
- 4.3. BCG Analysis
- 4.3.1. Stars (High Growth, High Market Share)
- 4.3.2. Cash Cows (Low Growth, High Market Share)
- 4.3.3. Question Mark (High Growth, Low Market Share)
- 4.3.4. Dogs (Low Growth, Low Market Share)
- 4.4. Ansoff Matrix Analysis
- 4.5. Supply Chain Analysis
- 4.6. Regulatory Landscape
- 4.7. Current Market Potential and Opportunity Assessment (TAM–SAM–SOM Framework)
- 4.8. IMR Analyst Note
- 4.1. Porters Five Forces
- 5. Market Analysis, Insights and Forecast 2021-2033
- 5.1. Market Analysis, Insights and Forecast - by Application
- 5.1.1. Building Material Department
- 5.1.2. Lighting Department
- 5.1.3. Transport Department
- 5.1.4. Others
- 5.2. Market Analysis, Insights and Forecast - by Types
- 5.2.1. Preliminary Energy Audit
- 5.2.2. Comprehensive Energy Audit
- 5.2.3. Special Energy Audit
- 5.3. Market Analysis, Insights and Forecast - by Region
- 5.3.1. North America
- 5.3.2. South America
- 5.3.3. Europe
- 5.3.4. Middle East & Africa
- 5.3.5. Asia Pacific
- 5.1. Market Analysis, Insights and Forecast - by Application
- 6. Global Energy Audit Analysis, Insights and Forecast, 2021-2033
- 6.1. Market Analysis, Insights and Forecast - by Application
- 6.1.1. Building Material Department
- 6.1.2. Lighting Department
- 6.1.3. Transport Department
- 6.1.4. Others
- 6.2. Market Analysis, Insights and Forecast - by Types
- 6.2.1. Preliminary Energy Audit
- 6.2.2. Comprehensive Energy Audit
- 6.2.3. Special Energy Audit
- 6.1. Market Analysis, Insights and Forecast - by Application
- 7. North America Energy Audit Analysis, Insights and Forecast, 2020-2032
- 7.1. Market Analysis, Insights and Forecast - by Application
- 7.1.1. Building Material Department
- 7.1.2. Lighting Department
- 7.1.3. Transport Department
- 7.1.4. Others
- 7.2. Market Analysis, Insights and Forecast - by Types
- 7.2.1. Preliminary Energy Audit
- 7.2.2. Comprehensive Energy Audit
- 7.2.3. Special Energy Audit
- 7.1. Market Analysis, Insights and Forecast - by Application
- 8. South America Energy Audit Analysis, Insights and Forecast, 2020-2032
- 8.1. Market Analysis, Insights and Forecast - by Application
- 8.1.1. Building Material Department
- 8.1.2. Lighting Department
- 8.1.3. Transport Department
- 8.1.4. Others
- 8.2. Market Analysis, Insights and Forecast - by Types
- 8.2.1. Preliminary Energy Audit
- 8.2.2. Comprehensive Energy Audit
- 8.2.3. Special Energy Audit
- 8.1. Market Analysis, Insights and Forecast - by Application
- 9. Europe Energy Audit Analysis, Insights and Forecast, 2020-2032
- 9.1. Market Analysis, Insights and Forecast - by Application
- 9.1.1. Building Material Department
- 9.1.2. Lighting Department
- 9.1.3. Transport Department
- 9.1.4. Others
- 9.2. Market Analysis, Insights and Forecast - by Types
- 9.2.1. Preliminary Energy Audit
- 9.2.2. Comprehensive Energy Audit
- 9.2.3. Special Energy Audit
- 9.1. Market Analysis, Insights and Forecast - by Application
- 10. Middle East & Africa Energy Audit Analysis, Insights and Forecast, 2020-2032
- 10.1. Market Analysis, Insights and Forecast - by Application
- 10.1.1. Building Material Department
- 10.1.2. Lighting Department
- 10.1.3. Transport Department
- 10.1.4. Others
- 10.2. Market Analysis, Insights and Forecast - by Types
- 10.2.1. Preliminary Energy Audit
- 10.2.2. Comprehensive Energy Audit
- 10.2.3. Special Energy Audit
- 10.1. Market Analysis, Insights and Forecast - by Application
- 11. Asia Pacific Energy Audit Analysis, Insights and Forecast, 2020-2032
- 11.1. Market Analysis, Insights and Forecast - by Application
- 11.1.1. Building Material Department
- 11.1.2. Lighting Department
- 11.1.3. Transport Department
- 11.1.4. Others
- 11.2. Market Analysis, Insights and Forecast - by Types
- 11.2.1. Preliminary Energy Audit
- 11.2.2. Comprehensive Energy Audit
- 11.2.3. Special Energy Audit
- 11.1. Market Analysis, Insights and Forecast - by Application
- 12. Competitive Analysis
- 12.1. Company Profiles
- 12.1.1 HQTS
- 12.1.1.1. Company Overview
- 12.1.1.2. Products
- 12.1.1.3. Company Financials
- 12.1.1.4. SWOT Analysis
- 12.1.2 SGS
- 12.1.2.1. Company Overview
- 12.1.2.2. Products
- 12.1.2.3. Company Financials
- 12.1.2.4. SWOT Analysis
- 12.1.3 WESSLING GmbH
- 12.1.3.1. Company Overview
- 12.1.3.2. Products
- 12.1.3.3. Company Financials
- 12.1.3.4. SWOT Analysis
- 12.1.4 NORESCO
- 12.1.4.1. Company Overview
- 12.1.4.2. Products
- 12.1.4.3. Company Financials
- 12.1.4.4. SWOT Analysis
- 12.1.5 DB Energy
- 12.1.5.1. Company Overview
- 12.1.5.2. Products
- 12.1.5.3. Company Financials
- 12.1.5.4. SWOT Analysis
- 12.1.6 Höppner Management & Consultant GmbH
- 12.1.6.1. Company Overview
- 12.1.6.2. Products
- 12.1.6.3. Company Financials
- 12.1.6.4. SWOT Analysis
- 12.1.7 Ekodoma
- 12.1.7.1. Company Overview
- 12.1.7.2. Products
- 12.1.7.3. Company Financials
- 12.1.7.4. SWOT Analysis
- 12.1.8 HRL Technology
- 12.1.8.1. Company Overview
- 12.1.8.2. Products
- 12.1.8.3. Company Financials
- 12.1.8.4. SWOT Analysis
- 12.1.9 ProCycla
- 12.1.9.1. Company Overview
- 12.1.9.2. Products
- 12.1.9.3. Company Financials
- 12.1.9.4. SWOT Analysis
- 12.1.10 CMC Energy Services
- 12.1.10.1. Company Overview
- 12.1.10.2. Products
- 12.1.10.3. Company Financials
- 12.1.10.4. SWOT Analysis
- 12.1.11 Home Works Energy
- 12.1.11.1. Company Overview
- 12.1.11.2. Products
- 12.1.11.3. Company Financials
- 12.1.11.4. SWOT Analysis
- 12.1.12 ProEnergy
- 12.1.12.1. Company Overview
- 12.1.12.2. Products
- 12.1.12.3. Company Financials
- 12.1.12.4. SWOT Analysis
- 12.1.13 Synergy Companies
- 12.1.13.1. Company Overview
- 12.1.13.2. Products
- 12.1.13.3. Company Financials
- 12.1.13.4. SWOT Analysis
- 12.1.14 Green Audit USA
- 12.1.14.1. Company Overview
- 12.1.14.2. Products
- 12.1.14.3. Company Financials
- 12.1.14.4. SWOT Analysis
- 12.1.15 Carroll Energy Solutions
- 12.1.15.1. Company Overview
- 12.1.15.2. Products
- 12.1.15.3. Company Financials
- 12.1.15.4. SWOT Analysis
- 12.1.16 Home Energy Medics
- 12.1.16.1. Company Overview
- 12.1.16.2. Products
- 12.1.16.3. Company Financials
- 12.1.16.4. SWOT Analysis
- 12.1.1 HQTS
- 12.2. Market Entropy
- 12.2.1 Company's Key Areas Served
- 12.2.2 Recent Developments
- 12.3. Company Market Share Analysis 2025
- 12.3.1 Top 5 Companies Market Share Analysis
- 12.3.2 Top 3 Companies Market Share Analysis
- 12.4. List of Potential Customers
- 13. Research Methodology
List of Figures
- Figure 1: Global Energy Audit Revenue Breakdown (undefined, %) by Region 2025 & 2033
- Figure 2: North America Energy Audit Revenue (undefined), by Application 2025 & 2033
- Figure 3: North America Energy Audit Revenue Share (%), by Application 2025 & 2033
- Figure 4: North America Energy Audit Revenue (undefined), by Types 2025 & 2033
- Figure 5: North America Energy Audit Revenue Share (%), by Types 2025 & 2033
- Figure 6: North America Energy Audit Revenue (undefined), by Country 2025 & 2033
- Figure 7: North America Energy Audit Revenue Share (%), by Country 2025 & 2033
- Figure 8: South America Energy Audit Revenue (undefined), by Application 2025 & 2033
- Figure 9: South America Energy Audit Revenue Share (%), by Application 2025 & 2033
- Figure 10: South America Energy Audit Revenue (undefined), by Types 2025 & 2033
- Figure 11: South America Energy Audit Revenue Share (%), by Types 2025 & 2033
- Figure 12: South America Energy Audit Revenue (undefined), by Country 2025 & 2033
- Figure 13: South America Energy Audit Revenue Share (%), by Country 2025 & 2033
- Figure 14: Europe Energy Audit Revenue (undefined), by Application 2025 & 2033
- Figure 15: Europe Energy Audit Revenue Share (%), by Application 2025 & 2033
- Figure 16: Europe Energy Audit Revenue (undefined), by Types 2025 & 2033
- Figure 17: Europe Energy Audit Revenue Share (%), by Types 2025 & 2033
- Figure 18: Europe Energy Audit Revenue (undefined), by Country 2025 & 2033
- Figure 19: Europe Energy Audit Revenue Share (%), by Country 2025 & 2033
- Figure 20: Middle East & Africa Energy Audit Revenue (undefined), by Application 2025 & 2033
- Figure 21: Middle East & Africa Energy Audit Revenue Share (%), by Application 2025 & 2033
- Figure 22: Middle East & Africa Energy Audit Revenue (undefined), by Types 2025 & 2033
- Figure 23: Middle East & Africa Energy Audit Revenue Share (%), by Types 2025 & 2033
- Figure 24: Middle East & Africa Energy Audit Revenue (undefined), by Country 2025 & 2033
- Figure 25: Middle East & Africa Energy Audit Revenue Share (%), by Country 2025 & 2033
- Figure 26: Asia Pacific Energy Audit Revenue (undefined), by Application 2025 & 2033
- Figure 27: Asia Pacific Energy Audit Revenue Share (%), by Application 2025 & 2033
- Figure 28: Asia Pacific Energy Audit Revenue (undefined), by Types 2025 & 2033
- Figure 29: Asia Pacific Energy Audit Revenue Share (%), by Types 2025 & 2033
- Figure 30: Asia Pacific Energy Audit Revenue (undefined), by Country 2025 & 2033
- Figure 31: Asia Pacific Energy Audit Revenue Share (%), by Country 2025 & 2033
List of Tables
- Table 1: Global Energy Audit Revenue undefined Forecast, by Application 2020 & 2033
- Table 2: Global Energy Audit Revenue undefined Forecast, by Types 2020 & 2033
- Table 3: Global Energy Audit Revenue undefined Forecast, by Region 2020 & 2033
- Table 4: Global Energy Audit Revenue undefined Forecast, by Application 2020 & 2033
- Table 5: Global Energy Audit Revenue undefined Forecast, by Types 2020 & 2033
- Table 6: Global Energy Audit Revenue undefined Forecast, by Country 2020 & 2033
- Table 7: United States Energy Audit Revenue (undefined) Forecast, by Application 2020 & 2033
- Table 8: Canada Energy Audit Revenue (undefined) Forecast, by Application 2020 & 2033
- Table 9: Mexico Energy Audit Revenue (undefined) Forecast, by Application 2020 & 2033
- Table 10: Global Energy Audit Revenue undefined Forecast, by Application 2020 & 2033
- Table 11: Global Energy Audit Revenue undefined Forecast, by Types 2020 & 2033
- Table 12: Global Energy Audit Revenue undefined Forecast, by Country 2020 & 2033
- Table 13: Brazil Energy Audit Revenue (undefined) Forecast, by Application 2020 & 2033
- Table 14: Argentina Energy Audit Revenue (undefined) Forecast, by Application 2020 & 2033
- Table 15: Rest of South America Energy Audit Revenue (undefined) Forecast, by Application 2020 & 2033
- Table 16: Global Energy Audit Revenue undefined Forecast, by Application 2020 & 2033
- Table 17: Global Energy Audit Revenue undefined Forecast, by Types 2020 & 2033
- Table 18: Global Energy Audit Revenue undefined Forecast, by Country 2020 & 2033
- Table 19: United Kingdom Energy Audit Revenue (undefined) Forecast, by Application 2020 & 2033
- Table 20: Germany Energy Audit Revenue (undefined) Forecast, by Application 2020 & 2033
- Table 21: France Energy Audit Revenue (undefined) Forecast, by Application 2020 & 2033
- Table 22: Italy Energy Audit Revenue (undefined) Forecast, by Application 2020 & 2033
- Table 23: Spain Energy Audit Revenue (undefined) Forecast, by Application 2020 & 2033
- Table 24: Russia Energy Audit Revenue (undefined) Forecast, by Application 2020 & 2033
- Table 25: Benelux Energy Audit Revenue (undefined) Forecast, by Application 2020 & 2033
- Table 26: Nordics Energy Audit Revenue (undefined) Forecast, by Application 2020 & 2033
- Table 27: Rest of Europe Energy Audit Revenue (undefined) Forecast, by Application 2020 & 2033
- Table 28: Global Energy Audit Revenue undefined Forecast, by Application 2020 & 2033
- Table 29: Global Energy Audit Revenue undefined Forecast, by Types 2020 & 2033
- Table 30: Global Energy Audit Revenue undefined Forecast, by Country 2020 & 2033
- Table 31: Turkey Energy Audit Revenue (undefined) Forecast, by Application 2020 & 2033
- Table 32: Israel Energy Audit Revenue (undefined) Forecast, by Application 2020 & 2033
- Table 33: GCC Energy Audit Revenue (undefined) Forecast, by Application 2020 & 2033
- Table 34: North Africa Energy Audit Revenue (undefined) Forecast, by Application 2020 & 2033
- Table 35: South Africa Energy Audit Revenue (undefined) Forecast, by Application 2020 & 2033
- Table 36: Rest of Middle East & Africa Energy Audit Revenue (undefined) Forecast, by Application 2020 & 2033
- Table 37: Global Energy Audit Revenue undefined Forecast, by Application 2020 & 2033
- Table 38: Global Energy Audit Revenue undefined Forecast, by Types 2020 & 2033
- Table 39: Global Energy Audit Revenue undefined Forecast, by Country 2020 & 2033
- Table 40: China Energy Audit Revenue (undefined) Forecast, by Application 2020 & 2033
- Table 41: India Energy Audit Revenue (undefined) Forecast, by Application 2020 & 2033
- Table 42: Japan Energy Audit Revenue (undefined) Forecast, by Application 2020 & 2033
- Table 43: South Korea Energy Audit Revenue (undefined) Forecast, by Application 2020 & 2033
- Table 44: ASEAN Energy Audit Revenue (undefined) Forecast, by Application 2020 & 2033
- Table 45: Oceania Energy Audit Revenue (undefined) Forecast, by Application 2020 & 2033
- Table 46: Rest of Asia Pacific Energy Audit Revenue (undefined) Forecast, by Application 2020 & 2033
Frequently Asked Questions
1. What is the projected Compound Annual Growth Rate (CAGR) of the Energy Audit?
The projected CAGR is approximately 8%.
2. Which companies are prominent players in the Energy Audit?
Key companies in the market include HQTS, SGS, WESSLING GmbH, NORESCO, DB Energy, Höppner Management & Consultant GmbH, Ekodoma, HRL Technology, ProCycla, CMC Energy Services, Home Works Energy, ProEnergy, Synergy Companies, Green Audit USA, Carroll Energy Solutions, Home Energy Medics.
3. What are the main segments of the Energy Audit?
The market segments include Application, Types.
4. Can you provide details about the market size?
The market size is estimated to be USD XXX N/A as of 2022.
5. What are some drivers contributing to market growth?
N/A
6. What are the notable trends driving market growth?
N/A
7. Are there any restraints impacting market growth?
N/A
8. Can you provide examples of recent developments in the market?
N/A
9. What pricing options are available for accessing the report?
Pricing options include single-user, multi-user, and enterprise licenses priced at USD 4900.00, USD 7350.00, and USD 9800.00 respectively.
10. Is the market size provided in terms of value or volume?
The market size is provided in terms of value, measured in N/A.
11. Are there any specific market keywords associated with the report?
Yes, the market keyword associated with the report is "Energy Audit," which aids in identifying and referencing the specific market segment covered.
12. How do I determine which pricing option suits my needs best?
The pricing options vary based on user requirements and access needs. Individual users may opt for single-user licenses, while businesses requiring broader access may choose multi-user or enterprise licenses for cost-effective access to the report.
13. Are there any additional resources or data provided in the Energy Audit report?
While the report offers comprehensive insights, it's advisable to review the specific contents or supplementary materials provided to ascertain if additional resources or data are available.
14. How can I stay updated on further developments or reports in the Energy Audit?
To stay informed about further developments, trends, and reports in the Energy Audit, consider subscribing to industry newsletters, following relevant companies and organizations, or regularly checking reputable industry news sources and publications.
Methodology
Step 1 - Identification of Relevant Samples Size from Population Database


Step 2 - Approaches for Defining Global Market Size (Value, Volume* & Price*)

Note*: In applicable scenarios
Step 3 - Data Sources
Primary Research
- Web Analytics
- Survey Reports
- Research Institute
- Latest Research Reports
- Opinion Leaders
Secondary Research
- Annual Reports
- White Paper
- Latest Press Release
- Industry Association
- Paid Database
- Investor Presentations

Step 4 - Data Triangulation
Involves using different sources of information in order to increase the validity of a study
These sources are likely to be stakeholders in a program - participants, other researchers, program staff, other community members, and so on.
Then we put all data in single framework & apply various statistical tools to find out the dynamic on the market.
During the analysis stage, feedback from the stakeholder groups would be compared to determine areas of agreement as well as areas of divergence