

Key Insights
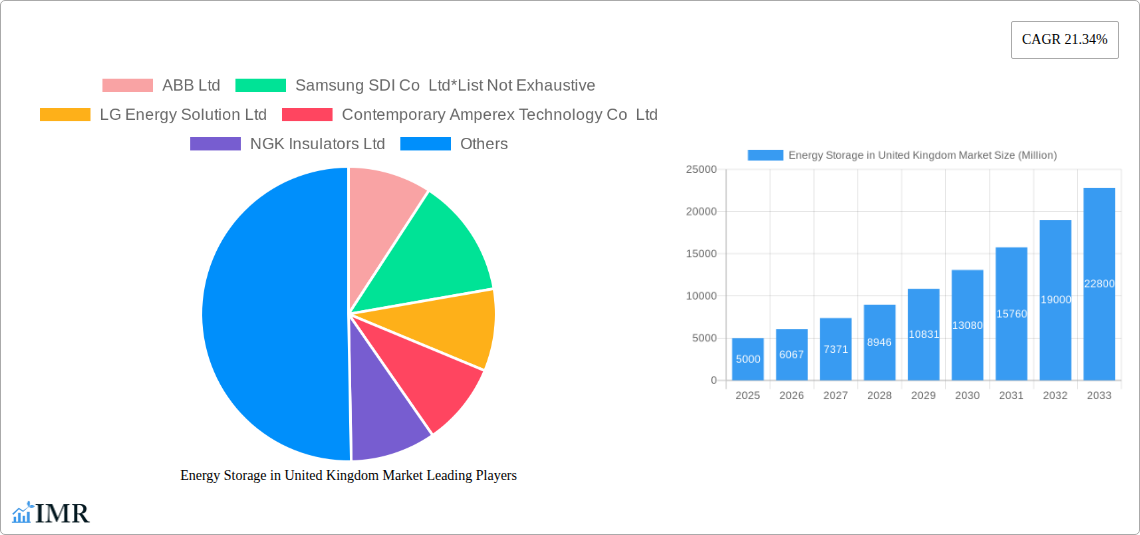
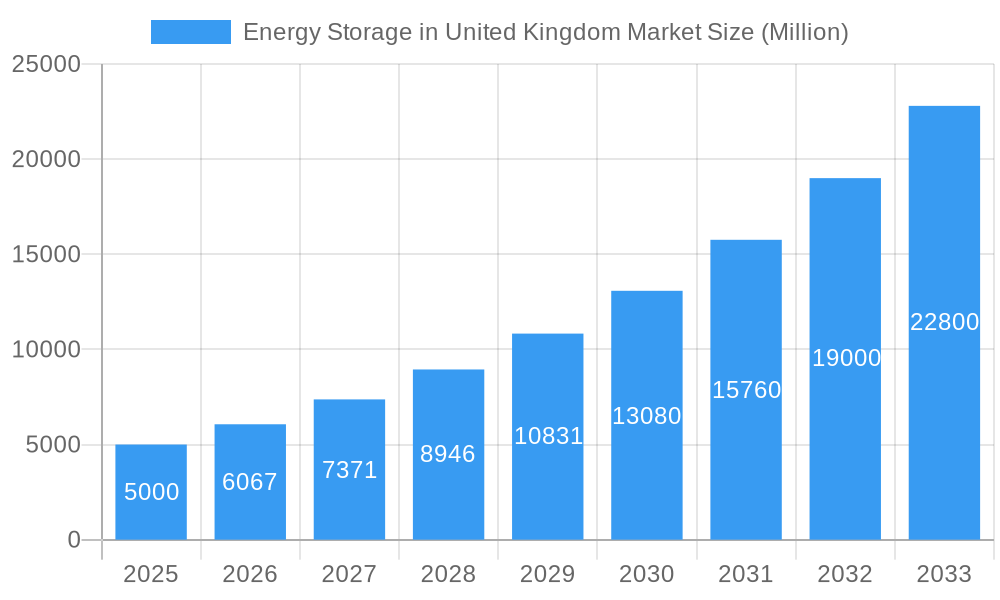
The United Kingdom's energy storage market is poised for substantial expansion, driven by the increasing integration of renewable energy sources, supportive government decarbonization policies, and escalating electricity prices. With a projected market size of 6872 million in the base year 2025, and a Compound Annual Growth Rate (CAGR) of 19.57%, the market is expected to witness significant growth through 2033. Key growth catalysts include the imperative for grid stability and resilience, the inherent intermittency of renewables like solar and wind, and the growing demand for reliable backup power across residential and commercial sectors. Battery storage technologies, benefiting from advancements and cost reductions, and pumped-storage hydroelectricity (PSH), leveraging established infrastructure, are identified as key growth segments. However, high upfront investment and regulatory complexities present ongoing challenges.
Energy Storage in United Kingdom Market Market Size (In Billion)
Leading global players, including ABB, Samsung SDI, LG Energy Solution, and Tesla, are actively influencing market dynamics through innovation, strategic alliances, and capacity expansion. Government incentives and proactive policies are expected to further accelerate adoption. The commercial and industrial sector is anticipated to lead in application adoption, with the residential sector following as costs decline. While this analysis focuses on the UK, understanding broader European energy storage trends and global developments is vital for a complete market perspective. Evolving geopolitical landscapes and future energy policies will also shape the market's growth trajectory.
Energy Storage in United Kingdom Market Company Market Share
Energy Storage in the United Kingdom Market: A Comprehensive Report (2019-2033)
This comprehensive report provides an in-depth analysis of the UK energy storage market, encompassing market dynamics, growth trends, key players, and future outlook. With a detailed examination of market segments – including Batteries, Pumped-storage Hydroelectricity (PSH), and Other Types – and applications across Residential, Commercial & Industrial (C&I) sectors, this report is an essential resource for industry professionals, investors, and policymakers. The study period covers 2019-2033, with a base year of 2025 and a forecast period spanning 2025-2033.
Key Market Players Analyzed: ABB Ltd, Samsung SDI Co Ltd, LG Energy Solution Ltd, Contemporary Amperex Technology Co Ltd, NGK Insulators Ltd, Electricite de France SA (EDF), Wartsila Oyj Abp, Tesla Inc, Siemens Energy AG, General Electric Company (List Not Exhaustive)
Energy Storage in United Kingdom Market Dynamics & Structure
The UK energy storage market is characterized by increasing market concentration, driven by significant investments and mergers & acquisitions (M&A). Technological innovation, particularly in battery storage technologies, is a major driver, while regulatory frameworks and supportive government policies are shaping market growth. Competition exists from traditional power generation methods, but the increasing need for grid stability and renewable energy integration is creating strong demand.
- Market Concentration: The market is becoming increasingly consolidated, with larger players acquiring smaller companies and expanding their market share. In 2024, the top 5 players held approximately xx% of the market share.
- Technological Innovation: Advancements in battery chemistry (e.g., lithium-ion), improved energy density, and reduced costs are key innovation drivers. Challenges include improving longevity, safety, and recycling infrastructure.
- Regulatory Framework: Government policies supporting renewable energy integration and grid modernization are creating favorable conditions for energy storage deployment. However, regulatory hurdles related to grid connection and permitting remain.
- Competitive Product Substitutes: Traditional fossil fuel-based power generation remains a competitor, but its environmental impact is pushing the adoption of cleaner energy storage solutions.
- End-User Demographics: The C&I sector is currently the largest adopter of energy storage solutions, driven by cost savings and increased energy reliability. Residential adoption is growing, but faces challenges in terms of upfront costs.
- M&A Trends: The number of M&A deals in the UK energy storage market has increased significantly in recent years, reaching xx deals in 2024, indicating substantial investment and consolidation.
Energy Storage in United Kingdom Market Growth Trends & Insights
The UK energy storage market has experienced substantial growth over the past few years, with a compound annual growth rate (CAGR) of xx% during 2019-2024. This growth is projected to continue throughout the forecast period (2025-2033), reaching a market size of xx Million units by 2033. Market penetration is increasing across all sectors, driven by decreasing battery costs, improved energy efficiency, and policy support. The adoption of smart grid technologies is further accelerating market growth. Technological disruptions, such as advancements in solid-state batteries, are poised to significantly impact the market in the coming years. Consumer behavior is shifting towards greater adoption of renewable energy sources, indirectly driving higher demand for energy storage solutions to mitigate intermittency.
Dominant Regions, Countries, or Segments in Energy Storage in United Kingdom Market
England is currently the leading region for energy storage deployment in the UK, driven by a higher concentration of renewable energy projects and industrial activity. Within the application segments, the Commercial & Industrial (C&I) sector leads, driven by the economic benefits of energy storage in optimizing energy consumption and reducing operational costs. Among storage types, battery storage is the dominant technology, owing to its flexibility and adaptability.
- Key Drivers in England: Strong government support for renewable energy projects, well-established grid infrastructure, and significant industrial activity.
- C&I Sector Dominance: Cost reduction through peak shaving and arbitrage opportunities, enhanced grid stability, and resilience against power outages are key drivers.
- Battery Storage Leadership: Technological advancements, cost reductions, and flexibility in application have contributed to the dominance of battery storage.
The market in Scotland and Wales is also showing promising growth, albeit at a slower pace than in England. This is driven by ongoing developments in renewable energy generation and government support initiatives focused on decarbonization.
Energy Storage in United Kingdom Market Product Landscape
The UK energy storage market features a diverse range of products, primarily focused on lithium-ion batteries for various applications. Innovations are focused on enhancing energy density, improving cycle life, and developing safer battery chemistries. Specific product features, such as modular designs, advanced battery management systems (BMS), and smart grid integration capabilities are becoming increasingly important. Key performance indicators (KPIs) include energy capacity (MWh), power output (MW), round-trip efficiency, and lifespan.
Key Drivers, Barriers & Challenges in Energy Storage in United Kingdom Market
Key Drivers:
- Increasing renewable energy adoption requiring grid stabilization.
- Government policies and incentives promoting clean energy technologies.
- Decreasing battery costs making energy storage more economically viable.
Key Challenges:
- High upfront capital costs for energy storage systems.
- Limited grid infrastructure in some regions restricting deployment.
- Concerns about battery lifespan, safety, and environmental impact of battery disposal. Supply chain vulnerabilities for key raw materials could also hamper growth.
Emerging Opportunities in Energy Storage in United Kingdom Market
- Growing demand for microgrids and off-grid energy solutions in remote areas.
- Increased integration of energy storage with electric vehicle charging infrastructure.
- Expanding applications in the transportation sector, such as for buses and trains.
- Growing interest in hybrid energy storage systems combining different technologies (e.g., battery and PSH).
Growth Accelerators in the Energy Storage in United Kingdom Market Industry
Technological advancements in battery technology, particularly in terms of energy density and cost reduction, are key growth drivers. Strategic partnerships between energy storage providers, renewable energy developers, and grid operators are fostering market expansion. Government initiatives and regulatory support are accelerating energy storage deployment, while expanding market applications beyond traditional sectors will fuel continued growth.
Key Players Shaping the Energy Storage in United Kingdom Market Market
- ABB Ltd
- Samsung SDI Co Ltd
- LG Energy Solution Ltd
- Contemporary Amperex Technology Co Ltd
- NGK Insulators Ltd
- Electricite de France SA (EDF)
- Wartsila Oyj Abp
- Tesla Inc
- Siemens Energy AG
- General Electric Company
Notable Milestones in Energy Storage in United Kingdom Market Sector
- June 2022: Quinbrook Infrastructure Partners acquired development rights for a 230 MW/460 MWh battery energy storage project in Wales, signaling significant investment in large-scale battery storage.
- January 2022: Voltalia commissioned a 32 MW/32 MWh battery energy storage system near Bristol, demonstrating the increasing adoption of smaller-scale BESS projects.
In-Depth Energy Storage in United Kingdom Market Market Outlook
The UK energy storage market is poised for continued strong growth over the next decade, driven by increasing renewable energy deployment, supportive government policies, and decreasing battery costs. Strategic partnerships and technological advancements will further accelerate market expansion. Opportunities exist in various sectors, from residential to large-scale grid applications, offering substantial growth potential for both established and emerging players. The market will continue to evolve with further innovation in battery chemistries and system integration technologies.
Energy Storage in United Kingdom Market Segmentation
-
1. Type
- 1.1. Batteries
- 1.2. Pumped-storage Hydroelectricity (PSH)
- 1.3. Other Types
-
2. Application
- 2.1. Residential
- 2.2. Commercial and Industrial (C&I)
Energy Storage in United Kingdom Market Segmentation By Geography
-
1. North America
- 1.1. United States
- 1.2. Canada
- 1.3. Mexico
-
2. South America
- 2.1. Brazil
- 2.2. Argentina
- 2.3. Rest of South America
-
3. Europe
- 3.1. United Kingdom
- 3.2. Germany
- 3.3. France
- 3.4. Italy
- 3.5. Spain
- 3.6. Russia
- 3.7. Benelux
- 3.8. Nordics
- 3.9. Rest of Europe
-
4. Middle East & Africa
- 4.1. Turkey
- 4.2. Israel
- 4.3. GCC
- 4.4. North Africa
- 4.5. South Africa
- 4.6. Rest of Middle East & Africa
-
5. Asia Pacific
- 5.1. China
- 5.2. India
- 5.3. Japan
- 5.4. South Korea
- 5.5. ASEAN
- 5.6. Oceania
- 5.7. Rest of Asia Pacific
Energy Storage in United Kingdom Market Regional Market Share
Geographic Coverage of Energy Storage in United Kingdom Market
Energy Storage in United Kingdom Market REPORT HIGHLIGHTS
| Aspects | Details |
|---|---|
| Study Period | 2020-2034 |
| Base Year | 2025 |
| Estimated Year | 2026 |
| Forecast Period | 2026-2034 |
| Historical Period | 2020-2025 |
| Growth Rate | CAGR of 19.57% from 2020-2034 |
| Segmentation |
|
Table of Contents
- 1. Introduction
- 1.1. Research Scope
- 1.2. Market Segmentation
- 1.3. Research Objective
- 1.4. Definitions and Assumptions
- 2. Executive Summary
- 2.1. Market Snapshot
- 3. Market Dynamics
- 3.1. Market Drivers
- 3.2. Market Restrains
- 3.3. Market Trends
- 3.4. Market Opportunities
- 4. Market Factor Analysis
- 4.1. Porters Five Forces
- 4.1.1. Bargaining Power of Suppliers
- 4.1.2. Bargaining Power of Buyers
- 4.1.3. Threat of New Entrants
- 4.1.4. Threat of Substitutes
- 4.1.5. Competitive Rivalry
- 4.2. PESTEL analysis
- 4.3. BCG Analysis
- 4.3.1. Stars (High Growth, High Market Share)
- 4.3.2. Cash Cows (Low Growth, High Market Share)
- 4.3.3. Question Mark (High Growth, Low Market Share)
- 4.3.4. Dogs (Low Growth, Low Market Share)
- 4.4. Ansoff Matrix Analysis
- 4.5. Supply Chain Analysis
- 4.6. Regulatory Landscape
- 4.7. Current Market Potential and Opportunity Assessment (TAM–SAM–SOM Framework)
- 4.8. IMR Analyst Note
- 4.1. Porters Five Forces
- 5. Market Analysis, Insights and Forecast 2021-2033
- 5.1. Market Analysis, Insights and Forecast - by Type
- 5.1.1. Batteries
- 5.1.2. Pumped-storage Hydroelectricity (PSH)
- 5.1.3. Other Types
- 5.2. Market Analysis, Insights and Forecast - by Application
- 5.2.1. Residential
- 5.2.2. Commercial and Industrial (C&I)
- 5.3. Market Analysis, Insights and Forecast - by Region
- 5.3.1. North America
- 5.3.2. South America
- 5.3.3. Europe
- 5.3.4. Middle East & Africa
- 5.3.5. Asia Pacific
- 5.1. Market Analysis, Insights and Forecast - by Type
- 6. Global Energy Storage in United Kingdom Market Analysis, Insights and Forecast, 2021-2033
- 6.1. Market Analysis, Insights and Forecast - by Type
- 6.1.1. Batteries
- 6.1.2. Pumped-storage Hydroelectricity (PSH)
- 6.1.3. Other Types
- 6.2. Market Analysis, Insights and Forecast - by Application
- 6.2.1. Residential
- 6.2.2. Commercial and Industrial (C&I)
- 6.1. Market Analysis, Insights and Forecast - by Type
- 7. North America Energy Storage in United Kingdom Market Analysis, Insights and Forecast, 2020-2032
- 7.1. Market Analysis, Insights and Forecast - by Type
- 7.1.1. Batteries
- 7.1.2. Pumped-storage Hydroelectricity (PSH)
- 7.1.3. Other Types
- 7.2. Market Analysis, Insights and Forecast - by Application
- 7.2.1. Residential
- 7.2.2. Commercial and Industrial (C&I)
- 7.1. Market Analysis, Insights and Forecast - by Type
- 8. South America Energy Storage in United Kingdom Market Analysis, Insights and Forecast, 2020-2032
- 8.1. Market Analysis, Insights and Forecast - by Type
- 8.1.1. Batteries
- 8.1.2. Pumped-storage Hydroelectricity (PSH)
- 8.1.3. Other Types
- 8.2. Market Analysis, Insights and Forecast - by Application
- 8.2.1. Residential
- 8.2.2. Commercial and Industrial (C&I)
- 8.1. Market Analysis, Insights and Forecast - by Type
- 9. Europe Energy Storage in United Kingdom Market Analysis, Insights and Forecast, 2020-2032
- 9.1. Market Analysis, Insights and Forecast - by Type
- 9.1.1. Batteries
- 9.1.2. Pumped-storage Hydroelectricity (PSH)
- 9.1.3. Other Types
- 9.2. Market Analysis, Insights and Forecast - by Application
- 9.2.1. Residential
- 9.2.2. Commercial and Industrial (C&I)
- 9.1. Market Analysis, Insights and Forecast - by Type
- 10. Middle East & Africa Energy Storage in United Kingdom Market Analysis, Insights and Forecast, 2020-2032
- 10.1. Market Analysis, Insights and Forecast - by Type
- 10.1.1. Batteries
- 10.1.2. Pumped-storage Hydroelectricity (PSH)
- 10.1.3. Other Types
- 10.2. Market Analysis, Insights and Forecast - by Application
- 10.2.1. Residential
- 10.2.2. Commercial and Industrial (C&I)
- 10.1. Market Analysis, Insights and Forecast - by Type
- 11. Asia Pacific Energy Storage in United Kingdom Market Analysis, Insights and Forecast, 2020-2032
- 11.1. Market Analysis, Insights and Forecast - by Type
- 11.1.1. Batteries
- 11.1.2. Pumped-storage Hydroelectricity (PSH)
- 11.1.3. Other Types
- 11.2. Market Analysis, Insights and Forecast - by Application
- 11.2.1. Residential
- 11.2.2. Commercial and Industrial (C&I)
- 11.1. Market Analysis, Insights and Forecast - by Type
- 12. Competitive Analysis
- 12.1. Company Profiles
- 12.1.1 ABB Ltd
- 12.1.1.1. Company Overview
- 12.1.1.2. Products
- 12.1.1.3. Company Financials
- 12.1.1.4. SWOT Analysis
- 12.1.2 Samsung SDI Co Ltd*List Not Exhaustive
- 12.1.2.1. Company Overview
- 12.1.2.2. Products
- 12.1.2.3. Company Financials
- 12.1.2.4. SWOT Analysis
- 12.1.3 LG Energy Solution Ltd
- 12.1.3.1. Company Overview
- 12.1.3.2. Products
- 12.1.3.3. Company Financials
- 12.1.3.4. SWOT Analysis
- 12.1.4 Contemporary Amperex Technology Co Ltd
- 12.1.4.1. Company Overview
- 12.1.4.2. Products
- 12.1.4.3. Company Financials
- 12.1.4.4. SWOT Analysis
- 12.1.5 NGK Insulators Ltd
- 12.1.5.1. Company Overview
- 12.1.5.2. Products
- 12.1.5.3. Company Financials
- 12.1.5.4. SWOT Analysis
- 12.1.6 Electricite de France SA (EDF)
- 12.1.6.1. Company Overview
- 12.1.6.2. Products
- 12.1.6.3. Company Financials
- 12.1.6.4. SWOT Analysis
- 12.1.7 Wartsila Oyj Abp
- 12.1.7.1. Company Overview
- 12.1.7.2. Products
- 12.1.7.3. Company Financials
- 12.1.7.4. SWOT Analysis
- 12.1.8 Tesla Inc
- 12.1.8.1. Company Overview
- 12.1.8.2. Products
- 12.1.8.3. Company Financials
- 12.1.8.4. SWOT Analysis
- 12.1.9 Siemens Energy AG
- 12.1.9.1. Company Overview
- 12.1.9.2. Products
- 12.1.9.3. Company Financials
- 12.1.9.4. SWOT Analysis
- 12.1.10 General Electric Company
- 12.1.10.1. Company Overview
- 12.1.10.2. Products
- 12.1.10.3. Company Financials
- 12.1.10.4. SWOT Analysis
- 12.1.1 ABB Ltd
- 12.2. Market Entropy
- 12.2.1 Company's Key Areas Served
- 12.2.2 Recent Developments
- 12.3. Company Market Share Analysis 2025
- 12.3.1 Top 5 Companies Market Share Analysis
- 12.3.2 Top 3 Companies Market Share Analysis
- 12.4. List of Potential Customers
- 13. Research Methodology
List of Figures
- Figure 1: Global Energy Storage in United Kingdom Market Revenue Breakdown (million, %) by Region 2025 & 2033
- Figure 2: Global Energy Storage in United Kingdom Market Volume Breakdown (megawatt, %) by Region 2025 & 2033
- Figure 3: North America Energy Storage in United Kingdom Market Revenue (million), by Type 2025 & 2033
- Figure 4: North America Energy Storage in United Kingdom Market Volume (megawatt), by Type 2025 & 2033
- Figure 5: North America Energy Storage in United Kingdom Market Revenue Share (%), by Type 2025 & 2033
- Figure 6: North America Energy Storage in United Kingdom Market Volume Share (%), by Type 2025 & 2033
- Figure 7: North America Energy Storage in United Kingdom Market Revenue (million), by Application 2025 & 2033
- Figure 8: North America Energy Storage in United Kingdom Market Volume (megawatt), by Application 2025 & 2033
- Figure 9: North America Energy Storage in United Kingdom Market Revenue Share (%), by Application 2025 & 2033
- Figure 10: North America Energy Storage in United Kingdom Market Volume Share (%), by Application 2025 & 2033
- Figure 11: North America Energy Storage in United Kingdom Market Revenue (million), by Country 2025 & 2033
- Figure 12: North America Energy Storage in United Kingdom Market Volume (megawatt), by Country 2025 & 2033
- Figure 13: North America Energy Storage in United Kingdom Market Revenue Share (%), by Country 2025 & 2033
- Figure 14: North America Energy Storage in United Kingdom Market Volume Share (%), by Country 2025 & 2033
- Figure 15: South America Energy Storage in United Kingdom Market Revenue (million), by Type 2025 & 2033
- Figure 16: South America Energy Storage in United Kingdom Market Volume (megawatt), by Type 2025 & 2033
- Figure 17: South America Energy Storage in United Kingdom Market Revenue Share (%), by Type 2025 & 2033
- Figure 18: South America Energy Storage in United Kingdom Market Volume Share (%), by Type 2025 & 2033
- Figure 19: South America Energy Storage in United Kingdom Market Revenue (million), by Application 2025 & 2033
- Figure 20: South America Energy Storage in United Kingdom Market Volume (megawatt), by Application 2025 & 2033
- Figure 21: South America Energy Storage in United Kingdom Market Revenue Share (%), by Application 2025 & 2033
- Figure 22: South America Energy Storage in United Kingdom Market Volume Share (%), by Application 2025 & 2033
- Figure 23: South America Energy Storage in United Kingdom Market Revenue (million), by Country 2025 & 2033
- Figure 24: South America Energy Storage in United Kingdom Market Volume (megawatt), by Country 2025 & 2033
- Figure 25: South America Energy Storage in United Kingdom Market Revenue Share (%), by Country 2025 & 2033
- Figure 26: South America Energy Storage in United Kingdom Market Volume Share (%), by Country 2025 & 2033
- Figure 27: Europe Energy Storage in United Kingdom Market Revenue (million), by Type 2025 & 2033
- Figure 28: Europe Energy Storage in United Kingdom Market Volume (megawatt), by Type 2025 & 2033
- Figure 29: Europe Energy Storage in United Kingdom Market Revenue Share (%), by Type 2025 & 2033
- Figure 30: Europe Energy Storage in United Kingdom Market Volume Share (%), by Type 2025 & 2033
- Figure 31: Europe Energy Storage in United Kingdom Market Revenue (million), by Application 2025 & 2033
- Figure 32: Europe Energy Storage in United Kingdom Market Volume (megawatt), by Application 2025 & 2033
- Figure 33: Europe Energy Storage in United Kingdom Market Revenue Share (%), by Application 2025 & 2033
- Figure 34: Europe Energy Storage in United Kingdom Market Volume Share (%), by Application 2025 & 2033
- Figure 35: Europe Energy Storage in United Kingdom Market Revenue (million), by Country 2025 & 2033
- Figure 36: Europe Energy Storage in United Kingdom Market Volume (megawatt), by Country 2025 & 2033
- Figure 37: Europe Energy Storage in United Kingdom Market Revenue Share (%), by Country 2025 & 2033
- Figure 38: Europe Energy Storage in United Kingdom Market Volume Share (%), by Country 2025 & 2033
- Figure 39: Middle East & Africa Energy Storage in United Kingdom Market Revenue (million), by Type 2025 & 2033
- Figure 40: Middle East & Africa Energy Storage in United Kingdom Market Volume (megawatt), by Type 2025 & 2033
- Figure 41: Middle East & Africa Energy Storage in United Kingdom Market Revenue Share (%), by Type 2025 & 2033
- Figure 42: Middle East & Africa Energy Storage in United Kingdom Market Volume Share (%), by Type 2025 & 2033
- Figure 43: Middle East & Africa Energy Storage in United Kingdom Market Revenue (million), by Application 2025 & 2033
- Figure 44: Middle East & Africa Energy Storage in United Kingdom Market Volume (megawatt), by Application 2025 & 2033
- Figure 45: Middle East & Africa Energy Storage in United Kingdom Market Revenue Share (%), by Application 2025 & 2033
- Figure 46: Middle East & Africa Energy Storage in United Kingdom Market Volume Share (%), by Application 2025 & 2033
- Figure 47: Middle East & Africa Energy Storage in United Kingdom Market Revenue (million), by Country 2025 & 2033
- Figure 48: Middle East & Africa Energy Storage in United Kingdom Market Volume (megawatt), by Country 2025 & 2033
- Figure 49: Middle East & Africa Energy Storage in United Kingdom Market Revenue Share (%), by Country 2025 & 2033
- Figure 50: Middle East & Africa Energy Storage in United Kingdom Market Volume Share (%), by Country 2025 & 2033
- Figure 51: Asia Pacific Energy Storage in United Kingdom Market Revenue (million), by Type 2025 & 2033
- Figure 52: Asia Pacific Energy Storage in United Kingdom Market Volume (megawatt), by Type 2025 & 2033
- Figure 53: Asia Pacific Energy Storage in United Kingdom Market Revenue Share (%), by Type 2025 & 2033
- Figure 54: Asia Pacific Energy Storage in United Kingdom Market Volume Share (%), by Type 2025 & 2033
- Figure 55: Asia Pacific Energy Storage in United Kingdom Market Revenue (million), by Application 2025 & 2033
- Figure 56: Asia Pacific Energy Storage in United Kingdom Market Volume (megawatt), by Application 2025 & 2033
- Figure 57: Asia Pacific Energy Storage in United Kingdom Market Revenue Share (%), by Application 2025 & 2033
- Figure 58: Asia Pacific Energy Storage in United Kingdom Market Volume Share (%), by Application 2025 & 2033
- Figure 59: Asia Pacific Energy Storage in United Kingdom Market Revenue (million), by Country 2025 & 2033
- Figure 60: Asia Pacific Energy Storage in United Kingdom Market Volume (megawatt), by Country 2025 & 2033
- Figure 61: Asia Pacific Energy Storage in United Kingdom Market Revenue Share (%), by Country 2025 & 2033
- Figure 62: Asia Pacific Energy Storage in United Kingdom Market Volume Share (%), by Country 2025 & 2033
List of Tables
- Table 1: Global Energy Storage in United Kingdom Market Revenue million Forecast, by Type 2020 & 2033
- Table 2: Global Energy Storage in United Kingdom Market Volume megawatt Forecast, by Type 2020 & 2033
- Table 3: Global Energy Storage in United Kingdom Market Revenue million Forecast, by Application 2020 & 2033
- Table 4: Global Energy Storage in United Kingdom Market Volume megawatt Forecast, by Application 2020 & 2033
- Table 5: Global Energy Storage in United Kingdom Market Revenue million Forecast, by Region 2020 & 2033
- Table 6: Global Energy Storage in United Kingdom Market Volume megawatt Forecast, by Region 2020 & 2033
- Table 7: Global Energy Storage in United Kingdom Market Revenue million Forecast, by Type 2020 & 2033
- Table 8: Global Energy Storage in United Kingdom Market Volume megawatt Forecast, by Type 2020 & 2033
- Table 9: Global Energy Storage in United Kingdom Market Revenue million Forecast, by Application 2020 & 2033
- Table 10: Global Energy Storage in United Kingdom Market Volume megawatt Forecast, by Application 2020 & 2033
- Table 11: Global Energy Storage in United Kingdom Market Revenue million Forecast, by Country 2020 & 2033
- Table 12: Global Energy Storage in United Kingdom Market Volume megawatt Forecast, by Country 2020 & 2033
- Table 13: United States Energy Storage in United Kingdom Market Revenue (million) Forecast, by Application 2020 & 2033
- Table 14: United States Energy Storage in United Kingdom Market Volume (megawatt) Forecast, by Application 2020 & 2033
- Table 15: Canada Energy Storage in United Kingdom Market Revenue (million) Forecast, by Application 2020 & 2033
- Table 16: Canada Energy Storage in United Kingdom Market Volume (megawatt) Forecast, by Application 2020 & 2033
- Table 17: Mexico Energy Storage in United Kingdom Market Revenue (million) Forecast, by Application 2020 & 2033
- Table 18: Mexico Energy Storage in United Kingdom Market Volume (megawatt) Forecast, by Application 2020 & 2033
- Table 19: Global Energy Storage in United Kingdom Market Revenue million Forecast, by Type 2020 & 2033
- Table 20: Global Energy Storage in United Kingdom Market Volume megawatt Forecast, by Type 2020 & 2033
- Table 21: Global Energy Storage in United Kingdom Market Revenue million Forecast, by Application 2020 & 2033
- Table 22: Global Energy Storage in United Kingdom Market Volume megawatt Forecast, by Application 2020 & 2033
- Table 23: Global Energy Storage in United Kingdom Market Revenue million Forecast, by Country 2020 & 2033
- Table 24: Global Energy Storage in United Kingdom Market Volume megawatt Forecast, by Country 2020 & 2033
- Table 25: Brazil Energy Storage in United Kingdom Market Revenue (million) Forecast, by Application 2020 & 2033
- Table 26: Brazil Energy Storage in United Kingdom Market Volume (megawatt) Forecast, by Application 2020 & 2033
- Table 27: Argentina Energy Storage in United Kingdom Market Revenue (million) Forecast, by Application 2020 & 2033
- Table 28: Argentina Energy Storage in United Kingdom Market Volume (megawatt) Forecast, by Application 2020 & 2033
- Table 29: Rest of South America Energy Storage in United Kingdom Market Revenue (million) Forecast, by Application 2020 & 2033
- Table 30: Rest of South America Energy Storage in United Kingdom Market Volume (megawatt) Forecast, by Application 2020 & 2033
- Table 31: Global Energy Storage in United Kingdom Market Revenue million Forecast, by Type 2020 & 2033
- Table 32: Global Energy Storage in United Kingdom Market Volume megawatt Forecast, by Type 2020 & 2033
- Table 33: Global Energy Storage in United Kingdom Market Revenue million Forecast, by Application 2020 & 2033
- Table 34: Global Energy Storage in United Kingdom Market Volume megawatt Forecast, by Application 2020 & 2033
- Table 35: Global Energy Storage in United Kingdom Market Revenue million Forecast, by Country 2020 & 2033
- Table 36: Global Energy Storage in United Kingdom Market Volume megawatt Forecast, by Country 2020 & 2033
- Table 37: United Kingdom Energy Storage in United Kingdom Market Revenue (million) Forecast, by Application 2020 & 2033
- Table 38: United Kingdom Energy Storage in United Kingdom Market Volume (megawatt) Forecast, by Application 2020 & 2033
- Table 39: Germany Energy Storage in United Kingdom Market Revenue (million) Forecast, by Application 2020 & 2033
- Table 40: Germany Energy Storage in United Kingdom Market Volume (megawatt) Forecast, by Application 2020 & 2033
- Table 41: France Energy Storage in United Kingdom Market Revenue (million) Forecast, by Application 2020 & 2033
- Table 42: France Energy Storage in United Kingdom Market Volume (megawatt) Forecast, by Application 2020 & 2033
- Table 43: Italy Energy Storage in United Kingdom Market Revenue (million) Forecast, by Application 2020 & 2033
- Table 44: Italy Energy Storage in United Kingdom Market Volume (megawatt) Forecast, by Application 2020 & 2033
- Table 45: Spain Energy Storage in United Kingdom Market Revenue (million) Forecast, by Application 2020 & 2033
- Table 46: Spain Energy Storage in United Kingdom Market Volume (megawatt) Forecast, by Application 2020 & 2033
- Table 47: Russia Energy Storage in United Kingdom Market Revenue (million) Forecast, by Application 2020 & 2033
- Table 48: Russia Energy Storage in United Kingdom Market Volume (megawatt) Forecast, by Application 2020 & 2033
- Table 49: Benelux Energy Storage in United Kingdom Market Revenue (million) Forecast, by Application 2020 & 2033
- Table 50: Benelux Energy Storage in United Kingdom Market Volume (megawatt) Forecast, by Application 2020 & 2033
- Table 51: Nordics Energy Storage in United Kingdom Market Revenue (million) Forecast, by Application 2020 & 2033
- Table 52: Nordics Energy Storage in United Kingdom Market Volume (megawatt) Forecast, by Application 2020 & 2033
- Table 53: Rest of Europe Energy Storage in United Kingdom Market Revenue (million) Forecast, by Application 2020 & 2033
- Table 54: Rest of Europe Energy Storage in United Kingdom Market Volume (megawatt) Forecast, by Application 2020 & 2033
- Table 55: Global Energy Storage in United Kingdom Market Revenue million Forecast, by Type 2020 & 2033
- Table 56: Global Energy Storage in United Kingdom Market Volume megawatt Forecast, by Type 2020 & 2033
- Table 57: Global Energy Storage in United Kingdom Market Revenue million Forecast, by Application 2020 & 2033
- Table 58: Global Energy Storage in United Kingdom Market Volume megawatt Forecast, by Application 2020 & 2033
- Table 59: Global Energy Storage in United Kingdom Market Revenue million Forecast, by Country 2020 & 2033
- Table 60: Global Energy Storage in United Kingdom Market Volume megawatt Forecast, by Country 2020 & 2033
- Table 61: Turkey Energy Storage in United Kingdom Market Revenue (million) Forecast, by Application 2020 & 2033
- Table 62: Turkey Energy Storage in United Kingdom Market Volume (megawatt) Forecast, by Application 2020 & 2033
- Table 63: Israel Energy Storage in United Kingdom Market Revenue (million) Forecast, by Application 2020 & 2033
- Table 64: Israel Energy Storage in United Kingdom Market Volume (megawatt) Forecast, by Application 2020 & 2033
- Table 65: GCC Energy Storage in United Kingdom Market Revenue (million) Forecast, by Application 2020 & 2033
- Table 66: GCC Energy Storage in United Kingdom Market Volume (megawatt) Forecast, by Application 2020 & 2033
- Table 67: North Africa Energy Storage in United Kingdom Market Revenue (million) Forecast, by Application 2020 & 2033
- Table 68: North Africa Energy Storage in United Kingdom Market Volume (megawatt) Forecast, by Application 2020 & 2033
- Table 69: South Africa Energy Storage in United Kingdom Market Revenue (million) Forecast, by Application 2020 & 2033
- Table 70: South Africa Energy Storage in United Kingdom Market Volume (megawatt) Forecast, by Application 2020 & 2033
- Table 71: Rest of Middle East & Africa Energy Storage in United Kingdom Market Revenue (million) Forecast, by Application 2020 & 2033
- Table 72: Rest of Middle East & Africa Energy Storage in United Kingdom Market Volume (megawatt) Forecast, by Application 2020 & 2033
- Table 73: Global Energy Storage in United Kingdom Market Revenue million Forecast, by Type 2020 & 2033
- Table 74: Global Energy Storage in United Kingdom Market Volume megawatt Forecast, by Type 2020 & 2033
- Table 75: Global Energy Storage in United Kingdom Market Revenue million Forecast, by Application 2020 & 2033
- Table 76: Global Energy Storage in United Kingdom Market Volume megawatt Forecast, by Application 2020 & 2033
- Table 77: Global Energy Storage in United Kingdom Market Revenue million Forecast, by Country 2020 & 2033
- Table 78: Global Energy Storage in United Kingdom Market Volume megawatt Forecast, by Country 2020 & 2033
- Table 79: China Energy Storage in United Kingdom Market Revenue (million) Forecast, by Application 2020 & 2033
- Table 80: China Energy Storage in United Kingdom Market Volume (megawatt) Forecast, by Application 2020 & 2033
- Table 81: India Energy Storage in United Kingdom Market Revenue (million) Forecast, by Application 2020 & 2033
- Table 82: India Energy Storage in United Kingdom Market Volume (megawatt) Forecast, by Application 2020 & 2033
- Table 83: Japan Energy Storage in United Kingdom Market Revenue (million) Forecast, by Application 2020 & 2033
- Table 84: Japan Energy Storage in United Kingdom Market Volume (megawatt) Forecast, by Application 2020 & 2033
- Table 85: South Korea Energy Storage in United Kingdom Market Revenue (million) Forecast, by Application 2020 & 2033
- Table 86: South Korea Energy Storage in United Kingdom Market Volume (megawatt) Forecast, by Application 2020 & 2033
- Table 87: ASEAN Energy Storage in United Kingdom Market Revenue (million) Forecast, by Application 2020 & 2033
- Table 88: ASEAN Energy Storage in United Kingdom Market Volume (megawatt) Forecast, by Application 2020 & 2033
- Table 89: Oceania Energy Storage in United Kingdom Market Revenue (million) Forecast, by Application 2020 & 2033
- Table 90: Oceania Energy Storage in United Kingdom Market Volume (megawatt) Forecast, by Application 2020 & 2033
- Table 91: Rest of Asia Pacific Energy Storage in United Kingdom Market Revenue (million) Forecast, by Application 2020 & 2033
- Table 92: Rest of Asia Pacific Energy Storage in United Kingdom Market Volume (megawatt) Forecast, by Application 2020 & 2033
Frequently Asked Questions
1. What is the projected Compound Annual Growth Rate (CAGR) of the Energy Storage in United Kingdom Market?
The projected CAGR is approximately 19.57%.
2. Which companies are prominent players in the Energy Storage in United Kingdom Market?
Key companies in the market include ABB Ltd, Samsung SDI Co Ltd*List Not Exhaustive, LG Energy Solution Ltd, Contemporary Amperex Technology Co Ltd, NGK Insulators Ltd, Electricite de France SA (EDF), Wartsila Oyj Abp, Tesla Inc, Siemens Energy AG, General Electric Company.
3. What are the main segments of the Energy Storage in United Kingdom Market?
The market segments include Type, Application.
4. Can you provide details about the market size?
The market size is estimated to be USD 6872 million as of 2022.
5. What are some drivers contributing to market growth?
4.; The High Amount of Waste Generation in the Country4.; The growing Focus on Non-Fossil Fuel Sources.
6. What are the notable trends driving market growth?
Battery Energy Storage Systems Expected to Witness Significant Demand.
7. Are there any restraints impacting market growth?
4.; The Recycling Rate of Waste in Germany.
8. Can you provide examples of recent developments in the market?
Jun 2022: Quinbrook Infrastructure Partners acquired exclusive project development rights for the 230 MW/460 MWh battery energy storage project in Wales, United Kingdom. The battery energy storage system will be at the former Uskmouth coal-fired power station in South Wales, which closed in 2015. The project development rights were acquired from Simec Atlantis Energy, and the BESS is expected to be commissioned by the end of 2024.
9. What pricing options are available for accessing the report?
Pricing options include single-user, multi-user, and enterprise licenses priced at USD 3800, USD 4500, and USD 5800 respectively.
10. Is the market size provided in terms of value or volume?
The market size is provided in terms of value, measured in million and volume, measured in megawatt.
11. Are there any specific market keywords associated with the report?
Yes, the market keyword associated with the report is "Energy Storage in United Kingdom Market," which aids in identifying and referencing the specific market segment covered.
12. How do I determine which pricing option suits my needs best?
The pricing options vary based on user requirements and access needs. Individual users may opt for single-user licenses, while businesses requiring broader access may choose multi-user or enterprise licenses for cost-effective access to the report.
13. Are there any additional resources or data provided in the Energy Storage in United Kingdom Market report?
While the report offers comprehensive insights, it's advisable to review the specific contents or supplementary materials provided to ascertain if additional resources or data are available.
14. How can I stay updated on further developments or reports in the Energy Storage in United Kingdom Market?
To stay informed about further developments, trends, and reports in the Energy Storage in United Kingdom Market, consider subscribing to industry newsletters, following relevant companies and organizations, or regularly checking reputable industry news sources and publications.
Methodology
Step 1 - Identification of Relevant Samples Size from Population Database


Step 2 - Approaches for Defining Global Market Size (Value, Volume* & Price*)

Note*: In applicable scenarios
Step 3 - Data Sources
Primary Research
- Web Analytics
- Survey Reports
- Research Institute
- Latest Research Reports
- Opinion Leaders
Secondary Research
- Annual Reports
- White Paper
- Latest Press Release
- Industry Association
- Paid Database
- Investor Presentations

Step 4 - Data Triangulation
Involves using different sources of information in order to increase the validity of a study
These sources are likely to be stakeholders in a program - participants, other researchers, program staff, other community members, and so on.
Then we put all data in single framework & apply various statistical tools to find out the dynamic on the market.
During the analysis stage, feedback from the stakeholder groups would be compared to determine areas of agreement as well as areas of divergence