

Key Insights
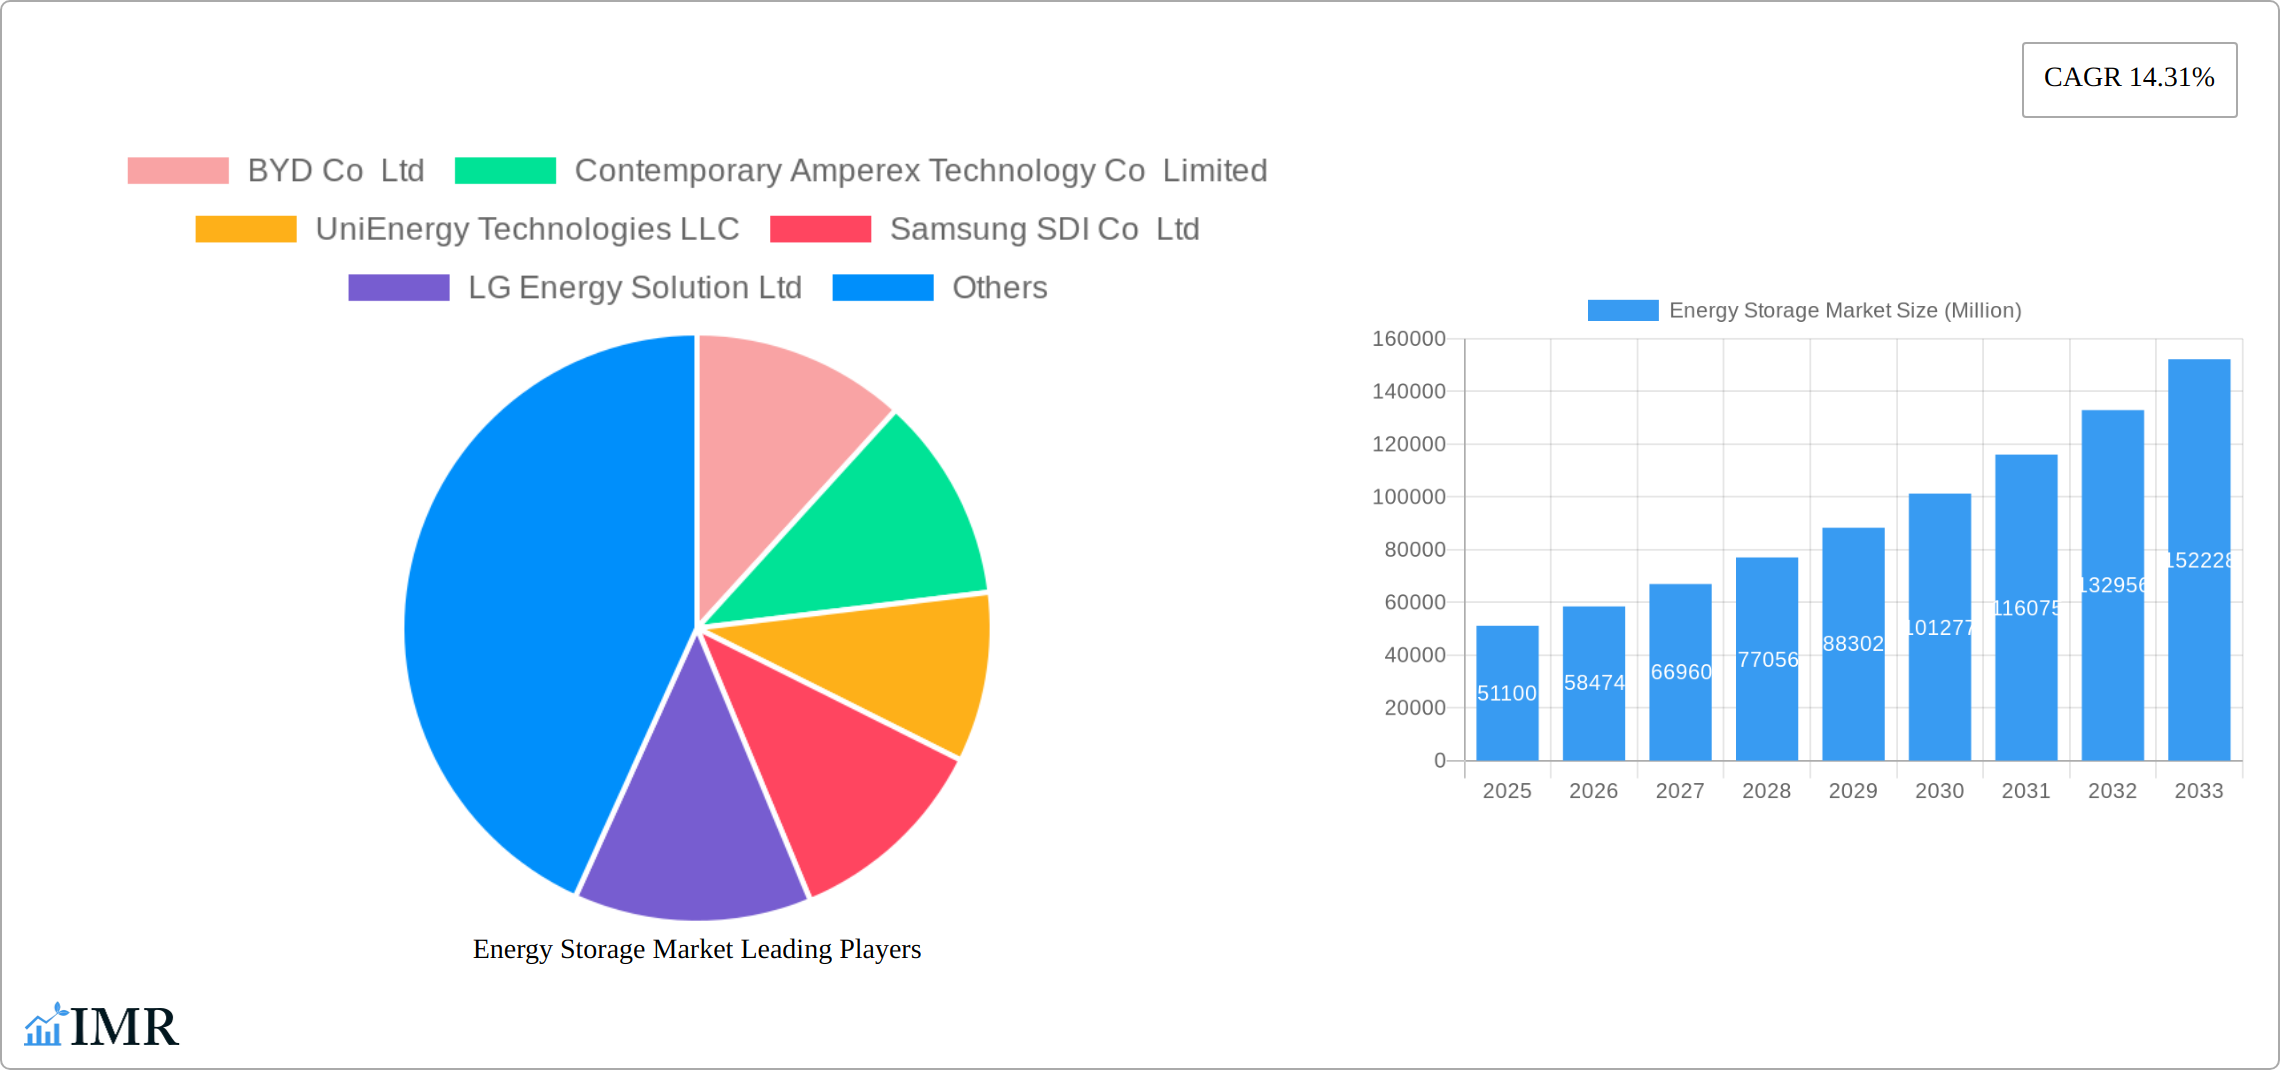
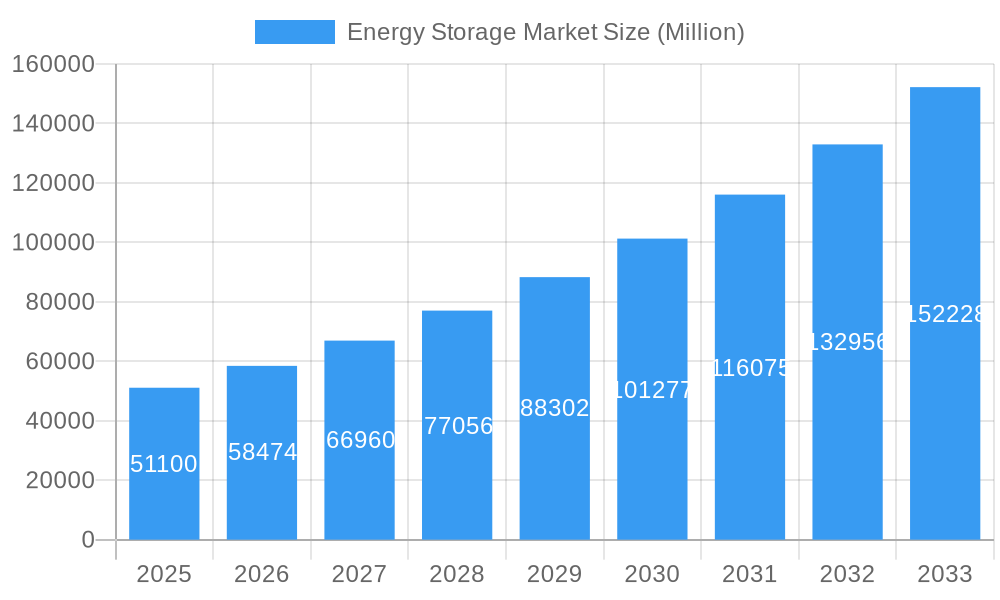
The global energy storage market, valued at $51.10 billion in 2025, is experiencing robust growth, projected to expand at a Compound Annual Growth Rate (CAGR) of 14.31% from 2025 to 2033. This surge is driven primarily by the increasing adoption of renewable energy sources like solar and wind, necessitating efficient energy storage solutions to address intermittency challenges. The growing demand for grid stabilization, alongside the rising concerns about climate change and energy security, further fuels market expansion. Technological advancements in battery technologies, particularly lithium-ion batteries, are significantly contributing to cost reductions and performance improvements, making energy storage more accessible and economically viable for residential, commercial, and industrial applications. The diverse applications, including electric vehicles, grid-scale storage, and backup power systems, contribute to the market's multifaceted nature. Significant regional variations exist, with North America and Asia-Pacific expected to dominate due to substantial investments in renewable energy infrastructure and supportive government policies. However, Europe and other regions are witnessing rapid growth, driven by ambitious decarbonization goals and increasing energy independence initiatives. The market segmentation reveals a strong preference for battery-based storage systems, reflecting their versatility and technological maturity. However, pumped-storage hydroelectricity (PSH) remains significant, especially in regions with suitable geographical conditions. Competition among key players like BYD, CATL, Tesla, and others is intense, leading to continuous innovation and price competitiveness.
Energy Storage Market Market Size (In Billion)
The market's future trajectory is largely dependent on several factors. Government regulations and incentives play a crucial role in shaping market adoption. Fluctuations in raw material prices, particularly lithium and other critical minerals, can impact manufacturing costs and profitability. Continued technological advancements in energy storage technologies will be key to further cost reductions and efficiency improvements, expanding market accessibility. The successful integration of energy storage solutions within smart grids and microgrids will be instrumental in realizing the full potential of this rapidly evolving market. Furthermore, overcoming challenges related to infrastructure development, grid modernization, and environmental concerns associated with battery manufacturing and disposal will be essential for sustainable long-term growth.
Energy Storage Market Company Market Share
Energy Storage Market: A Comprehensive Report (2019-2033)
This comprehensive report provides an in-depth analysis of the global energy storage market, encompassing historical data (2019-2024), current estimates (2025), and future forecasts (2025-2033). We delve into market dynamics, growth trends, regional dominance, product landscapes, and key players, offering invaluable insights for industry professionals, investors, and strategic decision-makers. The report covers various energy storage types (Batteries, Pumped-storage Hydroelectricity (PSH), Thermal Energy Storage (TES), Flywheel Energy Storage (FES), Other Types) and applications (Residential, Commercial & Industrial), providing a granular view of this rapidly evolving market, projected to reach xx Million units by 2033.
Energy Storage Market Dynamics & Structure
The energy storage market is characterized by a dynamic interplay of technological innovation, regulatory shifts, and evolving consumer preferences. Market concentration is moderately high, with several major players dominating specific segments, while smaller, specialized companies focus on niche applications. The market is witnessing significant mergers and acquisitions (M&A) activity, indicating consolidation and a push for scale. Technological advancements, particularly in battery technology, are driving substantial growth, although high initial investment costs and technical complexities remain barriers to entry for some players. Regulatory frameworks, including government incentives and emission reduction targets, are crucial in shaping market adoption rates. The rise of renewable energy sources, such as solar and wind power, has created significant demand for energy storage solutions to address intermittency issues.
- Market Concentration: Moderate, with key players holding xx% market share in 2025.
- M&A Activity: xx deals recorded in 2024, projecting xx deals for 2025.
- Technological Innovation: Battery technology advancements (e.g., solid-state batteries) are key drivers.
- Regulatory Landscape: Government subsidies and carbon emission targets are significant market stimulants.
- Competitive Substitutes: Limited direct substitutes, but other energy efficiency solutions pose indirect competition.
Energy Storage Market Growth Trends & Insights
The global energy storage market has experienced substantial growth over the past years, driven by increasing demand for renewable energy integration, grid stability enhancement, and backup power solutions. The market size is projected to expand significantly over the forecast period, exhibiting a CAGR of xx% from 2025 to 2033. This growth is fueled by several factors, including declining battery costs, improving energy density, and government support for renewable energy initiatives. Technological disruptions, such as the emergence of new battery chemistries and advanced energy storage systems, are reshaping the competitive landscape. Consumer behavior is also shifting towards sustainable energy solutions, further boosting market demand. The adoption rate is projected to increase steadily, driven primarily by residential and commercial applications.
- Market Size (2025): xx Million units
- Market Size (2033): xx Million units
- CAGR (2025-2033): xx%
- Market Penetration (2025): xx%
Dominant Regions, Countries, or Segments in Energy Storage Market
The Asia-Pacific region currently dominates the energy storage market, fueled by robust government support for renewable energy integration, rapid economic expansion, and a substantial consumer base. China and Japan are key contributors within this region. Battery-based energy storage systems hold the largest market share, owing to their versatility, scalability, and relatively lower cost compared to alternatives. However, pumped-storage hydroelectricity (PSH) remains a significant player, especially in large-scale applications. The commercial and industrial sector is the primary end-user, driven by the need for reliable backup power, peak demand management, and enhanced grid stability. This strong demand is further amplified by the increasing adoption of renewable energy sources, such as solar and wind, which inherently exhibit intermittency and require effective storage solutions for continuous power delivery. The growing awareness of environmental sustainability and the urgent need to reduce carbon emissions are also key factors pushing the adoption of energy storage technologies.
- Leading Region: Asia-Pacific ([Insert Projected Market Share Percentage for 2025 or latest year]% market share in 2025)
- Leading Countries: China, Japan, United States, (Add other significant countries with brief justification)
- Dominant Segment (Type): Batteries ([Insert Projected Market Share Percentage for 2025 or latest year]% market share in 2025)
- Dominant Segment (Application): Commercial & Industrial ([Insert Projected Market Share Percentage for 2025 or latest year]% market share in 2025), followed by [Mention other significant application segments with brief justification e.g., Residential]
- Key Drivers: Government policies supporting renewable energy integration, increasing electricity demand, grid modernization efforts, decarbonization goals, and growing concerns about energy security and resilience.
Energy Storage Market Product Landscape
The energy storage market offers a diverse range of products, each catering to specific applications and needs. Technological advancements focus on improving energy density, cycle life, safety, and cost-effectiveness. Batteries dominate the market with variations in chemistries (lithium-ion, lead-acid, flow batteries, etc.), offering different performance characteristics. Pumped hydro, thermal, and flywheel technologies cater to specific niche applications where their unique properties offer advantages. The ongoing focus is on enhancing overall system efficiency, reducing lifecycle costs, and developing more sustainable and environmentally friendly storage solutions.
Key Drivers, Barriers & Challenges in Energy Storage Market
Key Drivers:
- Increasing demand for renewable energy integration and grid stability.
- Growing concerns about energy security, reliability, and resilience against extreme weather events.
- Government incentives, policies, and regulations promoting energy storage deployment (including tax credits, subsidies, and mandates).
- Declining battery costs and continuous technological advancements leading to improved efficiency and lifespan.
- The rising demand for electric vehicles (EVs) and the resulting development of battery technologies applicable to energy storage.
Key Challenges and Restraints:
- High upfront capital costs and potential return on investment concerns.
- Limited lifespan, degradation, and recycling challenges associated with certain storage technologies.
- Intermittency challenges associated with renewable energy sources and the need for effective grid management solutions.
- Supply chain vulnerabilities affecting raw material availability, production costs, and geopolitical factors.
- Lack of standardized safety regulations and interoperability issues across different storage systems.
Emerging Opportunities in Energy Storage Market
- Growing adoption of electric vehicles (EVs) and hybrid electric vehicles (HEVs), driving demand for battery storage.
- Expansion into untapped markets, particularly in developing economies.
- Development of innovative applications in microgrids and off-grid power systems.
- Integration of advanced energy management systems for optimized energy utilization.
Growth Accelerators in the Energy Storage Market Industry
Several factors are poised to significantly accelerate growth in the energy storage market. Technological advancements, such as the development of more efficient and cost-effective battery chemistries (including solid-state batteries and improved lithium-ion technologies), will be instrumental. Strategic partnerships between energy storage companies, renewable energy developers, utilities, and technology providers will facilitate market expansion and innovation. Government support through targeted policies, regulations, and financial incentives will remain crucial. The increasing awareness of environmental concerns and the need for a sustainable energy future are also significant drivers. Furthermore, the integration of advanced grid management systems and smart grid technologies will optimize energy storage utilization and overall grid efficiency. The convergence of these factors will create a dynamic market, presenting significant opportunities for growth and innovation.
Key Players Shaping the Energy Storage Market Market
- BYD Co Ltd
- Contemporary Amperex Technology Co Limited
- UniEnergy Technologies LLC
- Samsung SDI Co Ltd
- LG Energy Solution Ltd
- NGK Insulators Ltd
- Tesla Inc
- Clarios (Formerly Johnson Controls International PLC)
- GS Yuasa Corporation
Notable Milestones in Energy Storage Market Sector
- February 2022: FIMER and Vega Solar partnership supplied 14 PVS-100 inverters to Albania, enhancing decentralized solar systems and showcasing the growing demand for energy storage solutions in emerging markets.
- May 2022: Salient Energy partnered with Horton World Solutions to integrate zinc-ion batteries into sustainable homebuilding, furthering residential energy storage adoption and highlighting the potential of alternative battery technologies.
- [Add more recent and relevant milestones with brief descriptions and impact. Include company names, technology advancements, significant investments, or policy changes.]
In-Depth Energy Storage Market Market Outlook
The future of the energy storage market is exceptionally promising, driven by the escalating urgency to mitigate climate change and ensure a reliable and sustainable energy supply. The market is projected for sustained growth, fueled by technological advancements, increasing affordability of storage solutions, supportive government policies, and the growing integration of renewable energy sources. Strategic partnerships, mergers, and acquisitions will continue to reshape the competitive landscape, accelerating market expansion. Companies that effectively innovate, optimize their supply chains, and adapt to evolving consumer preferences and technological advancements will be ideally positioned to capitalize on the immense growth opportunities in this dynamic sector. The market is expected to witness a shift towards more sustainable and environmentally friendly solutions, with increased focus on battery recycling and responsible sourcing of raw materials.
Energy Storage Market Segmentation
-
1. Type
- 1.1. Batteries
- 1.2. Pumped-storage Hydroelectricity (PSH)
- 1.3. Thermal Energy Storage (TES)
- 1.4. Flywheel Energy Storage (FES)
- 1.5. Other Types
-
2. Application
- 2.1. Residential
- 2.2. Commercial and Industrial
Energy Storage Market Segmentation By Geography
-
1. North America
- 1.1. United States
- 1.2. Canada
- 1.3. Rest of North America
-
2. Asia Pacific
- 2.1. India
- 2.2. China
- 2.3. Australia
- 2.4. Rest of Asia Pacific
-
3. Europe
- 3.1. Germany
- 3.2. United Kingdom
- 3.3. Rest of Europe
-
4. South America
- 4.1. Brazil
- 4.2. Argentina
- 4.3. Rest of South America
-
5. Middle East and Africa
- 5.1. Saudi Arabia
- 5.2. Iraq
- 5.3. Jordan
- 5.4. Rest of Middle East and Africa
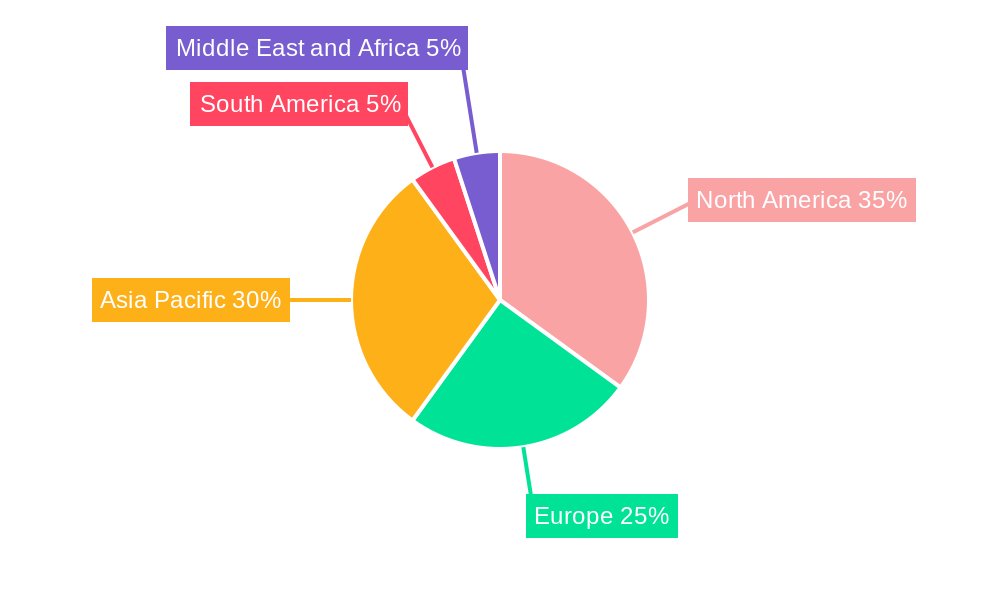
Energy Storage Market Regional Market Share
Geographic Coverage of Energy Storage Market
Energy Storage Market REPORT HIGHLIGHTS
| Aspects | Details |
|---|---|
| Study Period | 2020-2034 |
| Base Year | 2025 |
| Estimated Year | 2026 |
| Forecast Period | 2026-2034 |
| Historical Period | 2020-2025 |
| Growth Rate | CAGR of 14.31% from 2020-2034 |
| Segmentation |
|
Table of Contents
- 1. Introduction
- 1.1. Research Scope
- 1.2. Market Segmentation
- 1.3. Research Objective
- 1.4. Definitions and Assumptions
- 2. Executive Summary
- 2.1. Market Snapshot
- 3. Market Dynamics
- 3.1. Market Drivers
- 3.2. Market Restrains
- 3.3. Market Trends
- 3.4. Market Opportunities
- 4. Market Factor Analysis
- 4.1. Porters Five Forces
- 4.1.1. Bargaining Power of Suppliers
- 4.1.2. Bargaining Power of Buyers
- 4.1.3. Threat of New Entrants
- 4.1.4. Threat of Substitutes
- 4.1.5. Competitive Rivalry
- 4.2. PESTEL analysis
- 4.3. BCG Analysis
- 4.3.1. Stars (High Growth, High Market Share)
- 4.3.2. Cash Cows (Low Growth, High Market Share)
- 4.3.3. Question Mark (High Growth, Low Market Share)
- 4.3.4. Dogs (Low Growth, Low Market Share)
- 4.4. Ansoff Matrix Analysis
- 4.5. Supply Chain Analysis
- 4.6. Regulatory Landscape
- 4.7. Current Market Potential and Opportunity Assessment (TAM–SAM–SOM Framework)
- 4.8. IMR Analyst Note
- 4.1. Porters Five Forces
- 5. Market Analysis, Insights and Forecast 2021-2033
- 5.1. Market Analysis, Insights and Forecast - by Type
- 5.1.1. Batteries
- 5.1.2. Pumped-storage Hydroelectricity (PSH)
- 5.1.3. Thermal Energy Storage (TES)
- 5.1.4. Flywheel Energy Storage (FES)
- 5.1.5. Other Types
- 5.2. Market Analysis, Insights and Forecast - by Application
- 5.2.1. Residential
- 5.2.2. Commercial and Industrial
- 5.3. Market Analysis, Insights and Forecast - by Region
- 5.3.1. North America
- 5.3.2. Asia Pacific
- 5.3.3. Europe
- 5.3.4. South America
- 5.3.5. Middle East and Africa
- 5.1. Market Analysis, Insights and Forecast - by Type
- 6. Global Energy Storage Market Analysis, Insights and Forecast, 2021-2033
- 6.1. Market Analysis, Insights and Forecast - by Type
- 6.1.1. Batteries
- 6.1.2. Pumped-storage Hydroelectricity (PSH)
- 6.1.3. Thermal Energy Storage (TES)
- 6.1.4. Flywheel Energy Storage (FES)
- 6.1.5. Other Types
- 6.2. Market Analysis, Insights and Forecast - by Application
- 6.2.1. Residential
- 6.2.2. Commercial and Industrial
- 6.1. Market Analysis, Insights and Forecast - by Type
- 7. North America Energy Storage Market Analysis, Insights and Forecast, 2020-2032
- 7.1. Market Analysis, Insights and Forecast - by Type
- 7.1.1. Batteries
- 7.1.2. Pumped-storage Hydroelectricity (PSH)
- 7.1.3. Thermal Energy Storage (TES)
- 7.1.4. Flywheel Energy Storage (FES)
- 7.1.5. Other Types
- 7.2. Market Analysis, Insights and Forecast - by Application
- 7.2.1. Residential
- 7.2.2. Commercial and Industrial
- 7.1. Market Analysis, Insights and Forecast - by Type
- 8. Asia Pacific Energy Storage Market Analysis, Insights and Forecast, 2020-2032
- 8.1. Market Analysis, Insights and Forecast - by Type
- 8.1.1. Batteries
- 8.1.2. Pumped-storage Hydroelectricity (PSH)
- 8.1.3. Thermal Energy Storage (TES)
- 8.1.4. Flywheel Energy Storage (FES)
- 8.1.5. Other Types
- 8.2. Market Analysis, Insights and Forecast - by Application
- 8.2.1. Residential
- 8.2.2. Commercial and Industrial
- 8.1. Market Analysis, Insights and Forecast - by Type
- 9. Europe Energy Storage Market Analysis, Insights and Forecast, 2020-2032
- 9.1. Market Analysis, Insights and Forecast - by Type
- 9.1.1. Batteries
- 9.1.2. Pumped-storage Hydroelectricity (PSH)
- 9.1.3. Thermal Energy Storage (TES)
- 9.1.4. Flywheel Energy Storage (FES)
- 9.1.5. Other Types
- 9.2. Market Analysis, Insights and Forecast - by Application
- 9.2.1. Residential
- 9.2.2. Commercial and Industrial
- 9.1. Market Analysis, Insights and Forecast - by Type
- 10. South America Energy Storage Market Analysis, Insights and Forecast, 2020-2032
- 10.1. Market Analysis, Insights and Forecast - by Type
- 10.1.1. Batteries
- 10.1.2. Pumped-storage Hydroelectricity (PSH)
- 10.1.3. Thermal Energy Storage (TES)
- 10.1.4. Flywheel Energy Storage (FES)
- 10.1.5. Other Types
- 10.2. Market Analysis, Insights and Forecast - by Application
- 10.2.1. Residential
- 10.2.2. Commercial and Industrial
- 10.1. Market Analysis, Insights and Forecast - by Type
- 11. Middle East and Africa Energy Storage Market Analysis, Insights and Forecast, 2020-2032
- 11.1. Market Analysis, Insights and Forecast - by Type
- 11.1.1. Batteries
- 11.1.2. Pumped-storage Hydroelectricity (PSH)
- 11.1.3. Thermal Energy Storage (TES)
- 11.1.4. Flywheel Energy Storage (FES)
- 11.1.5. Other Types
- 11.2. Market Analysis, Insights and Forecast - by Application
- 11.2.1. Residential
- 11.2.2. Commercial and Industrial
- 11.1. Market Analysis, Insights and Forecast - by Type
- 12. Competitive Analysis
- 12.1. Company Profiles
- 12.1.1 BYD Co Ltd
- 12.1.1.1. Company Overview
- 12.1.1.2. Products
- 12.1.1.3. Company Financials
- 12.1.1.4. SWOT Analysis
- 12.1.2 Contemporary Amperex Technology Co Limited
- 12.1.2.1. Company Overview
- 12.1.2.2. Products
- 12.1.2.3. Company Financials
- 12.1.2.4. SWOT Analysis
- 12.1.3 UniEnergy Technologies LLC
- 12.1.3.1. Company Overview
- 12.1.3.2. Products
- 12.1.3.3. Company Financials
- 12.1.3.4. SWOT Analysis
- 12.1.4 Samsung SDI Co Ltd
- 12.1.4.1. Company Overview
- 12.1.4.2. Products
- 12.1.4.3. Company Financials
- 12.1.4.4. SWOT Analysis
- 12.1.5 LG Energy Solution Ltd
- 12.1.5.1. Company Overview
- 12.1.5.2. Products
- 12.1.5.3. Company Financials
- 12.1.5.4. SWOT Analysis
- 12.1.6 NGK Insulators Ltd
- 12.1.6.1. Company Overview
- 12.1.6.2. Products
- 12.1.6.3. Company Financials
- 12.1.6.4. SWOT Analysis
- 12.1.7 Tesla Inc *List Not Exhaustive
- 12.1.7.1. Company Overview
- 12.1.7.2. Products
- 12.1.7.3. Company Financials
- 12.1.7.4. SWOT Analysis
- 12.1.8 Clarios (Formerly Johnson Controls International PLC)
- 12.1.8.1. Company Overview
- 12.1.8.2. Products
- 12.1.8.3. Company Financials
- 12.1.8.4. SWOT Analysis
- 12.1.9 GS Yuasa Corporation
- 12.1.9.1. Company Overview
- 12.1.9.2. Products
- 12.1.9.3. Company Financials
- 12.1.9.4. SWOT Analysis
- 12.1.1 BYD Co Ltd
- 12.2. Market Entropy
- 12.2.1 Company's Key Areas Served
- 12.2.2 Recent Developments
- 12.3. Company Market Share Analysis 2025
- 12.3.1 Top 5 Companies Market Share Analysis
- 12.3.2 Top 3 Companies Market Share Analysis
- 12.4. List of Potential Customers
- 13. Research Methodology
List of Figures
- Figure 1: Global Energy Storage Market Revenue Breakdown (Million, %) by Region 2025 & 2033
- Figure 2: Global Energy Storage Market Volume Breakdown (K Unit, %) by Region 2025 & 2033
- Figure 3: North America Energy Storage Market Revenue (Million), by Type 2025 & 2033
- Figure 4: North America Energy Storage Market Volume (K Unit), by Type 2025 & 2033
- Figure 5: North America Energy Storage Market Revenue Share (%), by Type 2025 & 2033
- Figure 6: North America Energy Storage Market Volume Share (%), by Type 2025 & 2033
- Figure 7: North America Energy Storage Market Revenue (Million), by Application 2025 & 2033
- Figure 8: North America Energy Storage Market Volume (K Unit), by Application 2025 & 2033
- Figure 9: North America Energy Storage Market Revenue Share (%), by Application 2025 & 2033
- Figure 10: North America Energy Storage Market Volume Share (%), by Application 2025 & 2033
- Figure 11: North America Energy Storage Market Revenue (Million), by Country 2025 & 2033
- Figure 12: North America Energy Storage Market Volume (K Unit), by Country 2025 & 2033
- Figure 13: North America Energy Storage Market Revenue Share (%), by Country 2025 & 2033
- Figure 14: North America Energy Storage Market Volume Share (%), by Country 2025 & 2033
- Figure 15: Asia Pacific Energy Storage Market Revenue (Million), by Type 2025 & 2033
- Figure 16: Asia Pacific Energy Storage Market Volume (K Unit), by Type 2025 & 2033
- Figure 17: Asia Pacific Energy Storage Market Revenue Share (%), by Type 2025 & 2033
- Figure 18: Asia Pacific Energy Storage Market Volume Share (%), by Type 2025 & 2033
- Figure 19: Asia Pacific Energy Storage Market Revenue (Million), by Application 2025 & 2033
- Figure 20: Asia Pacific Energy Storage Market Volume (K Unit), by Application 2025 & 2033
- Figure 21: Asia Pacific Energy Storage Market Revenue Share (%), by Application 2025 & 2033
- Figure 22: Asia Pacific Energy Storage Market Volume Share (%), by Application 2025 & 2033
- Figure 23: Asia Pacific Energy Storage Market Revenue (Million), by Country 2025 & 2033
- Figure 24: Asia Pacific Energy Storage Market Volume (K Unit), by Country 2025 & 2033
- Figure 25: Asia Pacific Energy Storage Market Revenue Share (%), by Country 2025 & 2033
- Figure 26: Asia Pacific Energy Storage Market Volume Share (%), by Country 2025 & 2033
- Figure 27: Europe Energy Storage Market Revenue (Million), by Type 2025 & 2033
- Figure 28: Europe Energy Storage Market Volume (K Unit), by Type 2025 & 2033
- Figure 29: Europe Energy Storage Market Revenue Share (%), by Type 2025 & 2033
- Figure 30: Europe Energy Storage Market Volume Share (%), by Type 2025 & 2033
- Figure 31: Europe Energy Storage Market Revenue (Million), by Application 2025 & 2033
- Figure 32: Europe Energy Storage Market Volume (K Unit), by Application 2025 & 2033
- Figure 33: Europe Energy Storage Market Revenue Share (%), by Application 2025 & 2033
- Figure 34: Europe Energy Storage Market Volume Share (%), by Application 2025 & 2033
- Figure 35: Europe Energy Storage Market Revenue (Million), by Country 2025 & 2033
- Figure 36: Europe Energy Storage Market Volume (K Unit), by Country 2025 & 2033
- Figure 37: Europe Energy Storage Market Revenue Share (%), by Country 2025 & 2033
- Figure 38: Europe Energy Storage Market Volume Share (%), by Country 2025 & 2033
- Figure 39: South America Energy Storage Market Revenue (Million), by Type 2025 & 2033
- Figure 40: South America Energy Storage Market Volume (K Unit), by Type 2025 & 2033
- Figure 41: South America Energy Storage Market Revenue Share (%), by Type 2025 & 2033
- Figure 42: South America Energy Storage Market Volume Share (%), by Type 2025 & 2033
- Figure 43: South America Energy Storage Market Revenue (Million), by Application 2025 & 2033
- Figure 44: South America Energy Storage Market Volume (K Unit), by Application 2025 & 2033
- Figure 45: South America Energy Storage Market Revenue Share (%), by Application 2025 & 2033
- Figure 46: South America Energy Storage Market Volume Share (%), by Application 2025 & 2033
- Figure 47: South America Energy Storage Market Revenue (Million), by Country 2025 & 2033
- Figure 48: South America Energy Storage Market Volume (K Unit), by Country 2025 & 2033
- Figure 49: South America Energy Storage Market Revenue Share (%), by Country 2025 & 2033
- Figure 50: South America Energy Storage Market Volume Share (%), by Country 2025 & 2033
- Figure 51: Middle East and Africa Energy Storage Market Revenue (Million), by Type 2025 & 2033
- Figure 52: Middle East and Africa Energy Storage Market Volume (K Unit), by Type 2025 & 2033
- Figure 53: Middle East and Africa Energy Storage Market Revenue Share (%), by Type 2025 & 2033
- Figure 54: Middle East and Africa Energy Storage Market Volume Share (%), by Type 2025 & 2033
- Figure 55: Middle East and Africa Energy Storage Market Revenue (Million), by Application 2025 & 2033
- Figure 56: Middle East and Africa Energy Storage Market Volume (K Unit), by Application 2025 & 2033
- Figure 57: Middle East and Africa Energy Storage Market Revenue Share (%), by Application 2025 & 2033
- Figure 58: Middle East and Africa Energy Storage Market Volume Share (%), by Application 2025 & 2033
- Figure 59: Middle East and Africa Energy Storage Market Revenue (Million), by Country 2025 & 2033
- Figure 60: Middle East and Africa Energy Storage Market Volume (K Unit), by Country 2025 & 2033
- Figure 61: Middle East and Africa Energy Storage Market Revenue Share (%), by Country 2025 & 2033
- Figure 62: Middle East and Africa Energy Storage Market Volume Share (%), by Country 2025 & 2033
List of Tables
- Table 1: Global Energy Storage Market Revenue Million Forecast, by Type 2020 & 2033
- Table 2: Global Energy Storage Market Volume K Unit Forecast, by Type 2020 & 2033
- Table 3: Global Energy Storage Market Revenue Million Forecast, by Application 2020 & 2033
- Table 4: Global Energy Storage Market Volume K Unit Forecast, by Application 2020 & 2033
- Table 5: Global Energy Storage Market Revenue Million Forecast, by Region 2020 & 2033
- Table 6: Global Energy Storage Market Volume K Unit Forecast, by Region 2020 & 2033
- Table 7: Global Energy Storage Market Revenue Million Forecast, by Type 2020 & 2033
- Table 8: Global Energy Storage Market Volume K Unit Forecast, by Type 2020 & 2033
- Table 9: Global Energy Storage Market Revenue Million Forecast, by Application 2020 & 2033
- Table 10: Global Energy Storage Market Volume K Unit Forecast, by Application 2020 & 2033
- Table 11: Global Energy Storage Market Revenue Million Forecast, by Country 2020 & 2033
- Table 12: Global Energy Storage Market Volume K Unit Forecast, by Country 2020 & 2033
- Table 13: United States Energy Storage Market Revenue (Million) Forecast, by Application 2020 & 2033
- Table 14: United States Energy Storage Market Volume (K Unit) Forecast, by Application 2020 & 2033
- Table 15: Canada Energy Storage Market Revenue (Million) Forecast, by Application 2020 & 2033
- Table 16: Canada Energy Storage Market Volume (K Unit) Forecast, by Application 2020 & 2033
- Table 17: Rest of North America Energy Storage Market Revenue (Million) Forecast, by Application 2020 & 2033
- Table 18: Rest of North America Energy Storage Market Volume (K Unit) Forecast, by Application 2020 & 2033
- Table 19: Global Energy Storage Market Revenue Million Forecast, by Type 2020 & 2033
- Table 20: Global Energy Storage Market Volume K Unit Forecast, by Type 2020 & 2033
- Table 21: Global Energy Storage Market Revenue Million Forecast, by Application 2020 & 2033
- Table 22: Global Energy Storage Market Volume K Unit Forecast, by Application 2020 & 2033
- Table 23: Global Energy Storage Market Revenue Million Forecast, by Country 2020 & 2033
- Table 24: Global Energy Storage Market Volume K Unit Forecast, by Country 2020 & 2033
- Table 25: India Energy Storage Market Revenue (Million) Forecast, by Application 2020 & 2033
- Table 26: India Energy Storage Market Volume (K Unit) Forecast, by Application 2020 & 2033
- Table 27: China Energy Storage Market Revenue (Million) Forecast, by Application 2020 & 2033
- Table 28: China Energy Storage Market Volume (K Unit) Forecast, by Application 2020 & 2033
- Table 29: Australia Energy Storage Market Revenue (Million) Forecast, by Application 2020 & 2033
- Table 30: Australia Energy Storage Market Volume (K Unit) Forecast, by Application 2020 & 2033
- Table 31: Rest of Asia Pacific Energy Storage Market Revenue (Million) Forecast, by Application 2020 & 2033
- Table 32: Rest of Asia Pacific Energy Storage Market Volume (K Unit) Forecast, by Application 2020 & 2033
- Table 33: Global Energy Storage Market Revenue Million Forecast, by Type 2020 & 2033
- Table 34: Global Energy Storage Market Volume K Unit Forecast, by Type 2020 & 2033
- Table 35: Global Energy Storage Market Revenue Million Forecast, by Application 2020 & 2033
- Table 36: Global Energy Storage Market Volume K Unit Forecast, by Application 2020 & 2033
- Table 37: Global Energy Storage Market Revenue Million Forecast, by Country 2020 & 2033
- Table 38: Global Energy Storage Market Volume K Unit Forecast, by Country 2020 & 2033
- Table 39: Germany Energy Storage Market Revenue (Million) Forecast, by Application 2020 & 2033
- Table 40: Germany Energy Storage Market Volume (K Unit) Forecast, by Application 2020 & 2033
- Table 41: United Kingdom Energy Storage Market Revenue (Million) Forecast, by Application 2020 & 2033
- Table 42: United Kingdom Energy Storage Market Volume (K Unit) Forecast, by Application 2020 & 2033
- Table 43: Rest of Europe Energy Storage Market Revenue (Million) Forecast, by Application 2020 & 2033
- Table 44: Rest of Europe Energy Storage Market Volume (K Unit) Forecast, by Application 2020 & 2033
- Table 45: Global Energy Storage Market Revenue Million Forecast, by Type 2020 & 2033
- Table 46: Global Energy Storage Market Volume K Unit Forecast, by Type 2020 & 2033
- Table 47: Global Energy Storage Market Revenue Million Forecast, by Application 2020 & 2033
- Table 48: Global Energy Storage Market Volume K Unit Forecast, by Application 2020 & 2033
- Table 49: Global Energy Storage Market Revenue Million Forecast, by Country 2020 & 2033
- Table 50: Global Energy Storage Market Volume K Unit Forecast, by Country 2020 & 2033
- Table 51: Brazil Energy Storage Market Revenue (Million) Forecast, by Application 2020 & 2033
- Table 52: Brazil Energy Storage Market Volume (K Unit) Forecast, by Application 2020 & 2033
- Table 53: Argentina Energy Storage Market Revenue (Million) Forecast, by Application 2020 & 2033
- Table 54: Argentina Energy Storage Market Volume (K Unit) Forecast, by Application 2020 & 2033
- Table 55: Rest of South America Energy Storage Market Revenue (Million) Forecast, by Application 2020 & 2033
- Table 56: Rest of South America Energy Storage Market Volume (K Unit) Forecast, by Application 2020 & 2033
- Table 57: Global Energy Storage Market Revenue Million Forecast, by Type 2020 & 2033
- Table 58: Global Energy Storage Market Volume K Unit Forecast, by Type 2020 & 2033
- Table 59: Global Energy Storage Market Revenue Million Forecast, by Application 2020 & 2033
- Table 60: Global Energy Storage Market Volume K Unit Forecast, by Application 2020 & 2033
- Table 61: Global Energy Storage Market Revenue Million Forecast, by Country 2020 & 2033
- Table 62: Global Energy Storage Market Volume K Unit Forecast, by Country 2020 & 2033
- Table 63: Saudi Arabia Energy Storage Market Revenue (Million) Forecast, by Application 2020 & 2033
- Table 64: Saudi Arabia Energy Storage Market Volume (K Unit) Forecast, by Application 2020 & 2033
- Table 65: Iraq Energy Storage Market Revenue (Million) Forecast, by Application 2020 & 2033
- Table 66: Iraq Energy Storage Market Volume (K Unit) Forecast, by Application 2020 & 2033
- Table 67: Jordan Energy Storage Market Revenue (Million) Forecast, by Application 2020 & 2033
- Table 68: Jordan Energy Storage Market Volume (K Unit) Forecast, by Application 2020 & 2033
- Table 69: Rest of Middle East and Africa Energy Storage Market Revenue (Million) Forecast, by Application 2020 & 2033
- Table 70: Rest of Middle East and Africa Energy Storage Market Volume (K Unit) Forecast, by Application 2020 & 2033
Frequently Asked Questions
1. What is the projected Compound Annual Growth Rate (CAGR) of the Energy Storage Market?
The projected CAGR is approximately 14.31%.
2. Which companies are prominent players in the Energy Storage Market?
Key companies in the market include BYD Co Ltd, Contemporary Amperex Technology Co Limited, UniEnergy Technologies LLC, Samsung SDI Co Ltd, LG Energy Solution Ltd, NGK Insulators Ltd, Tesla Inc *List Not Exhaustive, Clarios (Formerly Johnson Controls International PLC), GS Yuasa Corporation.
3. What are the main segments of the Energy Storage Market?
The market segments include Type, Application.
4. Can you provide details about the market size?
The market size is estimated to be USD 51.10 Million as of 2022.
5. What are some drivers contributing to market growth?
Rising Supporting Government Policies for Solar Energy in South Africa4.; Increasing Investment in Renewable Energy Such as Solar. Wind. and Others.
6. What are the notable trends driving market growth?
Batteries Segment to Dominate the Market.
7. Are there any restraints impacting market growth?
Increasing Adoption of Alternate Renewable Technologies Such as Wind.
8. Can you provide examples of recent developments in the market?
February 2022: The partnership between FIMER and Vega Solar supplied 14 PVS-100 inverters, a three-phase string solution, to Albania. The PVS-100/120-TL is a cloud-connected three-phase string inverter by FIMER designed for cost-effective decentralized solar systems on both ground and rooftops.
9. What pricing options are available for accessing the report?
Pricing options include single-user, multi-user, and enterprise licenses priced at USD 4750, USD 5250, and USD 8750 respectively.
10. Is the market size provided in terms of value or volume?
The market size is provided in terms of value, measured in Million and volume, measured in K Unit.
11. Are there any specific market keywords associated with the report?
Yes, the market keyword associated with the report is "Energy Storage Market," which aids in identifying and referencing the specific market segment covered.
12. How do I determine which pricing option suits my needs best?
The pricing options vary based on user requirements and access needs. Individual users may opt for single-user licenses, while businesses requiring broader access may choose multi-user or enterprise licenses for cost-effective access to the report.
13. Are there any additional resources or data provided in the Energy Storage Market report?
While the report offers comprehensive insights, it's advisable to review the specific contents or supplementary materials provided to ascertain if additional resources or data are available.
14. How can I stay updated on further developments or reports in the Energy Storage Market?
To stay informed about further developments, trends, and reports in the Energy Storage Market, consider subscribing to industry newsletters, following relevant companies and organizations, or regularly checking reputable industry news sources and publications.
Methodology
Step 1 - Identification of Relevant Samples Size from Population Database


Step 2 - Approaches for Defining Global Market Size (Value, Volume* & Price*)

Note*: In applicable scenarios
Step 3 - Data Sources
Primary Research
- Web Analytics
- Survey Reports
- Research Institute
- Latest Research Reports
- Opinion Leaders
Secondary Research
- Annual Reports
- White Paper
- Latest Press Release
- Industry Association
- Paid Database
- Investor Presentations

Step 4 - Data Triangulation
Involves using different sources of information in order to increase the validity of a study
These sources are likely to be stakeholders in a program - participants, other researchers, program staff, other community members, and so on.
Then we put all data in single framework & apply various statistical tools to find out the dynamic on the market.
During the analysis stage, feedback from the stakeholder groups would be compared to determine areas of agreement as well as areas of divergence