

Key Insights
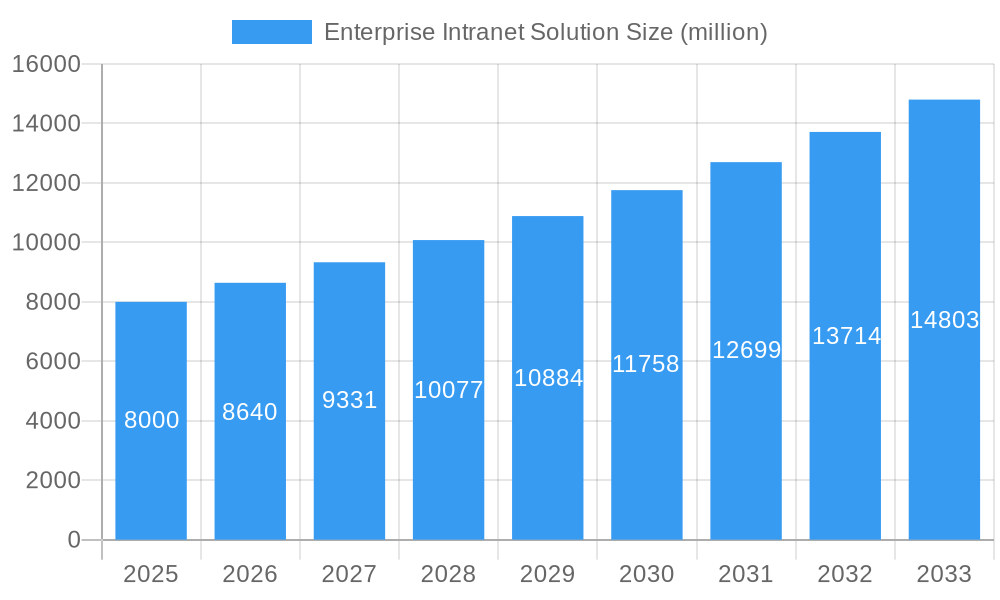
The Enterprise Intranet Solution market is projected for significant expansion, driven by the critical need for advanced internal communication and collaboration across all organizational tiers. Key growth accelerators include the widespread adoption of scalable and cost-effective cloud-based platforms, elevated demand for enhanced employee engagement and productivity via streamlined workflows and knowledge dissemination, and the pervasive push for digital transformation across diverse sectors. The integration of sophisticated features, including AI-powered search, mobile accessibility, and robust security protocols, is further bolstering market penetration. The market is valued at $17.4 billion in 2025, with a projected Compound Annual Growth Rate (CAGR) of 11%.
Enterprise Intranet Solution Market Size (In Billion)
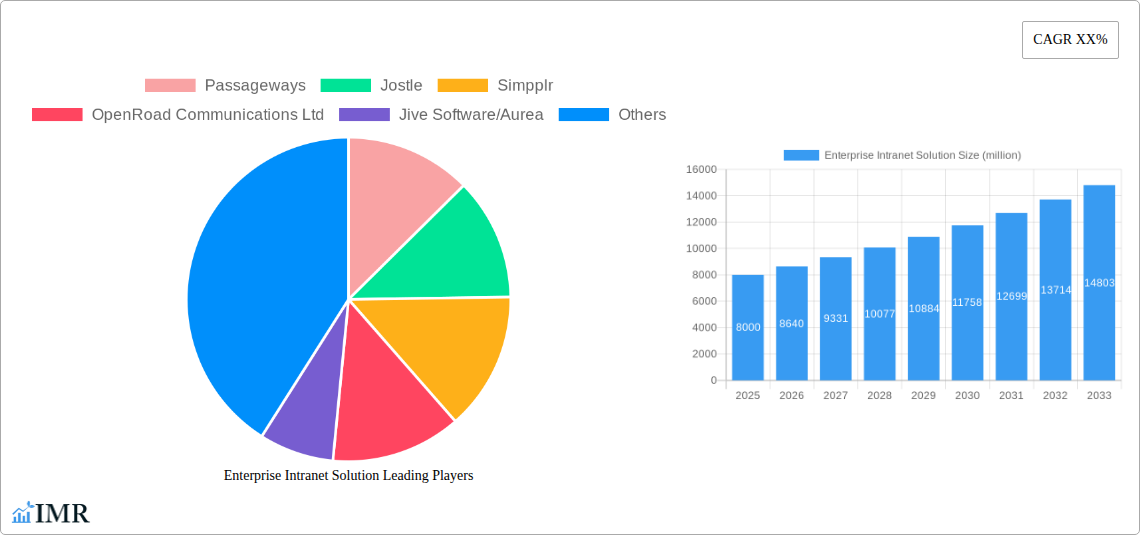
The competitive arena features prominent established vendors such as Microsoft and Zoho, alongside specialized providers like Passageways, Jostle, and Simpplr. A discernible trend indicates a market evolution towards integrated platforms that transcend basic communication, offering comprehensive solutions for knowledge management, employee onboarding, and internal social networking. The introduction of innovative functionalities and a heightened emphasis on user experience are redefining market dynamics. Despite robust growth prospects, challenges persist, notably the intricate integration with existing enterprise systems and the imperative for continuous updates to maintain security and compliance with evolving data privacy regulations. The forecast period (2025-2033) anticipates sustained expansion, fueled by ongoing technological innovation and the escalating adoption of digital workplace strategies.
Enterprise Intranet Solution Company Market Share
Enterprise Intranet Solution Market Report: 2019-2033
This comprehensive report provides a detailed analysis of the Enterprise Intranet Solution market, offering invaluable insights for businesses, investors, and industry professionals. Covering the period from 2019 to 2033, with a focus on 2025, this study meticulously examines market dynamics, growth trends, key players, and future opportunities within this rapidly evolving landscape. The report leverages extensive primary and secondary research to provide accurate forecasts and in-depth analysis, covering parent markets like Enterprise Software and child markets such as Digital Workplace solutions. The total market size in 2025 is estimated at $xx billion.
Enterprise Intranet Solution Market Dynamics & Structure
The Enterprise Intranet Solution market is characterized by a moderately concentrated landscape, with key players like Microsoft, Zoho, and Passageways holding significant market share. Technological innovation, particularly in areas like AI-powered search, enhanced collaboration tools, and improved security features, is a major driver. Regulatory frameworks, such as data privacy regulations (GDPR, CCPA), significantly impact market dynamics. Competitive substitutes include other communication and collaboration platforms, creating a dynamic competitive environment. The market exhibits diverse end-user demographics across various industries (e.g., BFSI, Healthcare, Manufacturing). M&A activity is moderate, with an estimated xx deals closed in the historical period (2019-2024), primarily driven by the need for enhanced functionalities and expanded market reach.
- Market Concentration: Moderately concentrated, with top 5 players holding approximately xx% market share in 2025.
- Technological Innovation: AI-powered search, enhanced collaboration, and improved security are key drivers.
- Regulatory Framework: GDPR, CCPA, and other data privacy regulations influence market strategies.
- Competitive Substitutes: Slack, Microsoft Teams, and other collaboration platforms pose competitive threats.
- End-User Demographics: Diverse across industries, with significant adoption in large enterprises.
- M&A Activity: Estimated xx M&A deals between 2019 and 2024.
Enterprise Intranet Solution Growth Trends & Insights
The Enterprise Intranet Solution market experienced substantial growth during the historical period (2019-2024), with a CAGR of xx%. This growth is fueled by increasing digital transformation initiatives within enterprises, rising demand for improved internal communication and collaboration, and the need for secure information sharing. The adoption rate has significantly increased, with xx% market penetration in 2025. Technological disruptions, such as the rise of cloud-based solutions and mobile-first design, have further accelerated market growth. Consumer behavior shifts towards remote work and flexible work arrangements are also driving demand for robust and user-friendly intranet solutions. We project a CAGR of xx% for the forecast period (2025-2033), reaching an estimated market size of $xx billion by 2033.
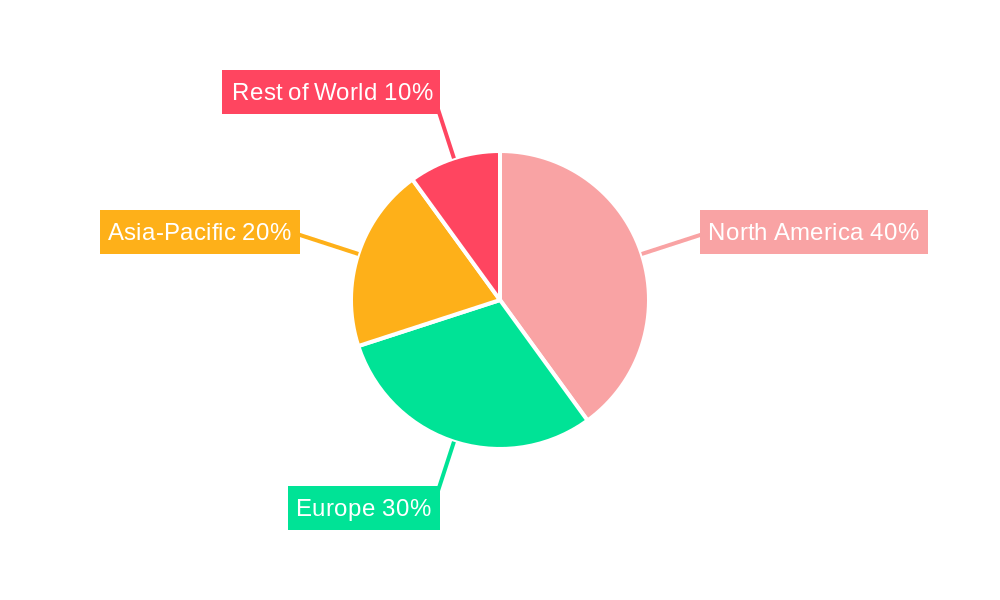
Dominant Regions, Countries, or Segments in Enterprise Intranet Solution
North America currently holds the largest market share in the Enterprise Intranet Solution market, driven by high technological adoption rates and a large number of multinational corporations. The region's robust IT infrastructure and favorable economic conditions contribute to this dominance. Europe follows closely, with strong growth driven by increasing digitalization efforts and stringent data privacy regulations. Key growth drivers in North America include the high concentration of large enterprises, technological advancements, and supportive government policies promoting digital transformation. Asia-Pacific is also experiencing significant growth, though starting from a smaller base.
- North America: High technological adoption, robust IT infrastructure, and a large number of enterprises drive market leadership.
- Europe: Increasing digitalization and stringent data privacy regulations stimulate growth.
- Asia-Pacific: High growth potential due to rising internet penetration and increasing adoption of cloud-based solutions.
Enterprise Intranet Solution Product Landscape
The Enterprise Intranet Solution market offers a diverse range of products, from basic communication platforms to sophisticated solutions integrating AI, advanced analytics, and robust security features. Innovation focuses on improving user experience, enhancing collaboration functionalities, and integrating with other enterprise applications. Key features driving product differentiation include personalized dashboards, advanced search capabilities, and seamless mobile accessibility. Many solutions are now offered as cloud-based SaaS offerings, providing scalability and cost-effectiveness.
Key Drivers, Barriers & Challenges in Enterprise Intranet Solution
Key Drivers: The increasing need for improved internal communication and collaboration, rising adoption of cloud-based solutions, and the growing focus on digital workplace transformation are driving market growth. Government initiatives promoting digitalization further accelerate adoption.
Challenges: High implementation costs, integration complexities with existing IT infrastructure, and the need for robust security measures to protect sensitive data pose significant challenges. Competition from other collaboration platforms also creates pressure on market players. Supply chain disruptions can impact the availability of hardware and software components.
Emerging Opportunities in Enterprise Intranet Solution
The increasing adoption of AI and machine learning in intranet solutions presents significant opportunities for innovation. Integrating advanced analytics to provide valuable insights into employee behavior and productivity is another area with significant growth potential. The untapped market in small and medium-sized enterprises (SMEs) also offers considerable opportunities for expansion. Focus on creating hyper-personalized experiences for employees can also enhance user adoption.
Growth Accelerators in the Enterprise Intranet Solution Industry
Strategic partnerships between intranet solution providers and other technology vendors, fostering seamless integration with enterprise applications, accelerate growth. Technological breakthroughs in areas such as AI, enhanced security, and improved user experience continue to drive market expansion. Market expansion into emerging economies with growing digitalization efforts also contribute significantly to the industry's growth trajectory.
Key Players Shaping the Enterprise Intranet Solution Market
- Passageways
- Jostle
- Simpplr
- OpenRoad Communications Ltd
- Jive Software/Aurea
- Bonzai
- Twine
- Hub Intranet
- Vialect Inc
- Microsoft
- Zoho
- Axero Solutions, LLC
- IC
- Verint
Notable Milestones in Enterprise Intranet Solution Sector
- 2020: Increased adoption of cloud-based intranet solutions due to the pandemic-induced shift to remote work.
- 2021: Several key players launched AI-powered features in their intranet platforms.
- 2022: Increased focus on employee experience and personalized dashboards.
- 2023: Significant investments in security features to address growing cyber threats.
- 2024: Several mergers and acquisitions aimed at expanding market reach and product portfolios.
In-Depth Enterprise Intranet Solution Market Outlook
The Enterprise Intranet Solution market is poised for sustained growth over the forecast period, driven by continuous technological advancements and increasing demand for improved internal communication and collaboration. Strategic partnerships, expansion into untapped markets, and continuous innovation in areas such as AI and security will be key to unlocking future market potential. The increasing emphasis on employee experience and digital workplace transformation will further accelerate market expansion, creating significant opportunities for businesses operating in this space.
Enterprise Intranet Solution Segmentation
-
1. Application
- 1.1. Small Enterprises(10 to 49 Employees)
- 1.2. Medium-sized Enterprises(50 to 249 Employees)
- 1.3. Large Enterprises(Employ 250 or More People)
-
2. Types
- 2.1. Cloud Based
- 2.2. Web Based
Enterprise Intranet Solution Segmentation By Geography
-
1. North America
- 1.1. United States
- 1.2. Canada
- 1.3. Mexico
-
2. South America
- 2.1. Brazil
- 2.2. Argentina
- 2.3. Rest of South America
-
3. Europe
- 3.1. United Kingdom
- 3.2. Germany
- 3.3. France
- 3.4. Italy
- 3.5. Spain
- 3.6. Russia
- 3.7. Benelux
- 3.8. Nordics
- 3.9. Rest of Europe
-
4. Middle East & Africa
- 4.1. Turkey
- 4.2. Israel
- 4.3. GCC
- 4.4. North Africa
- 4.5. South Africa
- 4.6. Rest of Middle East & Africa
-
5. Asia Pacific
- 5.1. China
- 5.2. India
- 5.3. Japan
- 5.4. South Korea
- 5.5. ASEAN
- 5.6. Oceania
- 5.7. Rest of Asia Pacific
Enterprise Intranet Solution Regional Market Share
Geographic Coverage of Enterprise Intranet Solution
Enterprise Intranet Solution REPORT HIGHLIGHTS
| Aspects | Details |
|---|---|
| Study Period | 2020-2034 |
| Base Year | 2025 |
| Estimated Year | 2026 |
| Forecast Period | 2026-2034 |
| Historical Period | 2020-2025 |
| Growth Rate | CAGR of 11% from 2020-2034 |
| Segmentation |
|
Table of Contents
- 1. Introduction
- 1.1. Research Scope
- 1.2. Market Segmentation
- 1.3. Research Objective
- 1.4. Definitions and Assumptions
- 2. Executive Summary
- 2.1. Market Snapshot
- 3. Market Dynamics
- 3.1. Market Drivers
- 3.2. Market Restrains
- 3.3. Market Trends
- 3.4. Market Opportunities
- 4. Market Factor Analysis
- 4.1. Porters Five Forces
- 4.1.1. Bargaining Power of Suppliers
- 4.1.2. Bargaining Power of Buyers
- 4.1.3. Threat of New Entrants
- 4.1.4. Threat of Substitutes
- 4.1.5. Competitive Rivalry
- 4.2. PESTEL analysis
- 4.3. BCG Analysis
- 4.3.1. Stars (High Growth, High Market Share)
- 4.3.2. Cash Cows (Low Growth, High Market Share)
- 4.3.3. Question Mark (High Growth, Low Market Share)
- 4.3.4. Dogs (Low Growth, Low Market Share)
- 4.4. Ansoff Matrix Analysis
- 4.5. Supply Chain Analysis
- 4.6. Regulatory Landscape
- 4.7. Current Market Potential and Opportunity Assessment (TAM–SAM–SOM Framework)
- 4.8. IMR Analyst Note
- 4.1. Porters Five Forces
- 5. Market Analysis, Insights and Forecast 2021-2033
- 5.1. Market Analysis, Insights and Forecast - by Application
- 5.1.1. Small Enterprises(10 to 49 Employees)
- 5.1.2. Medium-sized Enterprises(50 to 249 Employees)
- 5.1.3. Large Enterprises(Employ 250 or More People)
- 5.2. Market Analysis, Insights and Forecast - by Types
- 5.2.1. Cloud Based
- 5.2.2. Web Based
- 5.3. Market Analysis, Insights and Forecast - by Region
- 5.3.1. North America
- 5.3.2. South America
- 5.3.3. Europe
- 5.3.4. Middle East & Africa
- 5.3.5. Asia Pacific
- 5.1. Market Analysis, Insights and Forecast - by Application
- 6. Global Enterprise Intranet Solution Analysis, Insights and Forecast, 2021-2033
- 6.1. Market Analysis, Insights and Forecast - by Application
- 6.1.1. Small Enterprises(10 to 49 Employees)
- 6.1.2. Medium-sized Enterprises(50 to 249 Employees)
- 6.1.3. Large Enterprises(Employ 250 or More People)
- 6.2. Market Analysis, Insights and Forecast - by Types
- 6.2.1. Cloud Based
- 6.2.2. Web Based
- 6.1. Market Analysis, Insights and Forecast - by Application
- 7. North America Enterprise Intranet Solution Analysis, Insights and Forecast, 2020-2032
- 7.1. Market Analysis, Insights and Forecast - by Application
- 7.1.1. Small Enterprises(10 to 49 Employees)
- 7.1.2. Medium-sized Enterprises(50 to 249 Employees)
- 7.1.3. Large Enterprises(Employ 250 or More People)
- 7.2. Market Analysis, Insights and Forecast - by Types
- 7.2.1. Cloud Based
- 7.2.2. Web Based
- 7.1. Market Analysis, Insights and Forecast - by Application
- 8. South America Enterprise Intranet Solution Analysis, Insights and Forecast, 2020-2032
- 8.1. Market Analysis, Insights and Forecast - by Application
- 8.1.1. Small Enterprises(10 to 49 Employees)
- 8.1.2. Medium-sized Enterprises(50 to 249 Employees)
- 8.1.3. Large Enterprises(Employ 250 or More People)
- 8.2. Market Analysis, Insights and Forecast - by Types
- 8.2.1. Cloud Based
- 8.2.2. Web Based
- 8.1. Market Analysis, Insights and Forecast - by Application
- 9. Europe Enterprise Intranet Solution Analysis, Insights and Forecast, 2020-2032
- 9.1. Market Analysis, Insights and Forecast - by Application
- 9.1.1. Small Enterprises(10 to 49 Employees)
- 9.1.2. Medium-sized Enterprises(50 to 249 Employees)
- 9.1.3. Large Enterprises(Employ 250 or More People)
- 9.2. Market Analysis, Insights and Forecast - by Types
- 9.2.1. Cloud Based
- 9.2.2. Web Based
- 9.1. Market Analysis, Insights and Forecast - by Application
- 10. Middle East & Africa Enterprise Intranet Solution Analysis, Insights and Forecast, 2020-2032
- 10.1. Market Analysis, Insights and Forecast - by Application
- 10.1.1. Small Enterprises(10 to 49 Employees)
- 10.1.2. Medium-sized Enterprises(50 to 249 Employees)
- 10.1.3. Large Enterprises(Employ 250 or More People)
- 10.2. Market Analysis, Insights and Forecast - by Types
- 10.2.1. Cloud Based
- 10.2.2. Web Based
- 10.1. Market Analysis, Insights and Forecast - by Application
- 11. Asia Pacific Enterprise Intranet Solution Analysis, Insights and Forecast, 2020-2032
- 11.1. Market Analysis, Insights and Forecast - by Application
- 11.1.1. Small Enterprises(10 to 49 Employees)
- 11.1.2. Medium-sized Enterprises(50 to 249 Employees)
- 11.1.3. Large Enterprises(Employ 250 or More People)
- 11.2. Market Analysis, Insights and Forecast - by Types
- 11.2.1. Cloud Based
- 11.2.2. Web Based
- 11.1. Market Analysis, Insights and Forecast - by Application
- 12. Competitive Analysis
- 12.1. Company Profiles
- 12.1.1 Passageways
- 12.1.1.1. Company Overview
- 12.1.1.2. Products
- 12.1.1.3. Company Financials
- 12.1.1.4. SWOT Analysis
- 12.1.2 Jostle
- 12.1.2.1. Company Overview
- 12.1.2.2. Products
- 12.1.2.3. Company Financials
- 12.1.2.4. SWOT Analysis
- 12.1.3 Simpplr
- 12.1.3.1. Company Overview
- 12.1.3.2. Products
- 12.1.3.3. Company Financials
- 12.1.3.4. SWOT Analysis
- 12.1.4 OpenRoad Communications Ltd
- 12.1.4.1. Company Overview
- 12.1.4.2. Products
- 12.1.4.3. Company Financials
- 12.1.4.4. SWOT Analysis
- 12.1.5 Jive Software/Aurea
- 12.1.5.1. Company Overview
- 12.1.5.2. Products
- 12.1.5.3. Company Financials
- 12.1.5.4. SWOT Analysis
- 12.1.6 Bonzai
- 12.1.6.1. Company Overview
- 12.1.6.2. Products
- 12.1.6.3. Company Financials
- 12.1.6.4. SWOT Analysis
- 12.1.7 Twine
- 12.1.7.1. Company Overview
- 12.1.7.2. Products
- 12.1.7.3. Company Financials
- 12.1.7.4. SWOT Analysis
- 12.1.8 Hub Intranet
- 12.1.8.1. Company Overview
- 12.1.8.2. Products
- 12.1.8.3. Company Financials
- 12.1.8.4. SWOT Analysis
- 12.1.9 Vialect Inc
- 12.1.9.1. Company Overview
- 12.1.9.2. Products
- 12.1.9.3. Company Financials
- 12.1.9.4. SWOT Analysis
- 12.1.10 Microsoft
- 12.1.10.1. Company Overview
- 12.1.10.2. Products
- 12.1.10.3. Company Financials
- 12.1.10.4. SWOT Analysis
- 12.1.11 Zoho
- 12.1.11.1. Company Overview
- 12.1.11.2. Products
- 12.1.11.3. Company Financials
- 12.1.11.4. SWOT Analysis
- 12.1.12 Axero Solutions
- 12.1.12.1. Company Overview
- 12.1.12.2. Products
- 12.1.12.3. Company Financials
- 12.1.12.4. SWOT Analysis
- 12.1.13 LLC
- 12.1.13.1. Company Overview
- 12.1.13.2. Products
- 12.1.13.3. Company Financials
- 12.1.13.4. SWOT Analysis
- 12.1.14 IC
- 12.1.14.1. Company Overview
- 12.1.14.2. Products
- 12.1.14.3. Company Financials
- 12.1.14.4. SWOT Analysis
- 12.1.15 Verint
- 12.1.15.1. Company Overview
- 12.1.15.2. Products
- 12.1.15.3. Company Financials
- 12.1.15.4. SWOT Analysis
- 12.1.1 Passageways
- 12.2. Market Entropy
- 12.2.1 Company's Key Areas Served
- 12.2.2 Recent Developments
- 12.3. Company Market Share Analysis 2025
- 12.3.1 Top 5 Companies Market Share Analysis
- 12.3.2 Top 3 Companies Market Share Analysis
- 12.4. List of Potential Customers
- 13. Research Methodology
List of Figures
- Figure 1: Global Enterprise Intranet Solution Revenue Breakdown (billion, %) by Region 2025 & 2033
- Figure 2: North America Enterprise Intranet Solution Revenue (billion), by Application 2025 & 2033
- Figure 3: North America Enterprise Intranet Solution Revenue Share (%), by Application 2025 & 2033
- Figure 4: North America Enterprise Intranet Solution Revenue (billion), by Types 2025 & 2033
- Figure 5: North America Enterprise Intranet Solution Revenue Share (%), by Types 2025 & 2033
- Figure 6: North America Enterprise Intranet Solution Revenue (billion), by Country 2025 & 2033
- Figure 7: North America Enterprise Intranet Solution Revenue Share (%), by Country 2025 & 2033
- Figure 8: South America Enterprise Intranet Solution Revenue (billion), by Application 2025 & 2033
- Figure 9: South America Enterprise Intranet Solution Revenue Share (%), by Application 2025 & 2033
- Figure 10: South America Enterprise Intranet Solution Revenue (billion), by Types 2025 & 2033
- Figure 11: South America Enterprise Intranet Solution Revenue Share (%), by Types 2025 & 2033
- Figure 12: South America Enterprise Intranet Solution Revenue (billion), by Country 2025 & 2033
- Figure 13: South America Enterprise Intranet Solution Revenue Share (%), by Country 2025 & 2033
- Figure 14: Europe Enterprise Intranet Solution Revenue (billion), by Application 2025 & 2033
- Figure 15: Europe Enterprise Intranet Solution Revenue Share (%), by Application 2025 & 2033
- Figure 16: Europe Enterprise Intranet Solution Revenue (billion), by Types 2025 & 2033
- Figure 17: Europe Enterprise Intranet Solution Revenue Share (%), by Types 2025 & 2033
- Figure 18: Europe Enterprise Intranet Solution Revenue (billion), by Country 2025 & 2033
- Figure 19: Europe Enterprise Intranet Solution Revenue Share (%), by Country 2025 & 2033
- Figure 20: Middle East & Africa Enterprise Intranet Solution Revenue (billion), by Application 2025 & 2033
- Figure 21: Middle East & Africa Enterprise Intranet Solution Revenue Share (%), by Application 2025 & 2033
- Figure 22: Middle East & Africa Enterprise Intranet Solution Revenue (billion), by Types 2025 & 2033
- Figure 23: Middle East & Africa Enterprise Intranet Solution Revenue Share (%), by Types 2025 & 2033
- Figure 24: Middle East & Africa Enterprise Intranet Solution Revenue (billion), by Country 2025 & 2033
- Figure 25: Middle East & Africa Enterprise Intranet Solution Revenue Share (%), by Country 2025 & 2033
- Figure 26: Asia Pacific Enterprise Intranet Solution Revenue (billion), by Application 2025 & 2033
- Figure 27: Asia Pacific Enterprise Intranet Solution Revenue Share (%), by Application 2025 & 2033
- Figure 28: Asia Pacific Enterprise Intranet Solution Revenue (billion), by Types 2025 & 2033
- Figure 29: Asia Pacific Enterprise Intranet Solution Revenue Share (%), by Types 2025 & 2033
- Figure 30: Asia Pacific Enterprise Intranet Solution Revenue (billion), by Country 2025 & 2033
- Figure 31: Asia Pacific Enterprise Intranet Solution Revenue Share (%), by Country 2025 & 2033
List of Tables
- Table 1: Global Enterprise Intranet Solution Revenue billion Forecast, by Application 2020 & 2033
- Table 2: Global Enterprise Intranet Solution Revenue billion Forecast, by Types 2020 & 2033
- Table 3: Global Enterprise Intranet Solution Revenue billion Forecast, by Region 2020 & 2033
- Table 4: Global Enterprise Intranet Solution Revenue billion Forecast, by Application 2020 & 2033
- Table 5: Global Enterprise Intranet Solution Revenue billion Forecast, by Types 2020 & 2033
- Table 6: Global Enterprise Intranet Solution Revenue billion Forecast, by Country 2020 & 2033
- Table 7: United States Enterprise Intranet Solution Revenue (billion) Forecast, by Application 2020 & 2033
- Table 8: Canada Enterprise Intranet Solution Revenue (billion) Forecast, by Application 2020 & 2033
- Table 9: Mexico Enterprise Intranet Solution Revenue (billion) Forecast, by Application 2020 & 2033
- Table 10: Global Enterprise Intranet Solution Revenue billion Forecast, by Application 2020 & 2033
- Table 11: Global Enterprise Intranet Solution Revenue billion Forecast, by Types 2020 & 2033
- Table 12: Global Enterprise Intranet Solution Revenue billion Forecast, by Country 2020 & 2033
- Table 13: Brazil Enterprise Intranet Solution Revenue (billion) Forecast, by Application 2020 & 2033
- Table 14: Argentina Enterprise Intranet Solution Revenue (billion) Forecast, by Application 2020 & 2033
- Table 15: Rest of South America Enterprise Intranet Solution Revenue (billion) Forecast, by Application 2020 & 2033
- Table 16: Global Enterprise Intranet Solution Revenue billion Forecast, by Application 2020 & 2033
- Table 17: Global Enterprise Intranet Solution Revenue billion Forecast, by Types 2020 & 2033
- Table 18: Global Enterprise Intranet Solution Revenue billion Forecast, by Country 2020 & 2033
- Table 19: United Kingdom Enterprise Intranet Solution Revenue (billion) Forecast, by Application 2020 & 2033
- Table 20: Germany Enterprise Intranet Solution Revenue (billion) Forecast, by Application 2020 & 2033
- Table 21: France Enterprise Intranet Solution Revenue (billion) Forecast, by Application 2020 & 2033
- Table 22: Italy Enterprise Intranet Solution Revenue (billion) Forecast, by Application 2020 & 2033
- Table 23: Spain Enterprise Intranet Solution Revenue (billion) Forecast, by Application 2020 & 2033
- Table 24: Russia Enterprise Intranet Solution Revenue (billion) Forecast, by Application 2020 & 2033
- Table 25: Benelux Enterprise Intranet Solution Revenue (billion) Forecast, by Application 2020 & 2033
- Table 26: Nordics Enterprise Intranet Solution Revenue (billion) Forecast, by Application 2020 & 2033
- Table 27: Rest of Europe Enterprise Intranet Solution Revenue (billion) Forecast, by Application 2020 & 2033
- Table 28: Global Enterprise Intranet Solution Revenue billion Forecast, by Application 2020 & 2033
- Table 29: Global Enterprise Intranet Solution Revenue billion Forecast, by Types 2020 & 2033
- Table 30: Global Enterprise Intranet Solution Revenue billion Forecast, by Country 2020 & 2033
- Table 31: Turkey Enterprise Intranet Solution Revenue (billion) Forecast, by Application 2020 & 2033
- Table 32: Israel Enterprise Intranet Solution Revenue (billion) Forecast, by Application 2020 & 2033
- Table 33: GCC Enterprise Intranet Solution Revenue (billion) Forecast, by Application 2020 & 2033
- Table 34: North Africa Enterprise Intranet Solution Revenue (billion) Forecast, by Application 2020 & 2033
- Table 35: South Africa Enterprise Intranet Solution Revenue (billion) Forecast, by Application 2020 & 2033
- Table 36: Rest of Middle East & Africa Enterprise Intranet Solution Revenue (billion) Forecast, by Application 2020 & 2033
- Table 37: Global Enterprise Intranet Solution Revenue billion Forecast, by Application 2020 & 2033
- Table 38: Global Enterprise Intranet Solution Revenue billion Forecast, by Types 2020 & 2033
- Table 39: Global Enterprise Intranet Solution Revenue billion Forecast, by Country 2020 & 2033
- Table 40: China Enterprise Intranet Solution Revenue (billion) Forecast, by Application 2020 & 2033
- Table 41: India Enterprise Intranet Solution Revenue (billion) Forecast, by Application 2020 & 2033
- Table 42: Japan Enterprise Intranet Solution Revenue (billion) Forecast, by Application 2020 & 2033
- Table 43: South Korea Enterprise Intranet Solution Revenue (billion) Forecast, by Application 2020 & 2033
- Table 44: ASEAN Enterprise Intranet Solution Revenue (billion) Forecast, by Application 2020 & 2033
- Table 45: Oceania Enterprise Intranet Solution Revenue (billion) Forecast, by Application 2020 & 2033
- Table 46: Rest of Asia Pacific Enterprise Intranet Solution Revenue (billion) Forecast, by Application 2020 & 2033
Frequently Asked Questions
1. What is the projected Compound Annual Growth Rate (CAGR) of the Enterprise Intranet Solution?
The projected CAGR is approximately 11%.
2. Which companies are prominent players in the Enterprise Intranet Solution?
Key companies in the market include Passageways, Jostle, Simpplr, OpenRoad Communications Ltd, Jive Software/Aurea, Bonzai, Twine, Hub Intranet, Vialect Inc, Microsoft, Zoho, Axero Solutions, LLC, IC, Verint.
3. What are the main segments of the Enterprise Intranet Solution?
The market segments include Application, Types.
4. Can you provide details about the market size?
The market size is estimated to be USD 17.4 billion as of 2022.
5. What are some drivers contributing to market growth?
N/A
6. What are the notable trends driving market growth?
N/A
7. Are there any restraints impacting market growth?
N/A
8. Can you provide examples of recent developments in the market?
N/A
9. What pricing options are available for accessing the report?
Pricing options include single-user, multi-user, and enterprise licenses priced at USD 4900.00, USD 7350.00, and USD 9800.00 respectively.
10. Is the market size provided in terms of value or volume?
The market size is provided in terms of value, measured in billion.
11. Are there any specific market keywords associated with the report?
Yes, the market keyword associated with the report is "Enterprise Intranet Solution," which aids in identifying and referencing the specific market segment covered.
12. How do I determine which pricing option suits my needs best?
The pricing options vary based on user requirements and access needs. Individual users may opt for single-user licenses, while businesses requiring broader access may choose multi-user or enterprise licenses for cost-effective access to the report.
13. Are there any additional resources or data provided in the Enterprise Intranet Solution report?
While the report offers comprehensive insights, it's advisable to review the specific contents or supplementary materials provided to ascertain if additional resources or data are available.
14. How can I stay updated on further developments or reports in the Enterprise Intranet Solution?
To stay informed about further developments, trends, and reports in the Enterprise Intranet Solution, consider subscribing to industry newsletters, following relevant companies and organizations, or regularly checking reputable industry news sources and publications.
Methodology
Step 1 - Identification of Relevant Samples Size from Population Database


Step 2 - Approaches for Defining Global Market Size (Value, Volume* & Price*)

Note*: In applicable scenarios
Step 3 - Data Sources
Primary Research
- Web Analytics
- Survey Reports
- Research Institute
- Latest Research Reports
- Opinion Leaders
Secondary Research
- Annual Reports
- White Paper
- Latest Press Release
- Industry Association
- Paid Database
- Investor Presentations

Step 4 - Data Triangulation
Involves using different sources of information in order to increase the validity of a study
These sources are likely to be stakeholders in a program - participants, other researchers, program staff, other community members, and so on.
Then we put all data in single framework & apply various statistical tools to find out the dynamic on the market.
During the analysis stage, feedback from the stakeholder groups would be compared to determine areas of agreement as well as areas of divergence