

Key Insights
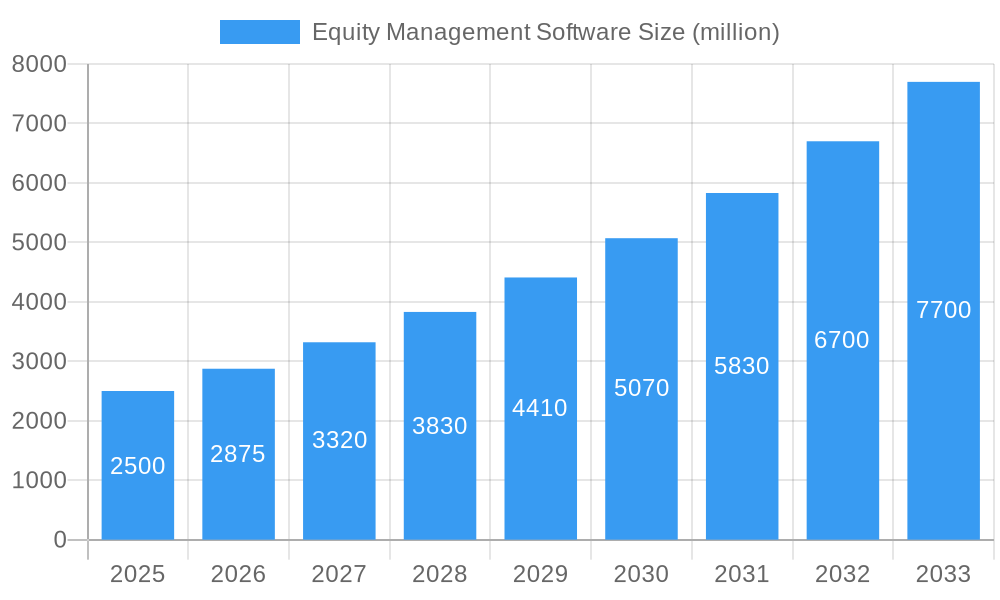
The Equity Management Software market is poised for significant expansion, propelled by escalating regulatory compliance demands, the thriving private equity and venture capital landscapes, and a heightened need for efficient, secure equity administration. Projections indicate a compound annual growth rate (CAGR) of 3.4% from 2025 to 2033. This growth is largely attributed to the widespread adoption of scalable, accessible, and cost-effective cloud-based solutions over traditional on-premise systems. Enhanced data security and real-time stakeholder access further bolster this market shift. Leading providers, including Carta and Computershare, are continuously enhancing offerings with features such as automated reporting, advanced shareholder communication, and integrated cap table management to meet evolving client requirements. North America currently dominates due to its robust venture capital ecosystem and high density of publicly traded companies, though Europe and Asia-Pacific are anticipated to experience substantial growth driven by increasing regional investments. The growing complexity of global equity regulations is also a key driver for sophisticated software solutions.
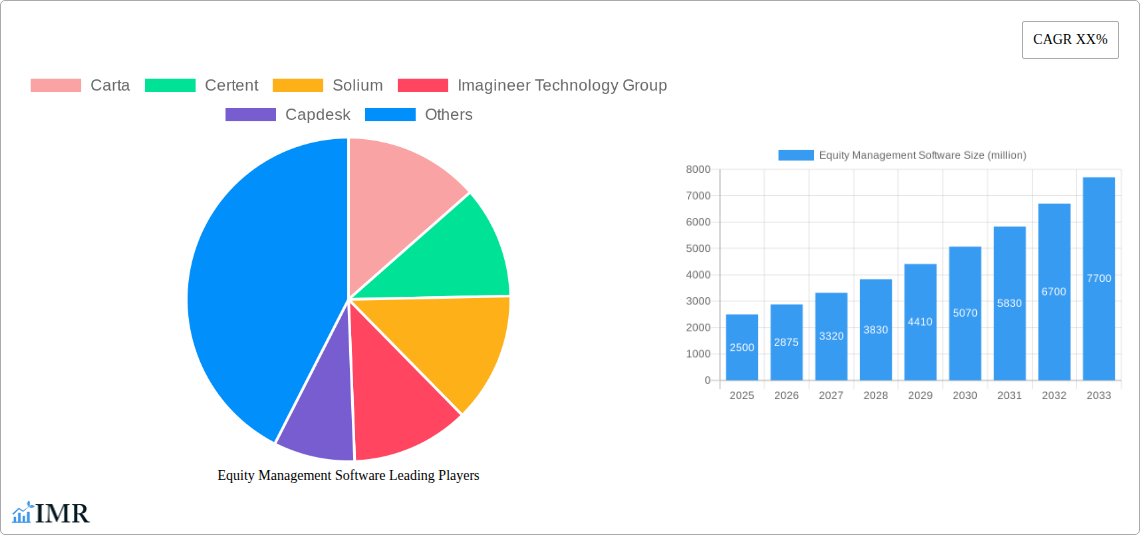
Equity Management Software Market Size (In Million)
The competitive arena features a dynamic blend of established industry leaders and agile new entrants. While established firms capitalize on their extensive experience and client networks, innovative startups are introducing disruptive technologies and flexible solutions, intensifying competition. Despite anticipated robust market growth, potential impediments include high initial implementation costs and the ongoing expense of software updates and maintenance. Nevertheless, the long-term advantages of enhanced operational efficiency, reduced administrative overhead, and strengthened regulatory adherence are expected to sustain the Equity Management Software market's upward trajectory. The global market size is estimated at 823.2 million.
Equity Management Software Company Market Share
Equity Management Software Market Report: 2019-2033
This comprehensive report provides an in-depth analysis of the Equity Management Software market, encompassing historical data (2019-2024), current estimations (2025), and future projections (2025-2033). The study delves into market dynamics, growth trends, regional dominance, product landscapes, challenges, opportunities, and key players, offering invaluable insights for industry professionals, investors, and strategic decision-makers. The parent market is the broader financial technology (FinTech) sector, while the child market focuses specifically on equity management solutions. The report's value is estimated at xx million units.
Equity Management Software Market Dynamics & Structure
The Equity Management Software market is characterized by a moderately concentrated landscape, with key players like Carta, Certent, and Computershare holding significant market share. Technological innovation, driven by advancements in cloud computing, AI, and blockchain, is a major growth driver. Stringent regulatory frameworks, particularly concerning data security and compliance (e.g., GDPR, CCPA), influence market dynamics. Competitive substitutes include manual processes and legacy systems, but the advantages of automated equity management are increasingly favored. The end-user demographics include venture capital firms, private equity funds, startups, and publicly traded companies. M&A activity has been moderate, with xx deals recorded during the historical period (2019-2024), indicating consolidation within the market.
- Market Concentration: Carta and Certent hold an estimated combined market share of 35% in 2025.
- Technological Innovation: Cloud-based solutions are driving adoption, with AI-powered features enhancing efficiency and accuracy.
- Regulatory Landscape: Compliance with data privacy regulations is a major factor shaping software development and deployment.
- M&A Activity: An average of xx M&A deals per year occurred between 2019 and 2024, primarily focused on smaller players.
- Innovation Barriers: High development costs and integration complexities can hinder the entry of new players.
Equity Management Software Growth Trends & Insights
The Equity Management Software market experienced robust growth during the historical period (2019-2024), fueled by increased venture capital investments and a growing number of startups. The market size reached an estimated xx million units in 2025, demonstrating a CAGR of xx% from 2019 to 2024. This growth is attributable to increasing adoption of cloud-based solutions, improving user experience, and the need for enhanced data security. Technological disruptions, such as the rise of blockchain technology for secure equity record-keeping, are influencing market trends. Consumer behavior shifts towards automated and integrated solutions further propel market expansion. Market penetration in 2025 is estimated at xx%, with a projected increase to xx% by 2033. The forecast period (2025-2033) anticipates a CAGR of xx%, driven by factors outlined above and further discussed in subsequent sections.
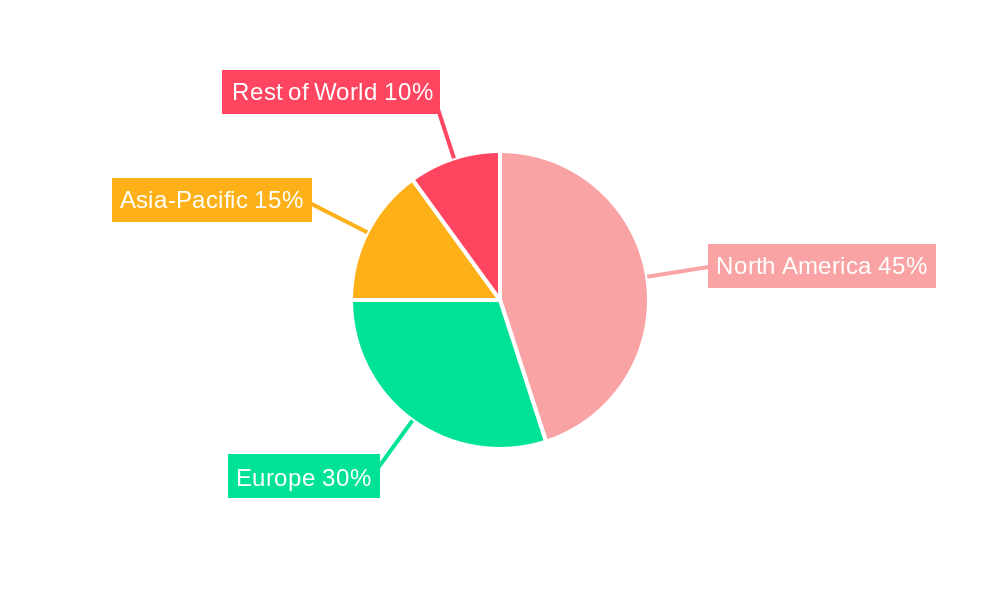
Dominant Regions, Countries, or Segments in Equity Management Software
North America currently dominates the Equity Management Software market, accounting for an estimated xx% market share in 2025. This dominance is largely due to a high concentration of venture capital firms and a robust startup ecosystem. Europe follows as a significant market, with xx% market share in 2025. Asia-Pacific is experiencing rapid growth, with a projected increase in market share of xx% by 2033.
- North America: Strong VC investments, established tech infrastructure, and regulatory clarity drive growth.
- Europe: Growing adoption by established businesses and a rising number of startups contribute to market expansion.
- Asia-Pacific: Rapid economic growth and increasing technological adoption fuels market potential, though regulatory challenges remain.
- Other Regions: These regions represent a significant growth opportunity due to increasing startup activity and foreign investment.
Equity Management Software Product Landscape
The Equity Management Software market features a range of solutions, from basic cap table management tools to sophisticated platforms integrating investor relations, compliance, and reporting functionalities. These solutions leverage cloud technologies for scalability and accessibility, incorporating features such as automated workflows, real-time data updates, and robust security protocols. Unique selling propositions include seamless integrations with accounting systems, customized reporting dashboards, and user-friendly interfaces. Continuous technological advancements lead to enhanced features, such as AI-powered valuations and predictive analytics.
Key Drivers, Barriers & Challenges in Equity Management Software
Key Drivers: The increasing number of startups and venture capital investments, demand for improved data security and compliance, and the need for efficient cap table management are driving market growth. Technological advancements, particularly cloud computing and AI, also contribute significantly.
Key Challenges: High implementation costs, integration complexities with existing systems, and the need for skilled personnel to manage the software are key barriers. Competition from established players and the emergence of new entrants also presents a challenge. Regulatory changes and compliance requirements could create additional hurdles. Supply chain disruptions (xx%) can impact software development and deployment timelines.
Emerging Opportunities in Equity Management Software
Emerging opportunities include expansion into untapped markets (e.g., Latin America, Africa), the development of specialized solutions for specific industry verticals (e.g., biotech, renewable energy), and the integration of blockchain technology for enhanced security and transparency. The increasing demand for sophisticated reporting and analytics features also presents significant opportunities for innovation.
Growth Accelerators in the Equity Management Software Industry
Strategic partnerships between software providers and financial institutions are accelerating market growth. Technological advancements, such as AI and machine learning, are improving the accuracy and efficiency of equity management processes. Expansion into new geographic markets and the development of innovative product features are also driving long-term growth.
Key Players Shaping the Equity Management Software Market
- Carta
- Certent
- Solium (Acquired by Computershare)
- Imagineer Technology Group
- Capdesk
- Computershare
- Koger
- Altvia Solutions
- Preqin Solutions
- Gust
- Global Shares
- TruEquity
- Eqvista
- Euronext
Notable Milestones in Equity Management Software Sector
- 2020: Carta launches advanced features incorporating AI for valuations.
- 2021: Certent integrates blockchain technology for enhanced security.
- 2022: Computershare acquires Solium, consolidating its market position.
- 2023: Several key players release updated software versions incorporating enhanced reporting features.
- 2024: Increased regulatory scrutiny leads to focus on compliance-focused features.
In-Depth Equity Management Software Market Outlook
The Equity Management Software market is poised for continued robust growth throughout the forecast period (2025-2033). Technological innovations, strategic partnerships, and expansion into new geographic markets will drive market expansion. The increasing demand for efficient and secure equity management solutions, coupled with a growing number of startups and venture capital investments, will contribute to a significant increase in market size. Strategic acquisitions and the development of innovative product features will continue to shape the competitive landscape.
Equity Management Software Segmentation
-
1. Application
- 1.1. Start-Ups
- 1.2. Private Corporation
- 1.3. Listed Company
- 1.4. Financial Team
- 1.5. Other
-
2. Types
- 2.1. Basic($Under 50/Month)
- 2.2. Standard($50-100/Month)
- 2.3. Senior(Above $100/Month)
Equity Management Software Segmentation By Geography
-
1. North America
- 1.1. United States
- 1.2. Canada
- 1.3. Mexico
-
2. South America
- 2.1. Brazil
- 2.2. Argentina
- 2.3. Rest of South America
-
3. Europe
- 3.1. United Kingdom
- 3.2. Germany
- 3.3. France
- 3.4. Italy
- 3.5. Spain
- 3.6. Russia
- 3.7. Benelux
- 3.8. Nordics
- 3.9. Rest of Europe
-
4. Middle East & Africa
- 4.1. Turkey
- 4.2. Israel
- 4.3. GCC
- 4.4. North Africa
- 4.5. South Africa
- 4.6. Rest of Middle East & Africa
-
5. Asia Pacific
- 5.1. China
- 5.2. India
- 5.3. Japan
- 5.4. South Korea
- 5.5. ASEAN
- 5.6. Oceania
- 5.7. Rest of Asia Pacific
Equity Management Software Regional Market Share
Geographic Coverage of Equity Management Software
Equity Management Software REPORT HIGHLIGHTS
| Aspects | Details |
|---|---|
| Study Period | 2020-2034 |
| Base Year | 2025 |
| Estimated Year | 2026 |
| Forecast Period | 2026-2034 |
| Historical Period | 2020-2025 |
| Growth Rate | CAGR of 3.4% from 2020-2034 |
| Segmentation |
|
Table of Contents
- 1. Introduction
- 1.1. Research Scope
- 1.2. Market Segmentation
- 1.3. Research Objective
- 1.4. Definitions and Assumptions
- 2. Executive Summary
- 2.1. Market Snapshot
- 3. Market Dynamics
- 3.1. Market Drivers
- 3.2. Market Restrains
- 3.3. Market Trends
- 3.4. Market Opportunities
- 4. Market Factor Analysis
- 4.1. Porters Five Forces
- 4.1.1. Bargaining Power of Suppliers
- 4.1.2. Bargaining Power of Buyers
- 4.1.3. Threat of New Entrants
- 4.1.4. Threat of Substitutes
- 4.1.5. Competitive Rivalry
- 4.2. PESTEL analysis
- 4.3. BCG Analysis
- 4.3.1. Stars (High Growth, High Market Share)
- 4.3.2. Cash Cows (Low Growth, High Market Share)
- 4.3.3. Question Mark (High Growth, Low Market Share)
- 4.3.4. Dogs (Low Growth, Low Market Share)
- 4.4. Ansoff Matrix Analysis
- 4.5. Supply Chain Analysis
- 4.6. Regulatory Landscape
- 4.7. Current Market Potential and Opportunity Assessment (TAM–SAM–SOM Framework)
- 4.8. IMR Analyst Note
- 4.1. Porters Five Forces
- 5. Market Analysis, Insights and Forecast 2021-2033
- 5.1. Market Analysis, Insights and Forecast - by Application
- 5.1.1. Start-Ups
- 5.1.2. Private Corporation
- 5.1.3. Listed Company
- 5.1.4. Financial Team
- 5.1.5. Other
- 5.2. Market Analysis, Insights and Forecast - by Types
- 5.2.1. Basic($Under 50/Month)
- 5.2.2. Standard($50-100/Month)
- 5.2.3. Senior(Above $100/Month)
- 5.3. Market Analysis, Insights and Forecast - by Region
- 5.3.1. North America
- 5.3.2. South America
- 5.3.3. Europe
- 5.3.4. Middle East & Africa
- 5.3.5. Asia Pacific
- 5.1. Market Analysis, Insights and Forecast - by Application
- 6. Global Equity Management Software Analysis, Insights and Forecast, 2021-2033
- 6.1. Market Analysis, Insights and Forecast - by Application
- 6.1.1. Start-Ups
- 6.1.2. Private Corporation
- 6.1.3. Listed Company
- 6.1.4. Financial Team
- 6.1.5. Other
- 6.2. Market Analysis, Insights and Forecast - by Types
- 6.2.1. Basic($Under 50/Month)
- 6.2.2. Standard($50-100/Month)
- 6.2.3. Senior(Above $100/Month)
- 6.1. Market Analysis, Insights and Forecast - by Application
- 7. North America Equity Management Software Analysis, Insights and Forecast, 2020-2032
- 7.1. Market Analysis, Insights and Forecast - by Application
- 7.1.1. Start-Ups
- 7.1.2. Private Corporation
- 7.1.3. Listed Company
- 7.1.4. Financial Team
- 7.1.5. Other
- 7.2. Market Analysis, Insights and Forecast - by Types
- 7.2.1. Basic($Under 50/Month)
- 7.2.2. Standard($50-100/Month)
- 7.2.3. Senior(Above $100/Month)
- 7.1. Market Analysis, Insights and Forecast - by Application
- 8. South America Equity Management Software Analysis, Insights and Forecast, 2020-2032
- 8.1. Market Analysis, Insights and Forecast - by Application
- 8.1.1. Start-Ups
- 8.1.2. Private Corporation
- 8.1.3. Listed Company
- 8.1.4. Financial Team
- 8.1.5. Other
- 8.2. Market Analysis, Insights and Forecast - by Types
- 8.2.1. Basic($Under 50/Month)
- 8.2.2. Standard($50-100/Month)
- 8.2.3. Senior(Above $100/Month)
- 8.1. Market Analysis, Insights and Forecast - by Application
- 9. Europe Equity Management Software Analysis, Insights and Forecast, 2020-2032
- 9.1. Market Analysis, Insights and Forecast - by Application
- 9.1.1. Start-Ups
- 9.1.2. Private Corporation
- 9.1.3. Listed Company
- 9.1.4. Financial Team
- 9.1.5. Other
- 9.2. Market Analysis, Insights and Forecast - by Types
- 9.2.1. Basic($Under 50/Month)
- 9.2.2. Standard($50-100/Month)
- 9.2.3. Senior(Above $100/Month)
- 9.1. Market Analysis, Insights and Forecast - by Application
- 10. Middle East & Africa Equity Management Software Analysis, Insights and Forecast, 2020-2032
- 10.1. Market Analysis, Insights and Forecast - by Application
- 10.1.1. Start-Ups
- 10.1.2. Private Corporation
- 10.1.3. Listed Company
- 10.1.4. Financial Team
- 10.1.5. Other
- 10.2. Market Analysis, Insights and Forecast - by Types
- 10.2.1. Basic($Under 50/Month)
- 10.2.2. Standard($50-100/Month)
- 10.2.3. Senior(Above $100/Month)
- 10.1. Market Analysis, Insights and Forecast - by Application
- 11. Asia Pacific Equity Management Software Analysis, Insights and Forecast, 2020-2032
- 11.1. Market Analysis, Insights and Forecast - by Application
- 11.1.1. Start-Ups
- 11.1.2. Private Corporation
- 11.1.3. Listed Company
- 11.1.4. Financial Team
- 11.1.5. Other
- 11.2. Market Analysis, Insights and Forecast - by Types
- 11.2.1. Basic($Under 50/Month)
- 11.2.2. Standard($50-100/Month)
- 11.2.3. Senior(Above $100/Month)
- 11.1. Market Analysis, Insights and Forecast - by Application
- 12. Competitive Analysis
- 12.1. Company Profiles
- 12.1.1 Carta
- 12.1.1.1. Company Overview
- 12.1.1.2. Products
- 12.1.1.3. Company Financials
- 12.1.1.4. SWOT Analysis
- 12.1.2 Certent
- 12.1.2.1. Company Overview
- 12.1.2.2. Products
- 12.1.2.3. Company Financials
- 12.1.2.4. SWOT Analysis
- 12.1.3 Solium
- 12.1.3.1. Company Overview
- 12.1.3.2. Products
- 12.1.3.3. Company Financials
- 12.1.3.4. SWOT Analysis
- 12.1.4 Imagineer Technology Group
- 12.1.4.1. Company Overview
- 12.1.4.2. Products
- 12.1.4.3. Company Financials
- 12.1.4.4. SWOT Analysis
- 12.1.5 Capdesk
- 12.1.5.1. Company Overview
- 12.1.5.2. Products
- 12.1.5.3. Company Financials
- 12.1.5.4. SWOT Analysis
- 12.1.6 Computershare
- 12.1.6.1. Company Overview
- 12.1.6.2. Products
- 12.1.6.3. Company Financials
- 12.1.6.4. SWOT Analysis
- 12.1.7 Koger
- 12.1.7.1. Company Overview
- 12.1.7.2. Products
- 12.1.7.3. Company Financials
- 12.1.7.4. SWOT Analysis
- 12.1.8 Altvia Solutions
- 12.1.8.1. Company Overview
- 12.1.8.2. Products
- 12.1.8.3. Company Financials
- 12.1.8.4. SWOT Analysis
- 12.1.9 Preqin Solutions
- 12.1.9.1. Company Overview
- 12.1.9.2. Products
- 12.1.9.3. Company Financials
- 12.1.9.4. SWOT Analysis
- 12.1.10 Gust
- 12.1.10.1. Company Overview
- 12.1.10.2. Products
- 12.1.10.3. Company Financials
- 12.1.10.4. SWOT Analysis
- 12.1.11 Global Shares
- 12.1.11.1. Company Overview
- 12.1.11.2. Products
- 12.1.11.3. Company Financials
- 12.1.11.4. SWOT Analysis
- 12.1.12 TruEquity
- 12.1.12.1. Company Overview
- 12.1.12.2. Products
- 12.1.12.3. Company Financials
- 12.1.12.4. SWOT Analysis
- 12.1.13 Eqvista
- 12.1.13.1. Company Overview
- 12.1.13.2. Products
- 12.1.13.3. Company Financials
- 12.1.13.4. SWOT Analysis
- 12.1.14 Euronext
- 12.1.14.1. Company Overview
- 12.1.14.2. Products
- 12.1.14.3. Company Financials
- 12.1.14.4. SWOT Analysis
- 12.1.1 Carta
- 12.2. Market Entropy
- 12.2.1 Company's Key Areas Served
- 12.2.2 Recent Developments
- 12.3. Company Market Share Analysis 2025
- 12.3.1 Top 5 Companies Market Share Analysis
- 12.3.2 Top 3 Companies Market Share Analysis
- 12.4. List of Potential Customers
- 13. Research Methodology
List of Figures
- Figure 1: Global Equity Management Software Revenue Breakdown (million, %) by Region 2025 & 2033
- Figure 2: North America Equity Management Software Revenue (million), by Application 2025 & 2033
- Figure 3: North America Equity Management Software Revenue Share (%), by Application 2025 & 2033
- Figure 4: North America Equity Management Software Revenue (million), by Types 2025 & 2033
- Figure 5: North America Equity Management Software Revenue Share (%), by Types 2025 & 2033
- Figure 6: North America Equity Management Software Revenue (million), by Country 2025 & 2033
- Figure 7: North America Equity Management Software Revenue Share (%), by Country 2025 & 2033
- Figure 8: South America Equity Management Software Revenue (million), by Application 2025 & 2033
- Figure 9: South America Equity Management Software Revenue Share (%), by Application 2025 & 2033
- Figure 10: South America Equity Management Software Revenue (million), by Types 2025 & 2033
- Figure 11: South America Equity Management Software Revenue Share (%), by Types 2025 & 2033
- Figure 12: South America Equity Management Software Revenue (million), by Country 2025 & 2033
- Figure 13: South America Equity Management Software Revenue Share (%), by Country 2025 & 2033
- Figure 14: Europe Equity Management Software Revenue (million), by Application 2025 & 2033
- Figure 15: Europe Equity Management Software Revenue Share (%), by Application 2025 & 2033
- Figure 16: Europe Equity Management Software Revenue (million), by Types 2025 & 2033
- Figure 17: Europe Equity Management Software Revenue Share (%), by Types 2025 & 2033
- Figure 18: Europe Equity Management Software Revenue (million), by Country 2025 & 2033
- Figure 19: Europe Equity Management Software Revenue Share (%), by Country 2025 & 2033
- Figure 20: Middle East & Africa Equity Management Software Revenue (million), by Application 2025 & 2033
- Figure 21: Middle East & Africa Equity Management Software Revenue Share (%), by Application 2025 & 2033
- Figure 22: Middle East & Africa Equity Management Software Revenue (million), by Types 2025 & 2033
- Figure 23: Middle East & Africa Equity Management Software Revenue Share (%), by Types 2025 & 2033
- Figure 24: Middle East & Africa Equity Management Software Revenue (million), by Country 2025 & 2033
- Figure 25: Middle East & Africa Equity Management Software Revenue Share (%), by Country 2025 & 2033
- Figure 26: Asia Pacific Equity Management Software Revenue (million), by Application 2025 & 2033
- Figure 27: Asia Pacific Equity Management Software Revenue Share (%), by Application 2025 & 2033
- Figure 28: Asia Pacific Equity Management Software Revenue (million), by Types 2025 & 2033
- Figure 29: Asia Pacific Equity Management Software Revenue Share (%), by Types 2025 & 2033
- Figure 30: Asia Pacific Equity Management Software Revenue (million), by Country 2025 & 2033
- Figure 31: Asia Pacific Equity Management Software Revenue Share (%), by Country 2025 & 2033
List of Tables
- Table 1: Global Equity Management Software Revenue million Forecast, by Application 2020 & 2033
- Table 2: Global Equity Management Software Revenue million Forecast, by Types 2020 & 2033
- Table 3: Global Equity Management Software Revenue million Forecast, by Region 2020 & 2033
- Table 4: Global Equity Management Software Revenue million Forecast, by Application 2020 & 2033
- Table 5: Global Equity Management Software Revenue million Forecast, by Types 2020 & 2033
- Table 6: Global Equity Management Software Revenue million Forecast, by Country 2020 & 2033
- Table 7: United States Equity Management Software Revenue (million) Forecast, by Application 2020 & 2033
- Table 8: Canada Equity Management Software Revenue (million) Forecast, by Application 2020 & 2033
- Table 9: Mexico Equity Management Software Revenue (million) Forecast, by Application 2020 & 2033
- Table 10: Global Equity Management Software Revenue million Forecast, by Application 2020 & 2033
- Table 11: Global Equity Management Software Revenue million Forecast, by Types 2020 & 2033
- Table 12: Global Equity Management Software Revenue million Forecast, by Country 2020 & 2033
- Table 13: Brazil Equity Management Software Revenue (million) Forecast, by Application 2020 & 2033
- Table 14: Argentina Equity Management Software Revenue (million) Forecast, by Application 2020 & 2033
- Table 15: Rest of South America Equity Management Software Revenue (million) Forecast, by Application 2020 & 2033
- Table 16: Global Equity Management Software Revenue million Forecast, by Application 2020 & 2033
- Table 17: Global Equity Management Software Revenue million Forecast, by Types 2020 & 2033
- Table 18: Global Equity Management Software Revenue million Forecast, by Country 2020 & 2033
- Table 19: United Kingdom Equity Management Software Revenue (million) Forecast, by Application 2020 & 2033
- Table 20: Germany Equity Management Software Revenue (million) Forecast, by Application 2020 & 2033
- Table 21: France Equity Management Software Revenue (million) Forecast, by Application 2020 & 2033
- Table 22: Italy Equity Management Software Revenue (million) Forecast, by Application 2020 & 2033
- Table 23: Spain Equity Management Software Revenue (million) Forecast, by Application 2020 & 2033
- Table 24: Russia Equity Management Software Revenue (million) Forecast, by Application 2020 & 2033
- Table 25: Benelux Equity Management Software Revenue (million) Forecast, by Application 2020 & 2033
- Table 26: Nordics Equity Management Software Revenue (million) Forecast, by Application 2020 & 2033
- Table 27: Rest of Europe Equity Management Software Revenue (million) Forecast, by Application 2020 & 2033
- Table 28: Global Equity Management Software Revenue million Forecast, by Application 2020 & 2033
- Table 29: Global Equity Management Software Revenue million Forecast, by Types 2020 & 2033
- Table 30: Global Equity Management Software Revenue million Forecast, by Country 2020 & 2033
- Table 31: Turkey Equity Management Software Revenue (million) Forecast, by Application 2020 & 2033
- Table 32: Israel Equity Management Software Revenue (million) Forecast, by Application 2020 & 2033
- Table 33: GCC Equity Management Software Revenue (million) Forecast, by Application 2020 & 2033
- Table 34: North Africa Equity Management Software Revenue (million) Forecast, by Application 2020 & 2033
- Table 35: South Africa Equity Management Software Revenue (million) Forecast, by Application 2020 & 2033
- Table 36: Rest of Middle East & Africa Equity Management Software Revenue (million) Forecast, by Application 2020 & 2033
- Table 37: Global Equity Management Software Revenue million Forecast, by Application 2020 & 2033
- Table 38: Global Equity Management Software Revenue million Forecast, by Types 2020 & 2033
- Table 39: Global Equity Management Software Revenue million Forecast, by Country 2020 & 2033
- Table 40: China Equity Management Software Revenue (million) Forecast, by Application 2020 & 2033
- Table 41: India Equity Management Software Revenue (million) Forecast, by Application 2020 & 2033
- Table 42: Japan Equity Management Software Revenue (million) Forecast, by Application 2020 & 2033
- Table 43: South Korea Equity Management Software Revenue (million) Forecast, by Application 2020 & 2033
- Table 44: ASEAN Equity Management Software Revenue (million) Forecast, by Application 2020 & 2033
- Table 45: Oceania Equity Management Software Revenue (million) Forecast, by Application 2020 & 2033
- Table 46: Rest of Asia Pacific Equity Management Software Revenue (million) Forecast, by Application 2020 & 2033
Frequently Asked Questions
1. What is the projected Compound Annual Growth Rate (CAGR) of the Equity Management Software?
The projected CAGR is approximately 3.4%.
2. Which companies are prominent players in the Equity Management Software?
Key companies in the market include Carta, Certent, Solium, Imagineer Technology Group, Capdesk, Computershare, Koger, Altvia Solutions, Preqin Solutions, Gust, Global Shares, TruEquity, Eqvista, Euronext.
3. What are the main segments of the Equity Management Software?
The market segments include Application, Types.
4. Can you provide details about the market size?
The market size is estimated to be USD 823.2 million as of 2022.
5. What are some drivers contributing to market growth?
N/A
6. What are the notable trends driving market growth?
N/A
7. Are there any restraints impacting market growth?
N/A
8. Can you provide examples of recent developments in the market?
N/A
9. What pricing options are available for accessing the report?
Pricing options include single-user, multi-user, and enterprise licenses priced at USD 4900.00, USD 7350.00, and USD 9800.00 respectively.
10. Is the market size provided in terms of value or volume?
The market size is provided in terms of value, measured in million.
11. Are there any specific market keywords associated with the report?
Yes, the market keyword associated with the report is "Equity Management Software," which aids in identifying and referencing the specific market segment covered.
12. How do I determine which pricing option suits my needs best?
The pricing options vary based on user requirements and access needs. Individual users may opt for single-user licenses, while businesses requiring broader access may choose multi-user or enterprise licenses for cost-effective access to the report.
13. Are there any additional resources or data provided in the Equity Management Software report?
While the report offers comprehensive insights, it's advisable to review the specific contents or supplementary materials provided to ascertain if additional resources or data are available.
14. How can I stay updated on further developments or reports in the Equity Management Software?
To stay informed about further developments, trends, and reports in the Equity Management Software, consider subscribing to industry newsletters, following relevant companies and organizations, or regularly checking reputable industry news sources and publications.
Methodology
Step 1 - Identification of Relevant Samples Size from Population Database


Step 2 - Approaches for Defining Global Market Size (Value, Volume* & Price*)

Note*: In applicable scenarios
Step 3 - Data Sources
Primary Research
- Web Analytics
- Survey Reports
- Research Institute
- Latest Research Reports
- Opinion Leaders
Secondary Research
- Annual Reports
- White Paper
- Latest Press Release
- Industry Association
- Paid Database
- Investor Presentations

Step 4 - Data Triangulation
Involves using different sources of information in order to increase the validity of a study
These sources are likely to be stakeholders in a program - participants, other researchers, program staff, other community members, and so on.
Then we put all data in single framework & apply various statistical tools to find out the dynamic on the market.
During the analysis stage, feedback from the stakeholder groups would be compared to determine areas of agreement as well as areas of divergence