

Key Insights
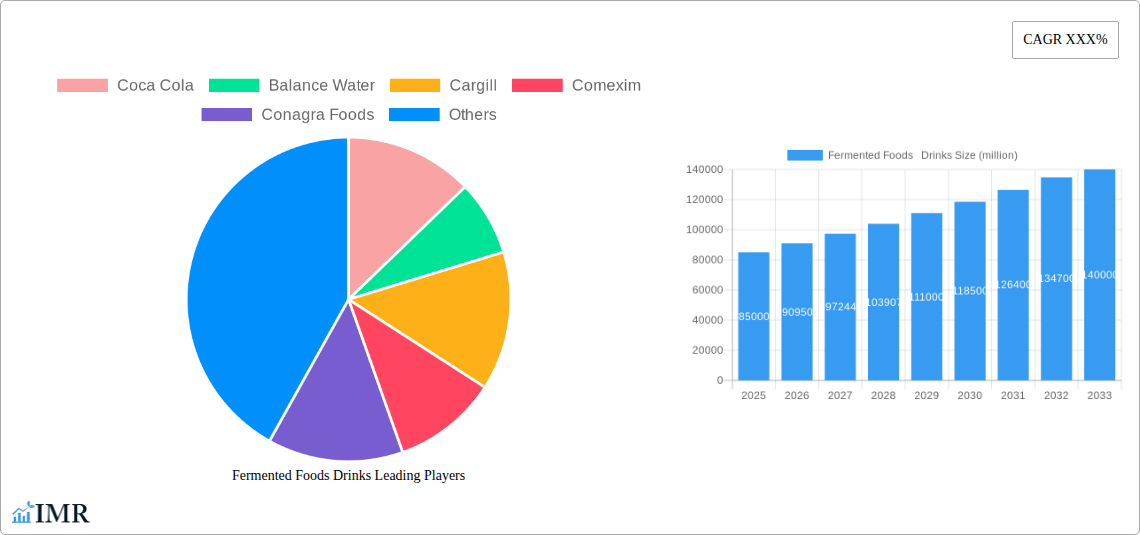
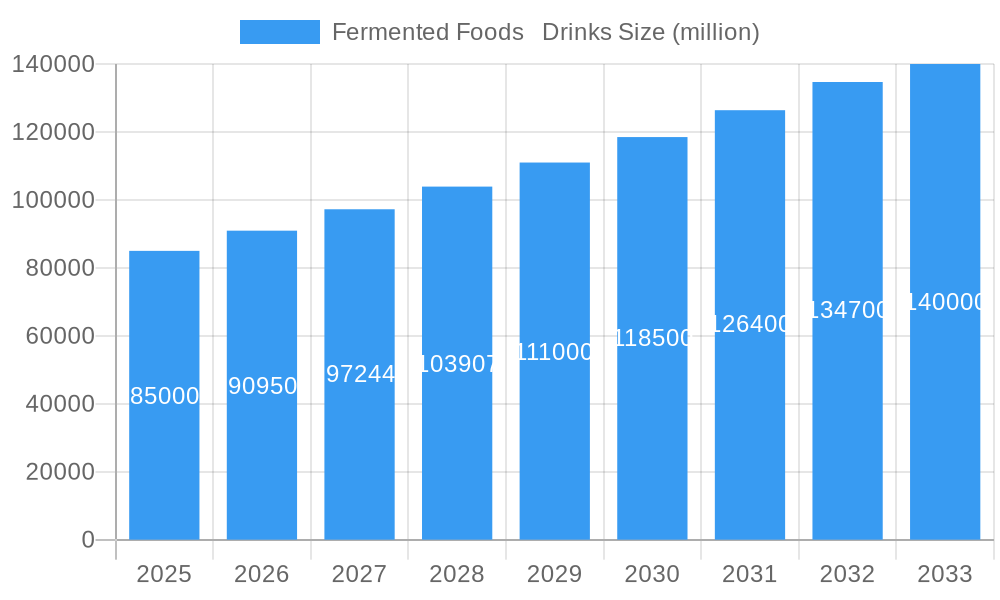
The global fermented food and beverage market is experiencing robust growth, driven by increasing consumer awareness of the health benefits associated with probiotics and fermented products. The market, estimated at $85 billion in 2025, is projected to witness a Compound Annual Growth Rate (CAGR) of 7% between 2025 and 2033, reaching an estimated $140 billion by 2033. This expansion is fueled by several key trends, including the rising popularity of functional beverages, growing demand for gut-health promoting products, and a surge in interest in natural and organic foods. Major players like Coca-Cola, PepsiCo, and Nestle are strategically investing in this sector, either through direct product development or acquisitions of smaller, specialized companies. This indicates a significant level of confidence in the long-term potential of this market segment. However, challenges remain. Maintaining consistent quality and shelf-life across diverse product lines, along with managing consumer perceptions and addressing potential supply chain complexities, are crucial factors that companies must navigate to fully capitalize on this market opportunity.
Fermented Foods Drinks Market Size (In Billion)
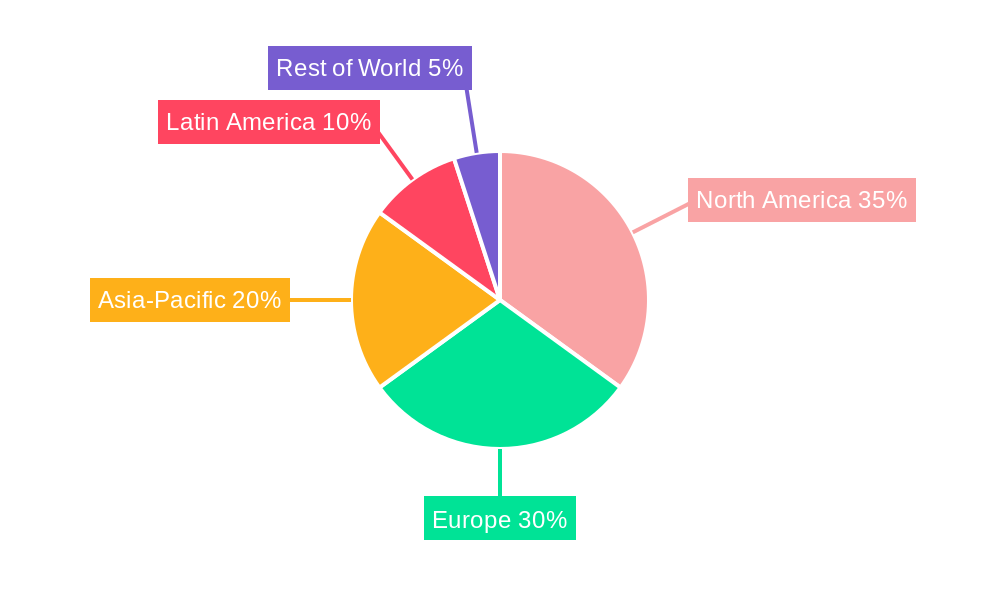
The market segmentation demonstrates a strong preference for convenient, ready-to-drink formats. However, emerging trends suggest increasing demand for a wider variety of fermented products, such as kefir, kombucha, and kimchi-infused beverages. Regional variations are also evident, with North America and Europe currently holding the largest market shares. However, growth is anticipated to be particularly strong in Asia-Pacific and Latin America, driven by increasing disposable incomes and changing consumer preferences in these regions. Companies are therefore focusing on expanding their product portfolios, targeting specific regional tastes and preferences, and developing innovative marketing strategies to capture these emerging market opportunities.
Fermented Foods Drinks Company Market Share
Fermented Foods & Drinks Market Report: 2019-2033
This comprehensive report provides an in-depth analysis of the Fermented Foods & Drinks market, encompassing its dynamics, growth trends, leading players, and future outlook. The study period covers 2019-2033, with 2025 as the base and estimated year. The forecast period is 2025-2033, and the historical period is 2019-2024. This report is essential for industry professionals, investors, and anyone seeking to understand this rapidly evolving market segment. Market values are presented in million units.
Fermented Foods Drinks Market Dynamics & Structure
The Fermented Foods & Drinks market exhibits a moderately concentrated structure, with key players like Coca-Cola, PepsiCo, and Danone holding significant market share. However, the market also features numerous smaller players and emerging brands, indicating a dynamic competitive landscape. Technological innovations, particularly in fermentation processes and packaging, are crucial drivers. Stringent regulatory frameworks concerning food safety and labeling impact market dynamics. Consumers increasingly seek healthier alternatives, leading to the growth of fermented drinks as a functional beverage category. The market also faces competition from traditional soft drinks and other beverage categories. M&A activity within the sector has been moderate in recent years, with approximately xx deals recorded between 2019 and 2024. This activity is driven by expansion into new markets and diversification of product portfolios.
- Market Concentration: Moderately concentrated, with top 5 players holding xx% market share in 2024.
- Technological Innovation: Focus on improved fermentation techniques, natural preservatives, and sustainable packaging.
- Regulatory Landscape: Stringent regulations on food safety, labeling, and health claims.
- Competitive Substitutes: Traditional soft drinks, juices, and other functional beverages.
- End-User Demographics: Growing interest among health-conscious consumers, millennials, and Gen Z.
- M&A Activity: xx deals between 2019 and 2024, driven by market expansion and diversification.
Fermented Foods Drinks Growth Trends & Insights
The Fermented Foods & Drinks market has experienced robust growth, with a CAGR of xx% during the historical period (2019-2024). This growth is fueled by increasing consumer awareness of the health benefits of fermented foods and drinks, a rising demand for functional beverages, and the introduction of innovative product formats and flavors. Market penetration increased from xx% in 2019 to xx% in 2024. Technological advancements in fermentation technology are further enhancing the quality and efficiency of production, driving market expansion. Shifting consumer preferences toward natural, healthier alternatives are also key factors. The estimated market size in 2025 is xx million units, projected to reach xx million units by 2033.
Dominant Regions, Countries, or Segments in Fermented Foods Drinks
North America currently holds the largest market share in the fermented foods and drinks sector, driven by high consumer spending on health and wellness products and the presence of major players. Europe follows closely, with strong growth potential in emerging markets. Key drivers in these regions include favorable economic conditions, established distribution networks, and consumer demand for diverse and innovative products. Within segments, probiotic drinks show the highest growth rate, reflecting consumer interest in gut health.
- North America: High consumer spending, established distribution networks, strong presence of major players.
- Europe: Strong growth potential, increasing consumer awareness of health benefits.
- Asia-Pacific: Rapid growth, driven by rising disposable incomes and changing consumer preferences.
- Probiotic Drinks: Fastest-growing segment due to growing consumer interest in gut health.
Fermented Foods Drinks Product Landscape
The Fermented Foods & Drinks market offers a diverse range of products, including kombucha, kefir, kimchi, sauerkraut, and various probiotic beverages. Product innovations are focused on enhancing taste profiles, extending shelf life, and adding functional ingredients. The introduction of convenient packaging formats, such as single-serve bottles and pouches, is also driving market growth. Unique selling propositions often highlight the health benefits, natural ingredients, and unique flavors of these products. Technological advancements in fermentation processes have allowed for the production of higher-quality, more consistent products.
Key Drivers, Barriers & Challenges in Fermented Foods Drinks
Key Drivers:
- Increasing consumer awareness of the health benefits of fermented foods and drinks.
- Growing demand for functional beverages.
- Product innovation and diversification.
- Expanding distribution networks.
Challenges:
- Maintaining product quality and consistency.
- Managing supply chain complexities and ensuring timely delivery.
- Regulatory hurdles and compliance requirements.
- Intense competition from established beverage companies. This competition reduces market share growth by an estimated xx% annually.
Emerging Opportunities in Fermented Foods Drinks
- Expansion into untapped markets in developing economies.
- Development of novel fermented products with enhanced functional properties.
- Customization of products to meet specific dietary needs and preferences.
- Strategic partnerships with food retailers and distributors to enhance market reach.
Growth Accelerators in the Fermented Foods Drinks Industry
Technological breakthroughs in fermentation technology are leading to more efficient and sustainable production processes. Strategic partnerships among food companies and research institutions are driving the development of novel fermented products. Market expansion strategies focusing on emerging markets and new product categories contribute significantly to growth.
Key Players Shaping the Fermented Foods Drinks Market
- Coca-Cola
- Balance Water
- Cargill
- Comexim
- Conagra Foods
- Dr Pepper
- DSM
- Eklo Water
- Danone
- Grupo Petrópolis
- Vichy Catalan
- Hint Water
- Nestle
- Suntory Beverage & Food
- PepsiCo
Notable Milestones in Fermented Foods Drinks Sector
- 2020: Increased investment in research and development by major players focusing on improved fermentation processes.
- 2021: Launch of several new product lines featuring innovative flavors and functional ingredients.
- 2022: Acquisition of a smaller fermented foods company by a major player, expanding market presence.
- 2023: Introduction of sustainable packaging solutions by several key players.
- 2024: Several new product launches highlighting plant-based ingredients.
In-Depth Fermented Foods Drinks Market Outlook
The Fermented Foods & Drinks market is poised for continued growth, driven by technological advancements, evolving consumer preferences, and strategic market expansion. The rising demand for healthy and functional beverages presents significant opportunities for innovation and market diversification. Strategic partnerships and acquisitions will continue to shape the competitive landscape. The future potential is significant, with projected substantial growth in both established and emerging markets.
Fermented Foods Drinks Segmentation
-
1. Application
- 1.1. Retail
- 1.2. Super Market/Hyper Markets
- 1.3. Convenience Stores
-
2. Type
- 2.1. Fermented Vegetables
- 2.2. Fermented Dairy Products
- 2.3. Fermented Drinks
Fermented Foods Drinks Segmentation By Geography
-
1. North America
- 1.1. United States
- 1.2. Canada
- 1.3. Mexico
-
2. South America
- 2.1. Brazil
- 2.2. Argentina
- 2.3. Rest of South America
-
3. Europe
- 3.1. United Kingdom
- 3.2. Germany
- 3.3. France
- 3.4. Italy
- 3.5. Spain
- 3.6. Russia
- 3.7. Benelux
- 3.8. Nordics
- 3.9. Rest of Europe
-
4. Middle East & Africa
- 4.1. Turkey
- 4.2. Israel
- 4.3. GCC
- 4.4. North Africa
- 4.5. South Africa
- 4.6. Rest of Middle East & Africa
-
5. Asia Pacific
- 5.1. China
- 5.2. India
- 5.3. Japan
- 5.4. South Korea
- 5.5. ASEAN
- 5.6. Oceania
- 5.7. Rest of Asia Pacific
Fermented Foods Drinks Regional Market Share
Geographic Coverage of Fermented Foods Drinks
Fermented Foods Drinks REPORT HIGHLIGHTS
| Aspects | Details |
|---|---|
| Study Period | 2020-2034 |
| Base Year | 2025 |
| Estimated Year | 2026 |
| Forecast Period | 2026-2034 |
| Historical Period | 2020-2025 |
| Growth Rate | CAGR of XXX% from 2020-2034 |
| Segmentation |
|
Table of Contents
- 1. Introduction
- 1.1. Research Scope
- 1.2. Market Segmentation
- 1.3. Research Objective
- 1.4. Definitions and Assumptions
- 2. Executive Summary
- 2.1. Market Snapshot
- 3. Market Dynamics
- 3.1. Market Drivers
- 3.2. Market Restrains
- 3.3. Market Trends
- 3.4. Market Opportunities
- 4. Market Factor Analysis
- 4.1. Porters Five Forces
- 4.1.1. Bargaining Power of Suppliers
- 4.1.2. Bargaining Power of Buyers
- 4.1.3. Threat of New Entrants
- 4.1.4. Threat of Substitutes
- 4.1.5. Competitive Rivalry
- 4.2. PESTEL analysis
- 4.3. BCG Analysis
- 4.3.1. Stars (High Growth, High Market Share)
- 4.3.2. Cash Cows (Low Growth, High Market Share)
- 4.3.3. Question Mark (High Growth, Low Market Share)
- 4.3.4. Dogs (Low Growth, Low Market Share)
- 4.4. Ansoff Matrix Analysis
- 4.5. Supply Chain Analysis
- 4.6. Regulatory Landscape
- 4.7. Current Market Potential and Opportunity Assessment (TAM–SAM–SOM Framework)
- 4.8. IMR Analyst Note
- 4.1. Porters Five Forces
- 5. Market Analysis, Insights and Forecast 2021-2033
- 5.1. Market Analysis, Insights and Forecast - by Application
- 5.1.1. Retail
- 5.1.2. Super Market/Hyper Markets
- 5.1.3. Convenience Stores
- 5.2. Market Analysis, Insights and Forecast - by Type
- 5.2.1. Fermented Vegetables
- 5.2.2. Fermented Dairy Products
- 5.2.3. Fermented Drinks
- 5.3. Market Analysis, Insights and Forecast - by Region
- 5.3.1. North America
- 5.3.2. South America
- 5.3.3. Europe
- 5.3.4. Middle East & Africa
- 5.3.5. Asia Pacific
- 5.1. Market Analysis, Insights and Forecast - by Application
- 6. Global Fermented Foods Drinks Analysis, Insights and Forecast, 2021-2033
- 6.1. Market Analysis, Insights and Forecast - by Application
- 6.1.1. Retail
- 6.1.2. Super Market/Hyper Markets
- 6.1.3. Convenience Stores
- 6.2. Market Analysis, Insights and Forecast - by Type
- 6.2.1. Fermented Vegetables
- 6.2.2. Fermented Dairy Products
- 6.2.3. Fermented Drinks
- 6.1. Market Analysis, Insights and Forecast - by Application
- 7. North America Fermented Foods Drinks Analysis, Insights and Forecast, 2020-2032
- 7.1. Market Analysis, Insights and Forecast - by Application
- 7.1.1. Retail
- 7.1.2. Super Market/Hyper Markets
- 7.1.3. Convenience Stores
- 7.2. Market Analysis, Insights and Forecast - by Type
- 7.2.1. Fermented Vegetables
- 7.2.2. Fermented Dairy Products
- 7.2.3. Fermented Drinks
- 7.1. Market Analysis, Insights and Forecast - by Application
- 8. South America Fermented Foods Drinks Analysis, Insights and Forecast, 2020-2032
- 8.1. Market Analysis, Insights and Forecast - by Application
- 8.1.1. Retail
- 8.1.2. Super Market/Hyper Markets
- 8.1.3. Convenience Stores
- 8.2. Market Analysis, Insights and Forecast - by Type
- 8.2.1. Fermented Vegetables
- 8.2.2. Fermented Dairy Products
- 8.2.3. Fermented Drinks
- 8.1. Market Analysis, Insights and Forecast - by Application
- 9. Europe Fermented Foods Drinks Analysis, Insights and Forecast, 2020-2032
- 9.1. Market Analysis, Insights and Forecast - by Application
- 9.1.1. Retail
- 9.1.2. Super Market/Hyper Markets
- 9.1.3. Convenience Stores
- 9.2. Market Analysis, Insights and Forecast - by Type
- 9.2.1. Fermented Vegetables
- 9.2.2. Fermented Dairy Products
- 9.2.3. Fermented Drinks
- 9.1. Market Analysis, Insights and Forecast - by Application
- 10. Middle East & Africa Fermented Foods Drinks Analysis, Insights and Forecast, 2020-2032
- 10.1. Market Analysis, Insights and Forecast - by Application
- 10.1.1. Retail
- 10.1.2. Super Market/Hyper Markets
- 10.1.3. Convenience Stores
- 10.2. Market Analysis, Insights and Forecast - by Type
- 10.2.1. Fermented Vegetables
- 10.2.2. Fermented Dairy Products
- 10.2.3. Fermented Drinks
- 10.1. Market Analysis, Insights and Forecast - by Application
- 11. Asia Pacific Fermented Foods Drinks Analysis, Insights and Forecast, 2020-2032
- 11.1. Market Analysis, Insights and Forecast - by Application
- 11.1.1. Retail
- 11.1.2. Super Market/Hyper Markets
- 11.1.3. Convenience Stores
- 11.2. Market Analysis, Insights and Forecast - by Type
- 11.2.1. Fermented Vegetables
- 11.2.2. Fermented Dairy Products
- 11.2.3. Fermented Drinks
- 11.1. Market Analysis, Insights and Forecast - by Application
- 12. Competitive Analysis
- 12.1. Company Profiles
- 12.1.1 Coca Cola
- 12.1.1.1. Company Overview
- 12.1.1.2. Products
- 12.1.1.3. Company Financials
- 12.1.1.4. SWOT Analysis
- 12.1.2 Balance Water
- 12.1.2.1. Company Overview
- 12.1.2.2. Products
- 12.1.2.3. Company Financials
- 12.1.2.4. SWOT Analysis
- 12.1.3 Cargill
- 12.1.3.1. Company Overview
- 12.1.3.2. Products
- 12.1.3.3. Company Financials
- 12.1.3.4. SWOT Analysis
- 12.1.4 Comexim
- 12.1.4.1. Company Overview
- 12.1.4.2. Products
- 12.1.4.3. Company Financials
- 12.1.4.4. SWOT Analysis
- 12.1.5 Conagra Foods
- 12.1.5.1. Company Overview
- 12.1.5.2. Products
- 12.1.5.3. Company Financials
- 12.1.5.4. SWOT Analysis
- 12.1.6 Dr Pepper
- 12.1.6.1. Company Overview
- 12.1.6.2. Products
- 12.1.6.3. Company Financials
- 12.1.6.4. SWOT Analysis
- 12.1.7 DSM
- 12.1.7.1. Company Overview
- 12.1.7.2. Products
- 12.1.7.3. Company Financials
- 12.1.7.4. SWOT Analysis
- 12.1.8 Eklo Water
- 12.1.8.1. Company Overview
- 12.1.8.2. Products
- 12.1.8.3. Company Financials
- 12.1.8.4. SWOT Analysis
- 12.1.9 Danone
- 12.1.9.1. Company Overview
- 12.1.9.2. Products
- 12.1.9.3. Company Financials
- 12.1.9.4. SWOT Analysis
- 12.1.10 Grupo Petrópolis
- 12.1.10.1. Company Overview
- 12.1.10.2. Products
- 12.1.10.3. Company Financials
- 12.1.10.4. SWOT Analysis
- 12.1.11 Vichy Catalan
- 12.1.11.1. Company Overview
- 12.1.11.2. Products
- 12.1.11.3. Company Financials
- 12.1.11.4. SWOT Analysis
- 12.1.12 Hint Water
- 12.1.12.1. Company Overview
- 12.1.12.2. Products
- 12.1.12.3. Company Financials
- 12.1.12.4. SWOT Analysis
- 12.1.13 Nestle
- 12.1.13.1. Company Overview
- 12.1.13.2. Products
- 12.1.13.3. Company Financials
- 12.1.13.4. SWOT Analysis
- 12.1.14 Suntory Beverage & Food
- 12.1.14.1. Company Overview
- 12.1.14.2. Products
- 12.1.14.3. Company Financials
- 12.1.14.4. SWOT Analysis
- 12.1.15 PepsiCo
- 12.1.15.1. Company Overview
- 12.1.15.2. Products
- 12.1.15.3. Company Financials
- 12.1.15.4. SWOT Analysis
- 12.1.1 Coca Cola
- 12.2. Market Entropy
- 12.2.1 Company's Key Areas Served
- 12.2.2 Recent Developments
- 12.3. Company Market Share Analysis 2025
- 12.3.1 Top 5 Companies Market Share Analysis
- 12.3.2 Top 3 Companies Market Share Analysis
- 12.4. List of Potential Customers
- 13. Research Methodology
List of Figures
- Figure 1: Global Fermented Foods Drinks Revenue Breakdown (million, %) by Region 2025 & 2033
- Figure 2: Global Fermented Foods Drinks Volume Breakdown (K, %) by Region 2025 & 2033
- Figure 3: North America Fermented Foods Drinks Revenue (million), by Application 2025 & 2033
- Figure 4: North America Fermented Foods Drinks Volume (K), by Application 2025 & 2033
- Figure 5: North America Fermented Foods Drinks Revenue Share (%), by Application 2025 & 2033
- Figure 6: North America Fermented Foods Drinks Volume Share (%), by Application 2025 & 2033
- Figure 7: North America Fermented Foods Drinks Revenue (million), by Type 2025 & 2033
- Figure 8: North America Fermented Foods Drinks Volume (K), by Type 2025 & 2033
- Figure 9: North America Fermented Foods Drinks Revenue Share (%), by Type 2025 & 2033
- Figure 10: North America Fermented Foods Drinks Volume Share (%), by Type 2025 & 2033
- Figure 11: North America Fermented Foods Drinks Revenue (million), by Country 2025 & 2033
- Figure 12: North America Fermented Foods Drinks Volume (K), by Country 2025 & 2033
- Figure 13: North America Fermented Foods Drinks Revenue Share (%), by Country 2025 & 2033
- Figure 14: North America Fermented Foods Drinks Volume Share (%), by Country 2025 & 2033
- Figure 15: South America Fermented Foods Drinks Revenue (million), by Application 2025 & 2033
- Figure 16: South America Fermented Foods Drinks Volume (K), by Application 2025 & 2033
- Figure 17: South America Fermented Foods Drinks Revenue Share (%), by Application 2025 & 2033
- Figure 18: South America Fermented Foods Drinks Volume Share (%), by Application 2025 & 2033
- Figure 19: South America Fermented Foods Drinks Revenue (million), by Type 2025 & 2033
- Figure 20: South America Fermented Foods Drinks Volume (K), by Type 2025 & 2033
- Figure 21: South America Fermented Foods Drinks Revenue Share (%), by Type 2025 & 2033
- Figure 22: South America Fermented Foods Drinks Volume Share (%), by Type 2025 & 2033
- Figure 23: South America Fermented Foods Drinks Revenue (million), by Country 2025 & 2033
- Figure 24: South America Fermented Foods Drinks Volume (K), by Country 2025 & 2033
- Figure 25: South America Fermented Foods Drinks Revenue Share (%), by Country 2025 & 2033
- Figure 26: South America Fermented Foods Drinks Volume Share (%), by Country 2025 & 2033
- Figure 27: Europe Fermented Foods Drinks Revenue (million), by Application 2025 & 2033
- Figure 28: Europe Fermented Foods Drinks Volume (K), by Application 2025 & 2033
- Figure 29: Europe Fermented Foods Drinks Revenue Share (%), by Application 2025 & 2033
- Figure 30: Europe Fermented Foods Drinks Volume Share (%), by Application 2025 & 2033
- Figure 31: Europe Fermented Foods Drinks Revenue (million), by Type 2025 & 2033
- Figure 32: Europe Fermented Foods Drinks Volume (K), by Type 2025 & 2033
- Figure 33: Europe Fermented Foods Drinks Revenue Share (%), by Type 2025 & 2033
- Figure 34: Europe Fermented Foods Drinks Volume Share (%), by Type 2025 & 2033
- Figure 35: Europe Fermented Foods Drinks Revenue (million), by Country 2025 & 2033
- Figure 36: Europe Fermented Foods Drinks Volume (K), by Country 2025 & 2033
- Figure 37: Europe Fermented Foods Drinks Revenue Share (%), by Country 2025 & 2033
- Figure 38: Europe Fermented Foods Drinks Volume Share (%), by Country 2025 & 2033
- Figure 39: Middle East & Africa Fermented Foods Drinks Revenue (million), by Application 2025 & 2033
- Figure 40: Middle East & Africa Fermented Foods Drinks Volume (K), by Application 2025 & 2033
- Figure 41: Middle East & Africa Fermented Foods Drinks Revenue Share (%), by Application 2025 & 2033
- Figure 42: Middle East & Africa Fermented Foods Drinks Volume Share (%), by Application 2025 & 2033
- Figure 43: Middle East & Africa Fermented Foods Drinks Revenue (million), by Type 2025 & 2033
- Figure 44: Middle East & Africa Fermented Foods Drinks Volume (K), by Type 2025 & 2033
- Figure 45: Middle East & Africa Fermented Foods Drinks Revenue Share (%), by Type 2025 & 2033
- Figure 46: Middle East & Africa Fermented Foods Drinks Volume Share (%), by Type 2025 & 2033
- Figure 47: Middle East & Africa Fermented Foods Drinks Revenue (million), by Country 2025 & 2033
- Figure 48: Middle East & Africa Fermented Foods Drinks Volume (K), by Country 2025 & 2033
- Figure 49: Middle East & Africa Fermented Foods Drinks Revenue Share (%), by Country 2025 & 2033
- Figure 50: Middle East & Africa Fermented Foods Drinks Volume Share (%), by Country 2025 & 2033
- Figure 51: Asia Pacific Fermented Foods Drinks Revenue (million), by Application 2025 & 2033
- Figure 52: Asia Pacific Fermented Foods Drinks Volume (K), by Application 2025 & 2033
- Figure 53: Asia Pacific Fermented Foods Drinks Revenue Share (%), by Application 2025 & 2033
- Figure 54: Asia Pacific Fermented Foods Drinks Volume Share (%), by Application 2025 & 2033
- Figure 55: Asia Pacific Fermented Foods Drinks Revenue (million), by Type 2025 & 2033
- Figure 56: Asia Pacific Fermented Foods Drinks Volume (K), by Type 2025 & 2033
- Figure 57: Asia Pacific Fermented Foods Drinks Revenue Share (%), by Type 2025 & 2033
- Figure 58: Asia Pacific Fermented Foods Drinks Volume Share (%), by Type 2025 & 2033
- Figure 59: Asia Pacific Fermented Foods Drinks Revenue (million), by Country 2025 & 2033
- Figure 60: Asia Pacific Fermented Foods Drinks Volume (K), by Country 2025 & 2033
- Figure 61: Asia Pacific Fermented Foods Drinks Revenue Share (%), by Country 2025 & 2033
- Figure 62: Asia Pacific Fermented Foods Drinks Volume Share (%), by Country 2025 & 2033
List of Tables
- Table 1: Global Fermented Foods Drinks Revenue million Forecast, by Application 2020 & 2033
- Table 2: Global Fermented Foods Drinks Volume K Forecast, by Application 2020 & 2033
- Table 3: Global Fermented Foods Drinks Revenue million Forecast, by Type 2020 & 2033
- Table 4: Global Fermented Foods Drinks Volume K Forecast, by Type 2020 & 2033
- Table 5: Global Fermented Foods Drinks Revenue million Forecast, by Region 2020 & 2033
- Table 6: Global Fermented Foods Drinks Volume K Forecast, by Region 2020 & 2033
- Table 7: Global Fermented Foods Drinks Revenue million Forecast, by Application 2020 & 2033
- Table 8: Global Fermented Foods Drinks Volume K Forecast, by Application 2020 & 2033
- Table 9: Global Fermented Foods Drinks Revenue million Forecast, by Type 2020 & 2033
- Table 10: Global Fermented Foods Drinks Volume K Forecast, by Type 2020 & 2033
- Table 11: Global Fermented Foods Drinks Revenue million Forecast, by Country 2020 & 2033
- Table 12: Global Fermented Foods Drinks Volume K Forecast, by Country 2020 & 2033
- Table 13: United States Fermented Foods Drinks Revenue (million) Forecast, by Application 2020 & 2033
- Table 14: United States Fermented Foods Drinks Volume (K) Forecast, by Application 2020 & 2033
- Table 15: Canada Fermented Foods Drinks Revenue (million) Forecast, by Application 2020 & 2033
- Table 16: Canada Fermented Foods Drinks Volume (K) Forecast, by Application 2020 & 2033
- Table 17: Mexico Fermented Foods Drinks Revenue (million) Forecast, by Application 2020 & 2033
- Table 18: Mexico Fermented Foods Drinks Volume (K) Forecast, by Application 2020 & 2033
- Table 19: Global Fermented Foods Drinks Revenue million Forecast, by Application 2020 & 2033
- Table 20: Global Fermented Foods Drinks Volume K Forecast, by Application 2020 & 2033
- Table 21: Global Fermented Foods Drinks Revenue million Forecast, by Type 2020 & 2033
- Table 22: Global Fermented Foods Drinks Volume K Forecast, by Type 2020 & 2033
- Table 23: Global Fermented Foods Drinks Revenue million Forecast, by Country 2020 & 2033
- Table 24: Global Fermented Foods Drinks Volume K Forecast, by Country 2020 & 2033
- Table 25: Brazil Fermented Foods Drinks Revenue (million) Forecast, by Application 2020 & 2033
- Table 26: Brazil Fermented Foods Drinks Volume (K) Forecast, by Application 2020 & 2033
- Table 27: Argentina Fermented Foods Drinks Revenue (million) Forecast, by Application 2020 & 2033
- Table 28: Argentina Fermented Foods Drinks Volume (K) Forecast, by Application 2020 & 2033
- Table 29: Rest of South America Fermented Foods Drinks Revenue (million) Forecast, by Application 2020 & 2033
- Table 30: Rest of South America Fermented Foods Drinks Volume (K) Forecast, by Application 2020 & 2033
- Table 31: Global Fermented Foods Drinks Revenue million Forecast, by Application 2020 & 2033
- Table 32: Global Fermented Foods Drinks Volume K Forecast, by Application 2020 & 2033
- Table 33: Global Fermented Foods Drinks Revenue million Forecast, by Type 2020 & 2033
- Table 34: Global Fermented Foods Drinks Volume K Forecast, by Type 2020 & 2033
- Table 35: Global Fermented Foods Drinks Revenue million Forecast, by Country 2020 & 2033
- Table 36: Global Fermented Foods Drinks Volume K Forecast, by Country 2020 & 2033
- Table 37: United Kingdom Fermented Foods Drinks Revenue (million) Forecast, by Application 2020 & 2033
- Table 38: United Kingdom Fermented Foods Drinks Volume (K) Forecast, by Application 2020 & 2033
- Table 39: Germany Fermented Foods Drinks Revenue (million) Forecast, by Application 2020 & 2033
- Table 40: Germany Fermented Foods Drinks Volume (K) Forecast, by Application 2020 & 2033
- Table 41: France Fermented Foods Drinks Revenue (million) Forecast, by Application 2020 & 2033
- Table 42: France Fermented Foods Drinks Volume (K) Forecast, by Application 2020 & 2033
- Table 43: Italy Fermented Foods Drinks Revenue (million) Forecast, by Application 2020 & 2033
- Table 44: Italy Fermented Foods Drinks Volume (K) Forecast, by Application 2020 & 2033
- Table 45: Spain Fermented Foods Drinks Revenue (million) Forecast, by Application 2020 & 2033
- Table 46: Spain Fermented Foods Drinks Volume (K) Forecast, by Application 2020 & 2033
- Table 47: Russia Fermented Foods Drinks Revenue (million) Forecast, by Application 2020 & 2033
- Table 48: Russia Fermented Foods Drinks Volume (K) Forecast, by Application 2020 & 2033
- Table 49: Benelux Fermented Foods Drinks Revenue (million) Forecast, by Application 2020 & 2033
- Table 50: Benelux Fermented Foods Drinks Volume (K) Forecast, by Application 2020 & 2033
- Table 51: Nordics Fermented Foods Drinks Revenue (million) Forecast, by Application 2020 & 2033
- Table 52: Nordics Fermented Foods Drinks Volume (K) Forecast, by Application 2020 & 2033
- Table 53: Rest of Europe Fermented Foods Drinks Revenue (million) Forecast, by Application 2020 & 2033
- Table 54: Rest of Europe Fermented Foods Drinks Volume (K) Forecast, by Application 2020 & 2033
- Table 55: Global Fermented Foods Drinks Revenue million Forecast, by Application 2020 & 2033
- Table 56: Global Fermented Foods Drinks Volume K Forecast, by Application 2020 & 2033
- Table 57: Global Fermented Foods Drinks Revenue million Forecast, by Type 2020 & 2033
- Table 58: Global Fermented Foods Drinks Volume K Forecast, by Type 2020 & 2033
- Table 59: Global Fermented Foods Drinks Revenue million Forecast, by Country 2020 & 2033
- Table 60: Global Fermented Foods Drinks Volume K Forecast, by Country 2020 & 2033
- Table 61: Turkey Fermented Foods Drinks Revenue (million) Forecast, by Application 2020 & 2033
- Table 62: Turkey Fermented Foods Drinks Volume (K) Forecast, by Application 2020 & 2033
- Table 63: Israel Fermented Foods Drinks Revenue (million) Forecast, by Application 2020 & 2033
- Table 64: Israel Fermented Foods Drinks Volume (K) Forecast, by Application 2020 & 2033
- Table 65: GCC Fermented Foods Drinks Revenue (million) Forecast, by Application 2020 & 2033
- Table 66: GCC Fermented Foods Drinks Volume (K) Forecast, by Application 2020 & 2033
- Table 67: North Africa Fermented Foods Drinks Revenue (million) Forecast, by Application 2020 & 2033
- Table 68: North Africa Fermented Foods Drinks Volume (K) Forecast, by Application 2020 & 2033
- Table 69: South Africa Fermented Foods Drinks Revenue (million) Forecast, by Application 2020 & 2033
- Table 70: South Africa Fermented Foods Drinks Volume (K) Forecast, by Application 2020 & 2033
- Table 71: Rest of Middle East & Africa Fermented Foods Drinks Revenue (million) Forecast, by Application 2020 & 2033
- Table 72: Rest of Middle East & Africa Fermented Foods Drinks Volume (K) Forecast, by Application 2020 & 2033
- Table 73: Global Fermented Foods Drinks Revenue million Forecast, by Application 2020 & 2033
- Table 74: Global Fermented Foods Drinks Volume K Forecast, by Application 2020 & 2033
- Table 75: Global Fermented Foods Drinks Revenue million Forecast, by Type 2020 & 2033
- Table 76: Global Fermented Foods Drinks Volume K Forecast, by Type 2020 & 2033
- Table 77: Global Fermented Foods Drinks Revenue million Forecast, by Country 2020 & 2033
- Table 78: Global Fermented Foods Drinks Volume K Forecast, by Country 2020 & 2033
- Table 79: China Fermented Foods Drinks Revenue (million) Forecast, by Application 2020 & 2033
- Table 80: China Fermented Foods Drinks Volume (K) Forecast, by Application 2020 & 2033
- Table 81: India Fermented Foods Drinks Revenue (million) Forecast, by Application 2020 & 2033
- Table 82: India Fermented Foods Drinks Volume (K) Forecast, by Application 2020 & 2033
- Table 83: Japan Fermented Foods Drinks Revenue (million) Forecast, by Application 2020 & 2033
- Table 84: Japan Fermented Foods Drinks Volume (K) Forecast, by Application 2020 & 2033
- Table 85: South Korea Fermented Foods Drinks Revenue (million) Forecast, by Application 2020 & 2033
- Table 86: South Korea Fermented Foods Drinks Volume (K) Forecast, by Application 2020 & 2033
- Table 87: ASEAN Fermented Foods Drinks Revenue (million) Forecast, by Application 2020 & 2033
- Table 88: ASEAN Fermented Foods Drinks Volume (K) Forecast, by Application 2020 & 2033
- Table 89: Oceania Fermented Foods Drinks Revenue (million) Forecast, by Application 2020 & 2033
- Table 90: Oceania Fermented Foods Drinks Volume (K) Forecast, by Application 2020 & 2033
- Table 91: Rest of Asia Pacific Fermented Foods Drinks Revenue (million) Forecast, by Application 2020 & 2033
- Table 92: Rest of Asia Pacific Fermented Foods Drinks Volume (K) Forecast, by Application 2020 & 2033
Frequently Asked Questions
1. What is the projected Compound Annual Growth Rate (CAGR) of the Fermented Foods Drinks?
The projected CAGR is approximately XXX%.
2. Which companies are prominent players in the Fermented Foods Drinks?
Key companies in the market include Coca Cola, Balance Water, Cargill, Comexim, Conagra Foods, Dr Pepper, DSM, Eklo Water, Danone, Grupo Petrópolis, Vichy Catalan, Hint Water, Nestle, Suntory Beverage & Food, PepsiCo.
3. What are the main segments of the Fermented Foods Drinks?
The market segments include Application, Type.
4. Can you provide details about the market size?
The market size is estimated to be USD XXX million as of 2022.
5. What are some drivers contributing to market growth?
N/A
6. What are the notable trends driving market growth?
N/A
7. Are there any restraints impacting market growth?
N/A
8. Can you provide examples of recent developments in the market?
N/A
9. What pricing options are available for accessing the report?
Pricing options include single-user, multi-user, and enterprise licenses priced at USD 3950.00, USD 5925.00, and USD 7900.00 respectively.
10. Is the market size provided in terms of value or volume?
The market size is provided in terms of value, measured in million and volume, measured in K.
11. Are there any specific market keywords associated with the report?
Yes, the market keyword associated with the report is "Fermented Foods Drinks," which aids in identifying and referencing the specific market segment covered.
12. How do I determine which pricing option suits my needs best?
The pricing options vary based on user requirements and access needs. Individual users may opt for single-user licenses, while businesses requiring broader access may choose multi-user or enterprise licenses for cost-effective access to the report.
13. Are there any additional resources or data provided in the Fermented Foods Drinks report?
While the report offers comprehensive insights, it's advisable to review the specific contents or supplementary materials provided to ascertain if additional resources or data are available.
14. How can I stay updated on further developments or reports in the Fermented Foods Drinks?
To stay informed about further developments, trends, and reports in the Fermented Foods Drinks, consider subscribing to industry newsletters, following relevant companies and organizations, or regularly checking reputable industry news sources and publications.
Methodology
Step 1 - Identification of Relevant Samples Size from Population Database


Step 2 - Approaches for Defining Global Market Size (Value, Volume* & Price*)

Note*: In applicable scenarios
Step 3 - Data Sources
Primary Research
- Web Analytics
- Survey Reports
- Research Institute
- Latest Research Reports
- Opinion Leaders
Secondary Research
- Annual Reports
- White Paper
- Latest Press Release
- Industry Association
- Paid Database
- Investor Presentations

Step 4 - Data Triangulation
Involves using different sources of information in order to increase the validity of a study
These sources are likely to be stakeholders in a program - participants, other researchers, program staff, other community members, and so on.
Then we put all data in single framework & apply various statistical tools to find out the dynamic on the market.
During the analysis stage, feedback from the stakeholder groups would be compared to determine areas of agreement as well as areas of divergence