

Key Insights
The global fiber beverage market is experiencing robust growth, driven by increasing consumer awareness of the health benefits associated with dietary fiber and a rising preference for functional beverages. The market, encompassing a wide range of products from fruit juices and dairy-based drinks to ready-to-drink (RTD) options and sports drinks fortified with fiber, is projected to maintain a considerable Compound Annual Growth Rate (CAGR) throughout the forecast period (2025-2033). Key drivers include the growing prevalence of digestive health concerns, increased demand for natural and clean-label products, and the rising popularity of convenient, on-the-go consumption options. Major players like Coca-Cola, PepsiCo, and Nestlé are actively investing in research and development to innovate within this space, launching new products that cater to evolving consumer preferences for specific health benefits such as improved gut health and weight management. The market segmentation reveals strong growth in the ready-to-drink segment, owing to its convenience and broad appeal. Geographical analysis shows significant regional variations, with developed markets like North America and Europe showing sustained growth, while emerging economies in Asia-Pacific are witnessing accelerated expansion fueled by rising disposable incomes and increased health consciousness.
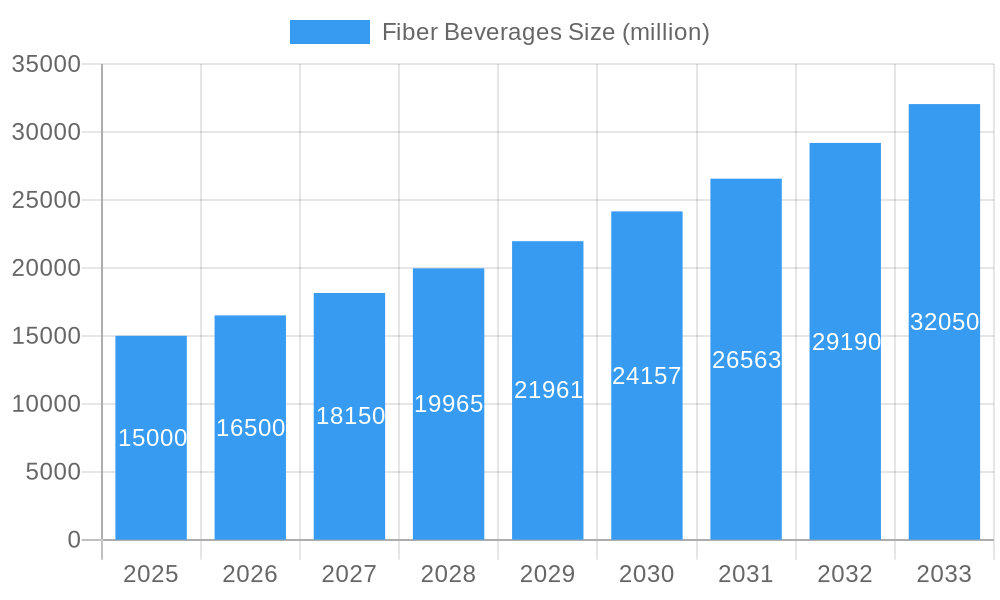
Fiber Beverages Market Size (In Billion)
Significant restraints on market growth include the relatively higher cost of fiber-enriched beverages compared to traditional counterparts and potential challenges related to taste and texture optimization. However, ongoing innovations in fiber extraction and formulation are addressing these limitations, leading to the development of more palatable and affordable fiber-enhanced drinks. The market is also witnessing a surge in the demand for plant-based and organic fiber beverages, further diversifying the product portfolio and broadening market appeal. Future growth will likely be influenced by the evolving regulatory landscape surrounding health claims, the introduction of novel fiber sources, and the continued development of sustainable and environmentally friendly packaging solutions. The competitive landscape is characterized by the presence of both established multinational corporations and smaller niche players, highlighting the dynamic nature and attractive prospects of the fiber beverage market.
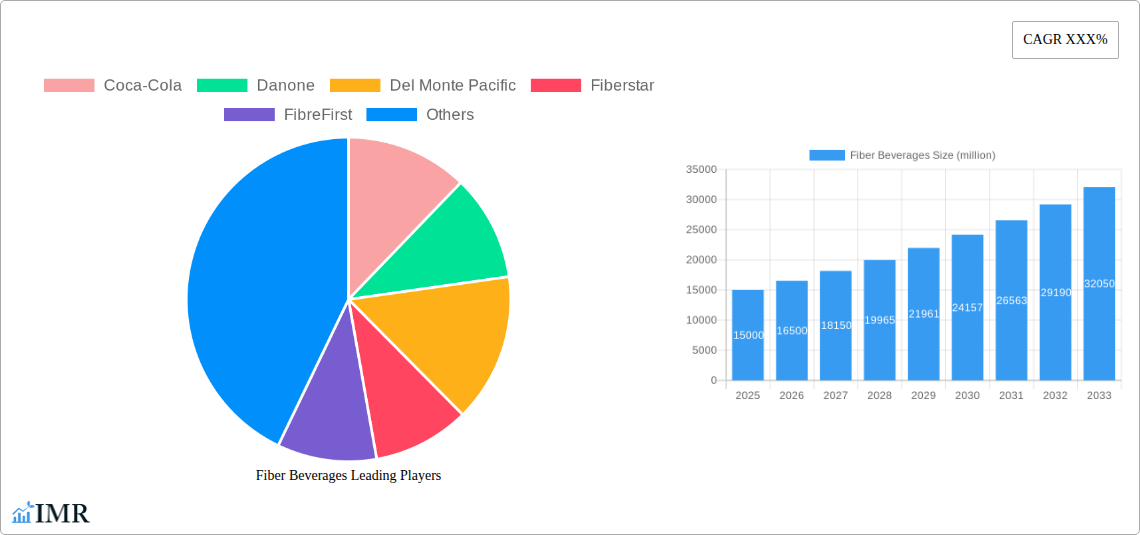
Fiber Beverages Company Market Share
Fiber Beverages Market Report: 2019-2033
This comprehensive report provides an in-depth analysis of the global fiber beverages market, encompassing market dynamics, growth trends, regional analysis, product landscape, and key players. The study period covers 2019-2033, with 2025 as the base year and forecast period spanning 2025-2033. This report is essential for industry professionals, investors, and anyone seeking to understand this rapidly evolving market. The parent market is the beverage industry, and the child market is functional beverages.
Fiber Beverages Market Dynamics & Structure
This section analyzes the competitive landscape, technological advancements, regulatory environment, and market trends within the fiber beverage industry. The global fiber beverage market is characterized by a mix of established multinational corporations and emerging players. Market concentration is moderate, with key players holding significant shares, but smaller companies innovating in niche segments.
Market Concentration: The top 5 players (Coca-Cola, PepsiCo, Nestle, Unilever, Danone) collectively hold approximately xx% of the market share (2025 estimate).
Technological Innovation: Advancements in fiber extraction, stabilization, and encapsulation technologies are key drivers. However, challenges remain in achieving optimal texture, taste, and shelf-life.
Regulatory Frameworks: Varying regulations across countries regarding health claims and fiber content impact market growth. Compliance costs can be substantial for smaller players.
Competitive Substitutes: Other functional beverages (e.g., probiotic drinks, vitamin-enhanced waters) compete with fiber beverages, leading to intense competition.
End-User Demographics: Health-conscious consumers, particularly millennials and Gen Z, are the primary drivers of growth. Increasing awareness of gut health is fueling demand.
M&A Trends: The historical period (2019-2024) witnessed xx M&A deals, primarily focused on expanding product portfolios and geographic reach. The predicted number of deals in the forecast period is xx.
Fiber Beverages Growth Trends & Insights
The global fiber beverages market experienced robust growth during the historical period (2019-2024), with a CAGR of xx%. This growth is attributed to increasing consumer awareness of the health benefits of fiber, coupled with the introduction of innovative products with improved taste and texture. The market size in 2024 reached approximately xx million units, and is projected to reach xx million units by 2033, showcasing a CAGR of xx% during the forecast period. The adoption rate of fiber beverages is also increasing, especially in developed economies. Technological disruptions, such as the development of new fiber sources and improved processing techniques, are further boosting market growth. Changing consumer preferences towards healthier and more functional beverages are significantly influencing the market's trajectory. Market penetration in key regions is expected to increase significantly by 2033.
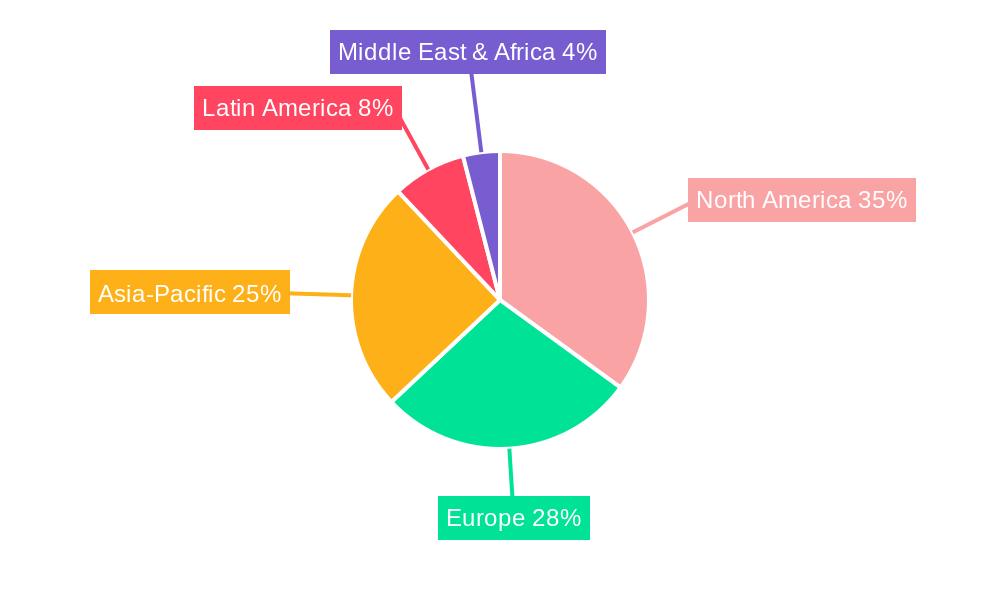
Dominant Regions, Countries, or Segments in Fiber Beverages
North America currently holds the largest market share in the fiber beverages market, followed by Europe and Asia-Pacific. The dominance of North America is driven by factors like high consumer awareness of health benefits, strong purchasing power, and the presence of major beverage manufacturers.
- Key Drivers in North America: High disposable incomes, strong regulatory support for functional foods, and a well-established distribution network.
- Key Drivers in Europe: Growing demand for functional foods and beverages, increasing health consciousness, and stringent regulations promoting healthy food choices.
- Key Drivers in Asia-Pacific: Rapidly growing middle class, increasing health awareness, and expanding distribution channels.
The growth potential in Asia-Pacific is significant, given its large population and rising health consciousness. Market share projections indicate that Asia-Pacific will experience the highest growth rate during the forecast period. Specific countries within these regions, such as the US, Germany, and China, are exhibiting exceptionally strong growth due to their unique market dynamics.
Fiber Beverages Product Landscape
Fiber beverages encompass a diverse range of products, including juices, smoothies, ready-to-drink (RTD) beverages, and functional waters. Recent innovations focus on incorporating various fiber types (soluble and insoluble) to maximize health benefits. Product formulations now emphasize improved taste and texture to enhance consumer appeal. Technological advancements have led to the development of stable fiber-rich beverages with extended shelf life. Unique selling propositions increasingly highlight specific health benefits, such as improved gut health, digestive regularity, and weight management.
Key Drivers, Barriers & Challenges in Fiber Beverages
Key Drivers:
- Growing consumer awareness of the importance of dietary fiber.
- Increasing prevalence of lifestyle diseases.
- Rising demand for functional and healthy beverages.
- Technological advancements in fiber extraction and processing.
Challenges and Restraints:
- High cost of production due to the expense of fiber ingredients.
- Potential for negative sensory attributes (e.g., texture, taste).
- Regulatory hurdles related to health claims and labeling requirements.
- Intense competition from other functional beverage categories. The impact of these challenges is estimated to slow market growth by xx% during the forecast period.
Emerging Opportunities in Fiber Beverages
Emerging opportunities include:
- Expanding into untapped markets in developing economies.
- Development of novel fiber sources and delivery systems.
- Creating customized fiber beverage formulations targeting specific health needs.
- Leveraging online channels and direct-to-consumer (DTC) strategies.
Growth Accelerators in the Fiber Beverages Industry
Technological breakthroughs in fiber extraction and stabilization, coupled with strategic partnerships between beverage manufacturers and fiber ingredient suppliers, are poised to fuel long-term growth. Expansion into new geographic markets, particularly in developing regions with rapidly growing middle classes, will unlock significant opportunities. Innovative marketing and branding strategies emphasizing the unique health benefits of fiber beverages will further accelerate market expansion.
Key Players Shaping the Fiber Beverages Market
- Coca-Cola
- Danone
- Del Monte Pacific
- Fiberstar
- FibreFirst
- Fruity Juicy
- GlaxoSmithKline
- Monster Beverage
- Nestle
- PepsiCo
- Sendayu Tinggi
- Tate & Lyle
- Unilever
- Yakult
Notable Milestones in Fiber Beverages Sector
- 2020: Nestle launched a new line of fiber-enhanced yogurt drinks.
- 2021: PepsiCo acquired a start-up specializing in plant-based fiber ingredients.
- 2022: Several major beverage companies announced commitments to increase fiber content in their products.
- 2023: New regulations regarding fiber labeling were introduced in several key markets. (Specific details would be added here depending on the actual information available.)
In-Depth Fiber Beverages Market Outlook
The fiber beverage market exhibits substantial growth potential over the coming decade. Continued innovation in product development, coupled with increasing consumer demand for healthier options, will drive market expansion. Strategic partnerships and acquisitions are expected to reshape the market landscape, leading to increased competition and product diversification. The market is poised to benefit from advancements in sustainable sourcing and processing of fiber ingredients, aligning with broader industry trends toward environmentally conscious consumption.
Fiber Beverages Segmentation
-
1. Application
- 1.1. Online Sales
- 1.2. Offline Sales
-
2. Type
- 2.1. Fruit Beverage
- 2.2. Carbonated Beverage
- 2.3. Others
Fiber Beverages Segmentation By Geography
-
1. North America
- 1.1. United States
- 1.2. Canada
- 1.3. Mexico
-
2. South America
- 2.1. Brazil
- 2.2. Argentina
- 2.3. Rest of South America
-
3. Europe
- 3.1. United Kingdom
- 3.2. Germany
- 3.3. France
- 3.4. Italy
- 3.5. Spain
- 3.6. Russia
- 3.7. Benelux
- 3.8. Nordics
- 3.9. Rest of Europe
-
4. Middle East & Africa
- 4.1. Turkey
- 4.2. Israel
- 4.3. GCC
- 4.4. North Africa
- 4.5. South Africa
- 4.6. Rest of Middle East & Africa
-
5. Asia Pacific
- 5.1. China
- 5.2. India
- 5.3. Japan
- 5.4. South Korea
- 5.5. ASEAN
- 5.6. Oceania
- 5.7. Rest of Asia Pacific
Fiber Beverages Regional Market Share
Geographic Coverage of Fiber Beverages
Fiber Beverages REPORT HIGHLIGHTS
| Aspects | Details |
|---|---|
| Study Period | 2020-2034 |
| Base Year | 2025 |
| Estimated Year | 2026 |
| Forecast Period | 2026-2034 |
| Historical Period | 2020-2025 |
| Growth Rate | CAGR of 7.3% from 2020-2034 |
| Segmentation |
|
Table of Contents
- 1. Introduction
- 1.1. Research Scope
- 1.2. Market Segmentation
- 1.3. Research Methodology
- 1.4. Definitions and Assumptions
- 2. Executive Summary
- 2.1. Introduction
- 3. Market Dynamics
- 3.1. Introduction
- 3.2. Market Drivers
- 3.3. Market Restrains
- 3.4. Market Trends
- 4. Market Factor Analysis
- 4.1. Porters Five Forces
- 4.2. Supply/Value Chain
- 4.3. PESTEL analysis
- 4.4. Market Entropy
- 4.5. Patent/Trademark Analysis
- 5. Global Fiber Beverages Analysis, Insights and Forecast, 2020-2032
- 5.1. Market Analysis, Insights and Forecast - by Application
- 5.1.1. Online Sales
- 5.1.2. Offline Sales
- 5.2. Market Analysis, Insights and Forecast - by Type
- 5.2.1. Fruit Beverage
- 5.2.2. Carbonated Beverage
- 5.2.3. Others
- 5.3. Market Analysis, Insights and Forecast - by Region
- 5.3.1. North America
- 5.3.2. South America
- 5.3.3. Europe
- 5.3.4. Middle East & Africa
- 5.3.5. Asia Pacific
- 5.1. Market Analysis, Insights and Forecast - by Application
- 6. North America Fiber Beverages Analysis, Insights and Forecast, 2020-2032
- 6.1. Market Analysis, Insights and Forecast - by Application
- 6.1.1. Online Sales
- 6.1.2. Offline Sales
- 6.2. Market Analysis, Insights and Forecast - by Type
- 6.2.1. Fruit Beverage
- 6.2.2. Carbonated Beverage
- 6.2.3. Others
- 6.1. Market Analysis, Insights and Forecast - by Application
- 7. South America Fiber Beverages Analysis, Insights and Forecast, 2020-2032
- 7.1. Market Analysis, Insights and Forecast - by Application
- 7.1.1. Online Sales
- 7.1.2. Offline Sales
- 7.2. Market Analysis, Insights and Forecast - by Type
- 7.2.1. Fruit Beverage
- 7.2.2. Carbonated Beverage
- 7.2.3. Others
- 7.1. Market Analysis, Insights and Forecast - by Application
- 8. Europe Fiber Beverages Analysis, Insights and Forecast, 2020-2032
- 8.1. Market Analysis, Insights and Forecast - by Application
- 8.1.1. Online Sales
- 8.1.2. Offline Sales
- 8.2. Market Analysis, Insights and Forecast - by Type
- 8.2.1. Fruit Beverage
- 8.2.2. Carbonated Beverage
- 8.2.3. Others
- 8.1. Market Analysis, Insights and Forecast - by Application
- 9. Middle East & Africa Fiber Beverages Analysis, Insights and Forecast, 2020-2032
- 9.1. Market Analysis, Insights and Forecast - by Application
- 9.1.1. Online Sales
- 9.1.2. Offline Sales
- 9.2. Market Analysis, Insights and Forecast - by Type
- 9.2.1. Fruit Beverage
- 9.2.2. Carbonated Beverage
- 9.2.3. Others
- 9.1. Market Analysis, Insights and Forecast - by Application
- 10. Asia Pacific Fiber Beverages Analysis, Insights and Forecast, 2020-2032
- 10.1. Market Analysis, Insights and Forecast - by Application
- 10.1.1. Online Sales
- 10.1.2. Offline Sales
- 10.2. Market Analysis, Insights and Forecast - by Type
- 10.2.1. Fruit Beverage
- 10.2.2. Carbonated Beverage
- 10.2.3. Others
- 10.1. Market Analysis, Insights and Forecast - by Application
- 11. Competitive Analysis
- 11.1. Global Market Share Analysis 2025
- 11.2. Company Profiles
- 11.2.1 Coca-Cola
- 11.2.1.1. Overview
- 11.2.1.2. Products
- 11.2.1.3. SWOT Analysis
- 11.2.1.4. Recent Developments
- 11.2.1.5. Financials (Based on Availability)
- 11.2.2 Danone
- 11.2.2.1. Overview
- 11.2.2.2. Products
- 11.2.2.3. SWOT Analysis
- 11.2.2.4. Recent Developments
- 11.2.2.5. Financials (Based on Availability)
- 11.2.3 Del Monte Pacific
- 11.2.3.1. Overview
- 11.2.3.2. Products
- 11.2.3.3. SWOT Analysis
- 11.2.3.4. Recent Developments
- 11.2.3.5. Financials (Based on Availability)
- 11.2.4 Fiberstar
- 11.2.4.1. Overview
- 11.2.4.2. Products
- 11.2.4.3. SWOT Analysis
- 11.2.4.4. Recent Developments
- 11.2.4.5. Financials (Based on Availability)
- 11.2.5 FibreFirst
- 11.2.5.1. Overview
- 11.2.5.2. Products
- 11.2.5.3. SWOT Analysis
- 11.2.5.4. Recent Developments
- 11.2.5.5. Financials (Based on Availability)
- 11.2.6 Fruity Juicy
- 11.2.6.1. Overview
- 11.2.6.2. Products
- 11.2.6.3. SWOT Analysis
- 11.2.6.4. Recent Developments
- 11.2.6.5. Financials (Based on Availability)
- 11.2.7 GlaxoSmithKline
- 11.2.7.1. Overview
- 11.2.7.2. Products
- 11.2.7.3. SWOT Analysis
- 11.2.7.4. Recent Developments
- 11.2.7.5. Financials (Based on Availability)
- 11.2.8 Monster Beverage
- 11.2.8.1. Overview
- 11.2.8.2. Products
- 11.2.8.3. SWOT Analysis
- 11.2.8.4. Recent Developments
- 11.2.8.5. Financials (Based on Availability)
- 11.2.9 Nestle
- 11.2.9.1. Overview
- 11.2.9.2. Products
- 11.2.9.3. SWOT Analysis
- 11.2.9.4. Recent Developments
- 11.2.9.5. Financials (Based on Availability)
- 11.2.10 PepsiCo
- 11.2.10.1. Overview
- 11.2.10.2. Products
- 11.2.10.3. SWOT Analysis
- 11.2.10.4. Recent Developments
- 11.2.10.5. Financials (Based on Availability)
- 11.2.11 Sendayu Tinggi
- 11.2.11.1. Overview
- 11.2.11.2. Products
- 11.2.11.3. SWOT Analysis
- 11.2.11.4. Recent Developments
- 11.2.11.5. Financials (Based on Availability)
- 11.2.12 Tate & Lyle
- 11.2.12.1. Overview
- 11.2.12.2. Products
- 11.2.12.3. SWOT Analysis
- 11.2.12.4. Recent Developments
- 11.2.12.5. Financials (Based on Availability)
- 11.2.13 Unilever
- 11.2.13.1. Overview
- 11.2.13.2. Products
- 11.2.13.3. SWOT Analysis
- 11.2.13.4. Recent Developments
- 11.2.13.5. Financials (Based on Availability)
- 11.2.14 Yakult
- 11.2.14.1. Overview
- 11.2.14.2. Products
- 11.2.14.3. SWOT Analysis
- 11.2.14.4. Recent Developments
- 11.2.14.5. Financials (Based on Availability)
- 11.2.1 Coca-Cola
List of Figures
- Figure 1: Global Fiber Beverages Revenue Breakdown (undefined, %) by Region 2025 & 2033
- Figure 2: Global Fiber Beverages Volume Breakdown (K, %) by Region 2025 & 2033
- Figure 3: North America Fiber Beverages Revenue (undefined), by Application 2025 & 2033
- Figure 4: North America Fiber Beverages Volume (K), by Application 2025 & 2033
- Figure 5: North America Fiber Beverages Revenue Share (%), by Application 2025 & 2033
- Figure 6: North America Fiber Beverages Volume Share (%), by Application 2025 & 2033
- Figure 7: North America Fiber Beverages Revenue (undefined), by Type 2025 & 2033
- Figure 8: North America Fiber Beverages Volume (K), by Type 2025 & 2033
- Figure 9: North America Fiber Beverages Revenue Share (%), by Type 2025 & 2033
- Figure 10: North America Fiber Beverages Volume Share (%), by Type 2025 & 2033
- Figure 11: North America Fiber Beverages Revenue (undefined), by Country 2025 & 2033
- Figure 12: North America Fiber Beverages Volume (K), by Country 2025 & 2033
- Figure 13: North America Fiber Beverages Revenue Share (%), by Country 2025 & 2033
- Figure 14: North America Fiber Beverages Volume Share (%), by Country 2025 & 2033
- Figure 15: South America Fiber Beverages Revenue (undefined), by Application 2025 & 2033
- Figure 16: South America Fiber Beverages Volume (K), by Application 2025 & 2033
- Figure 17: South America Fiber Beverages Revenue Share (%), by Application 2025 & 2033
- Figure 18: South America Fiber Beverages Volume Share (%), by Application 2025 & 2033
- Figure 19: South America Fiber Beverages Revenue (undefined), by Type 2025 & 2033
- Figure 20: South America Fiber Beverages Volume (K), by Type 2025 & 2033
- Figure 21: South America Fiber Beverages Revenue Share (%), by Type 2025 & 2033
- Figure 22: South America Fiber Beverages Volume Share (%), by Type 2025 & 2033
- Figure 23: South America Fiber Beverages Revenue (undefined), by Country 2025 & 2033
- Figure 24: South America Fiber Beverages Volume (K), by Country 2025 & 2033
- Figure 25: South America Fiber Beverages Revenue Share (%), by Country 2025 & 2033
- Figure 26: South America Fiber Beverages Volume Share (%), by Country 2025 & 2033
- Figure 27: Europe Fiber Beverages Revenue (undefined), by Application 2025 & 2033
- Figure 28: Europe Fiber Beverages Volume (K), by Application 2025 & 2033
- Figure 29: Europe Fiber Beverages Revenue Share (%), by Application 2025 & 2033
- Figure 30: Europe Fiber Beverages Volume Share (%), by Application 2025 & 2033
- Figure 31: Europe Fiber Beverages Revenue (undefined), by Type 2025 & 2033
- Figure 32: Europe Fiber Beverages Volume (K), by Type 2025 & 2033
- Figure 33: Europe Fiber Beverages Revenue Share (%), by Type 2025 & 2033
- Figure 34: Europe Fiber Beverages Volume Share (%), by Type 2025 & 2033
- Figure 35: Europe Fiber Beverages Revenue (undefined), by Country 2025 & 2033
- Figure 36: Europe Fiber Beverages Volume (K), by Country 2025 & 2033
- Figure 37: Europe Fiber Beverages Revenue Share (%), by Country 2025 & 2033
- Figure 38: Europe Fiber Beverages Volume Share (%), by Country 2025 & 2033
- Figure 39: Middle East & Africa Fiber Beverages Revenue (undefined), by Application 2025 & 2033
- Figure 40: Middle East & Africa Fiber Beverages Volume (K), by Application 2025 & 2033
- Figure 41: Middle East & Africa Fiber Beverages Revenue Share (%), by Application 2025 & 2033
- Figure 42: Middle East & Africa Fiber Beverages Volume Share (%), by Application 2025 & 2033
- Figure 43: Middle East & Africa Fiber Beverages Revenue (undefined), by Type 2025 & 2033
- Figure 44: Middle East & Africa Fiber Beverages Volume (K), by Type 2025 & 2033
- Figure 45: Middle East & Africa Fiber Beverages Revenue Share (%), by Type 2025 & 2033
- Figure 46: Middle East & Africa Fiber Beverages Volume Share (%), by Type 2025 & 2033
- Figure 47: Middle East & Africa Fiber Beverages Revenue (undefined), by Country 2025 & 2033
- Figure 48: Middle East & Africa Fiber Beverages Volume (K), by Country 2025 & 2033
- Figure 49: Middle East & Africa Fiber Beverages Revenue Share (%), by Country 2025 & 2033
- Figure 50: Middle East & Africa Fiber Beverages Volume Share (%), by Country 2025 & 2033
- Figure 51: Asia Pacific Fiber Beverages Revenue (undefined), by Application 2025 & 2033
- Figure 52: Asia Pacific Fiber Beverages Volume (K), by Application 2025 & 2033
- Figure 53: Asia Pacific Fiber Beverages Revenue Share (%), by Application 2025 & 2033
- Figure 54: Asia Pacific Fiber Beverages Volume Share (%), by Application 2025 & 2033
- Figure 55: Asia Pacific Fiber Beverages Revenue (undefined), by Type 2025 & 2033
- Figure 56: Asia Pacific Fiber Beverages Volume (K), by Type 2025 & 2033
- Figure 57: Asia Pacific Fiber Beverages Revenue Share (%), by Type 2025 & 2033
- Figure 58: Asia Pacific Fiber Beverages Volume Share (%), by Type 2025 & 2033
- Figure 59: Asia Pacific Fiber Beverages Revenue (undefined), by Country 2025 & 2033
- Figure 60: Asia Pacific Fiber Beverages Volume (K), by Country 2025 & 2033
- Figure 61: Asia Pacific Fiber Beverages Revenue Share (%), by Country 2025 & 2033
- Figure 62: Asia Pacific Fiber Beverages Volume Share (%), by Country 2025 & 2033
List of Tables
- Table 1: Global Fiber Beverages Revenue undefined Forecast, by Application 2020 & 2033
- Table 2: Global Fiber Beverages Volume K Forecast, by Application 2020 & 2033
- Table 3: Global Fiber Beverages Revenue undefined Forecast, by Type 2020 & 2033
- Table 4: Global Fiber Beverages Volume K Forecast, by Type 2020 & 2033
- Table 5: Global Fiber Beverages Revenue undefined Forecast, by Region 2020 & 2033
- Table 6: Global Fiber Beverages Volume K Forecast, by Region 2020 & 2033
- Table 7: Global Fiber Beverages Revenue undefined Forecast, by Application 2020 & 2033
- Table 8: Global Fiber Beverages Volume K Forecast, by Application 2020 & 2033
- Table 9: Global Fiber Beverages Revenue undefined Forecast, by Type 2020 & 2033
- Table 10: Global Fiber Beverages Volume K Forecast, by Type 2020 & 2033
- Table 11: Global Fiber Beverages Revenue undefined Forecast, by Country 2020 & 2033
- Table 12: Global Fiber Beverages Volume K Forecast, by Country 2020 & 2033
- Table 13: United States Fiber Beverages Revenue (undefined) Forecast, by Application 2020 & 2033
- Table 14: United States Fiber Beverages Volume (K) Forecast, by Application 2020 & 2033
- Table 15: Canada Fiber Beverages Revenue (undefined) Forecast, by Application 2020 & 2033
- Table 16: Canada Fiber Beverages Volume (K) Forecast, by Application 2020 & 2033
- Table 17: Mexico Fiber Beverages Revenue (undefined) Forecast, by Application 2020 & 2033
- Table 18: Mexico Fiber Beverages Volume (K) Forecast, by Application 2020 & 2033
- Table 19: Global Fiber Beverages Revenue undefined Forecast, by Application 2020 & 2033
- Table 20: Global Fiber Beverages Volume K Forecast, by Application 2020 & 2033
- Table 21: Global Fiber Beverages Revenue undefined Forecast, by Type 2020 & 2033
- Table 22: Global Fiber Beverages Volume K Forecast, by Type 2020 & 2033
- Table 23: Global Fiber Beverages Revenue undefined Forecast, by Country 2020 & 2033
- Table 24: Global Fiber Beverages Volume K Forecast, by Country 2020 & 2033
- Table 25: Brazil Fiber Beverages Revenue (undefined) Forecast, by Application 2020 & 2033
- Table 26: Brazil Fiber Beverages Volume (K) Forecast, by Application 2020 & 2033
- Table 27: Argentina Fiber Beverages Revenue (undefined) Forecast, by Application 2020 & 2033
- Table 28: Argentina Fiber Beverages Volume (K) Forecast, by Application 2020 & 2033
- Table 29: Rest of South America Fiber Beverages Revenue (undefined) Forecast, by Application 2020 & 2033
- Table 30: Rest of South America Fiber Beverages Volume (K) Forecast, by Application 2020 & 2033
- Table 31: Global Fiber Beverages Revenue undefined Forecast, by Application 2020 & 2033
- Table 32: Global Fiber Beverages Volume K Forecast, by Application 2020 & 2033
- Table 33: Global Fiber Beverages Revenue undefined Forecast, by Type 2020 & 2033
- Table 34: Global Fiber Beverages Volume K Forecast, by Type 2020 & 2033
- Table 35: Global Fiber Beverages Revenue undefined Forecast, by Country 2020 & 2033
- Table 36: Global Fiber Beverages Volume K Forecast, by Country 2020 & 2033
- Table 37: United Kingdom Fiber Beverages Revenue (undefined) Forecast, by Application 2020 & 2033
- Table 38: United Kingdom Fiber Beverages Volume (K) Forecast, by Application 2020 & 2033
- Table 39: Germany Fiber Beverages Revenue (undefined) Forecast, by Application 2020 & 2033
- Table 40: Germany Fiber Beverages Volume (K) Forecast, by Application 2020 & 2033
- Table 41: France Fiber Beverages Revenue (undefined) Forecast, by Application 2020 & 2033
- Table 42: France Fiber Beverages Volume (K) Forecast, by Application 2020 & 2033
- Table 43: Italy Fiber Beverages Revenue (undefined) Forecast, by Application 2020 & 2033
- Table 44: Italy Fiber Beverages Volume (K) Forecast, by Application 2020 & 2033
- Table 45: Spain Fiber Beverages Revenue (undefined) Forecast, by Application 2020 & 2033
- Table 46: Spain Fiber Beverages Volume (K) Forecast, by Application 2020 & 2033
- Table 47: Russia Fiber Beverages Revenue (undefined) Forecast, by Application 2020 & 2033
- Table 48: Russia Fiber Beverages Volume (K) Forecast, by Application 2020 & 2033
- Table 49: Benelux Fiber Beverages Revenue (undefined) Forecast, by Application 2020 & 2033
- Table 50: Benelux Fiber Beverages Volume (K) Forecast, by Application 2020 & 2033
- Table 51: Nordics Fiber Beverages Revenue (undefined) Forecast, by Application 2020 & 2033
- Table 52: Nordics Fiber Beverages Volume (K) Forecast, by Application 2020 & 2033
- Table 53: Rest of Europe Fiber Beverages Revenue (undefined) Forecast, by Application 2020 & 2033
- Table 54: Rest of Europe Fiber Beverages Volume (K) Forecast, by Application 2020 & 2033
- Table 55: Global Fiber Beverages Revenue undefined Forecast, by Application 2020 & 2033
- Table 56: Global Fiber Beverages Volume K Forecast, by Application 2020 & 2033
- Table 57: Global Fiber Beverages Revenue undefined Forecast, by Type 2020 & 2033
- Table 58: Global Fiber Beverages Volume K Forecast, by Type 2020 & 2033
- Table 59: Global Fiber Beverages Revenue undefined Forecast, by Country 2020 & 2033
- Table 60: Global Fiber Beverages Volume K Forecast, by Country 2020 & 2033
- Table 61: Turkey Fiber Beverages Revenue (undefined) Forecast, by Application 2020 & 2033
- Table 62: Turkey Fiber Beverages Volume (K) Forecast, by Application 2020 & 2033
- Table 63: Israel Fiber Beverages Revenue (undefined) Forecast, by Application 2020 & 2033
- Table 64: Israel Fiber Beverages Volume (K) Forecast, by Application 2020 & 2033
- Table 65: GCC Fiber Beverages Revenue (undefined) Forecast, by Application 2020 & 2033
- Table 66: GCC Fiber Beverages Volume (K) Forecast, by Application 2020 & 2033
- Table 67: North Africa Fiber Beverages Revenue (undefined) Forecast, by Application 2020 & 2033
- Table 68: North Africa Fiber Beverages Volume (K) Forecast, by Application 2020 & 2033
- Table 69: South Africa Fiber Beverages Revenue (undefined) Forecast, by Application 2020 & 2033
- Table 70: South Africa Fiber Beverages Volume (K) Forecast, by Application 2020 & 2033
- Table 71: Rest of Middle East & Africa Fiber Beverages Revenue (undefined) Forecast, by Application 2020 & 2033
- Table 72: Rest of Middle East & Africa Fiber Beverages Volume (K) Forecast, by Application 2020 & 2033
- Table 73: Global Fiber Beverages Revenue undefined Forecast, by Application 2020 & 2033
- Table 74: Global Fiber Beverages Volume K Forecast, by Application 2020 & 2033
- Table 75: Global Fiber Beverages Revenue undefined Forecast, by Type 2020 & 2033
- Table 76: Global Fiber Beverages Volume K Forecast, by Type 2020 & 2033
- Table 77: Global Fiber Beverages Revenue undefined Forecast, by Country 2020 & 2033
- Table 78: Global Fiber Beverages Volume K Forecast, by Country 2020 & 2033
- Table 79: China Fiber Beverages Revenue (undefined) Forecast, by Application 2020 & 2033
- Table 80: China Fiber Beverages Volume (K) Forecast, by Application 2020 & 2033
- Table 81: India Fiber Beverages Revenue (undefined) Forecast, by Application 2020 & 2033
- Table 82: India Fiber Beverages Volume (K) Forecast, by Application 2020 & 2033
- Table 83: Japan Fiber Beverages Revenue (undefined) Forecast, by Application 2020 & 2033
- Table 84: Japan Fiber Beverages Volume (K) Forecast, by Application 2020 & 2033
- Table 85: South Korea Fiber Beverages Revenue (undefined) Forecast, by Application 2020 & 2033
- Table 86: South Korea Fiber Beverages Volume (K) Forecast, by Application 2020 & 2033
- Table 87: ASEAN Fiber Beverages Revenue (undefined) Forecast, by Application 2020 & 2033
- Table 88: ASEAN Fiber Beverages Volume (K) Forecast, by Application 2020 & 2033
- Table 89: Oceania Fiber Beverages Revenue (undefined) Forecast, by Application 2020 & 2033
- Table 90: Oceania Fiber Beverages Volume (K) Forecast, by Application 2020 & 2033
- Table 91: Rest of Asia Pacific Fiber Beverages Revenue (undefined) Forecast, by Application 2020 & 2033
- Table 92: Rest of Asia Pacific Fiber Beverages Volume (K) Forecast, by Application 2020 & 2033
Frequently Asked Questions
1. What is the projected Compound Annual Growth Rate (CAGR) of the Fiber Beverages?
The projected CAGR is approximately 7.3%.
2. Which companies are prominent players in the Fiber Beverages?
Key companies in the market include Coca-Cola, Danone, Del Monte Pacific, Fiberstar, FibreFirst, Fruity Juicy, GlaxoSmithKline, Monster Beverage, Nestle, PepsiCo, Sendayu Tinggi, Tate & Lyle, Unilever, Yakult.
3. What are the main segments of the Fiber Beverages?
The market segments include Application, Type.
4. Can you provide details about the market size?
The market size is estimated to be USD XXX N/A as of 2022.
5. What are some drivers contributing to market growth?
N/A
6. What are the notable trends driving market growth?
N/A
7. Are there any restraints impacting market growth?
N/A
8. Can you provide examples of recent developments in the market?
N/A
9. What pricing options are available for accessing the report?
Pricing options include single-user, multi-user, and enterprise licenses priced at USD 3950.00, USD 5925.00, and USD 7900.00 respectively.
10. Is the market size provided in terms of value or volume?
The market size is provided in terms of value, measured in N/A and volume, measured in K.
11. Are there any specific market keywords associated with the report?
Yes, the market keyword associated with the report is "Fiber Beverages," which aids in identifying and referencing the specific market segment covered.
12. How do I determine which pricing option suits my needs best?
The pricing options vary based on user requirements and access needs. Individual users may opt for single-user licenses, while businesses requiring broader access may choose multi-user or enterprise licenses for cost-effective access to the report.
13. Are there any additional resources or data provided in the Fiber Beverages report?
While the report offers comprehensive insights, it's advisable to review the specific contents or supplementary materials provided to ascertain if additional resources or data are available.
14. How can I stay updated on further developments or reports in the Fiber Beverages?
To stay informed about further developments, trends, and reports in the Fiber Beverages, consider subscribing to industry newsletters, following relevant companies and organizations, or regularly checking reputable industry news sources and publications.
Methodology
Step 1 - Identification of Relevant Samples Size from Population Database


Step 2 - Approaches for Defining Global Market Size (Value, Volume* & Price*)

Note*: In applicable scenarios
Step 3 - Data Sources
Primary Research
- Web Analytics
- Survey Reports
- Research Institute
- Latest Research Reports
- Opinion Leaders
Secondary Research
- Annual Reports
- White Paper
- Latest Press Release
- Industry Association
- Paid Database
- Investor Presentations

Step 4 - Data Triangulation
Involves using different sources of information in order to increase the validity of a study
These sources are likely to be stakeholders in a program - participants, other researchers, program staff, other community members, and so on.
Then we put all data in single framework & apply various statistical tools to find out the dynamic on the market.
During the analysis stage, feedback from the stakeholder groups would be compared to determine areas of agreement as well as areas of divergence