

Key Insights
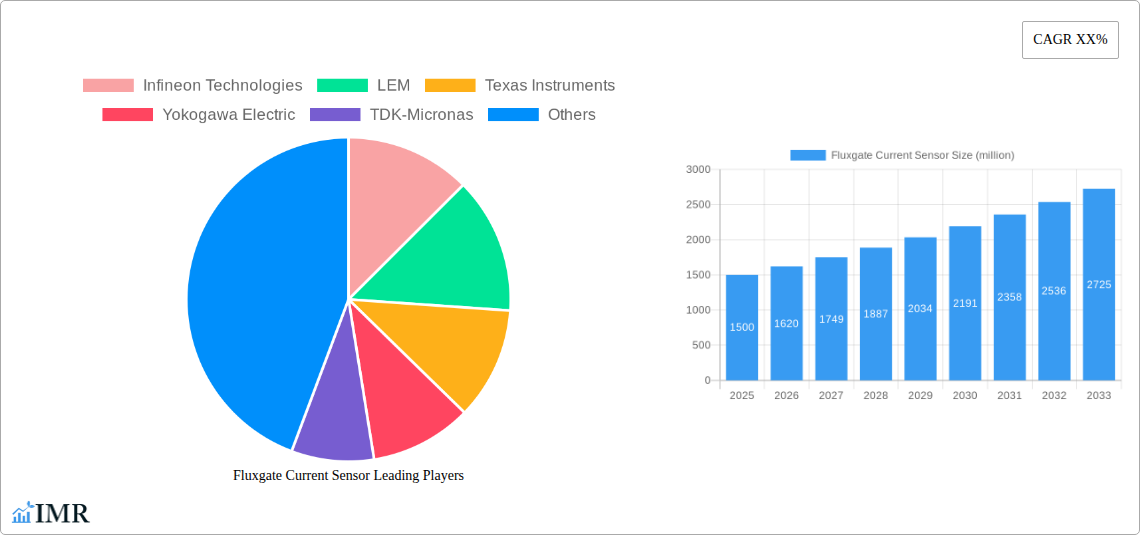
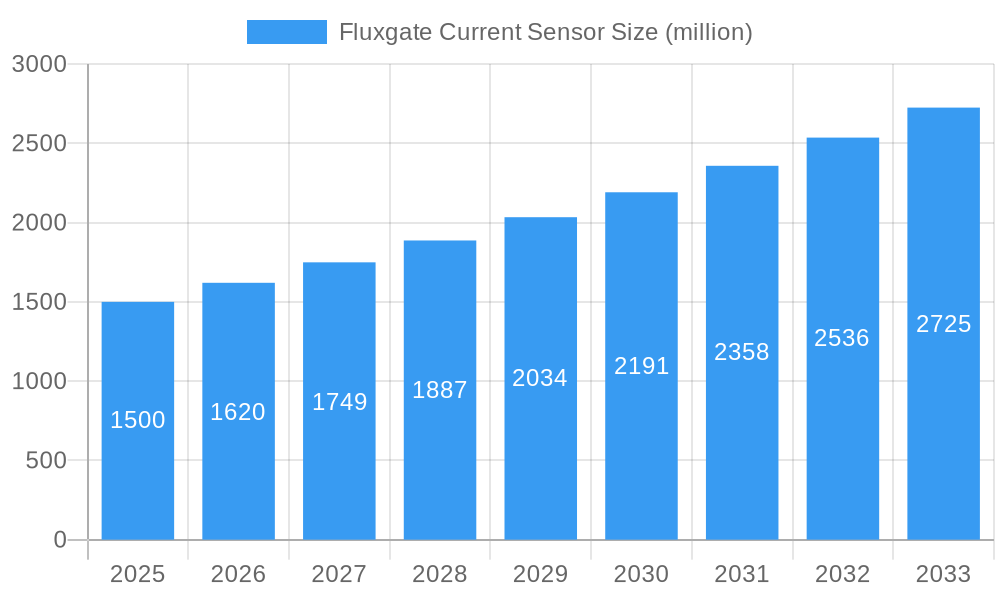
The Fluxgate Current Sensor market is experiencing robust growth, driven by increasing demand across diverse sectors. The market size in 2025 is estimated at $1.5 billion, projecting a Compound Annual Growth Rate (CAGR) of 8% from 2025 to 2033. This expansion is fueled by several key factors: the rising adoption of electric vehicles (EVs) and renewable energy sources, necessitating precise and reliable current measurement; the growing need for advanced power grid monitoring and management systems for improved efficiency and stability; and the increasing integration of smart metering technologies in both residential and industrial settings. Furthermore, technological advancements leading to smaller, more efficient, and cost-effective sensors are boosting market adoption. Key players like Infineon Technologies, LEM, and Texas Instruments are actively contributing to this growth through continuous innovation and strategic partnerships.
Fluxgate Current Sensor Market Size (In Billion)
However, certain restraints are also present. High initial investment costs associated with implementing Fluxgate Current Sensor technology can hinder adoption, particularly in developing economies. Furthermore, the market faces competition from alternative current sensing technologies, such as Hall-effect sensors and Rogowski coils. Despite these challenges, the long-term outlook for the Fluxgate Current Sensor market remains positive, driven by the sustained growth of its core application sectors and ongoing improvements in sensor technology. Market segmentation is primarily based on application (automotive, industrial, energy, etc.) and geography, with North America and Europe currently holding significant market shares, but Asia-Pacific expected to show the fastest growth in the coming years.
Fluxgate Current Sensor Company Market Share
Fluxgate Current Sensor Market Report: 2019-2033
This comprehensive report provides a detailed analysis of the Fluxgate Current Sensor market, offering invaluable insights for industry professionals, investors, and strategic decision-makers. Covering the period from 2019 to 2033, with a focus on the 2025-2033 forecast period, this report unveils the market dynamics, growth trends, and competitive landscape of this rapidly evolving sector. The report segments the market by various factors, including but not limited to application and geography. The parent market is the broader current sensing market, and the child market is specifically fluxgate current sensors.
Fluxgate Current Sensor Market Dynamics & Structure
The global fluxgate current sensor market, valued at $XX million in 2024, is characterized by moderate concentration with key players holding significant market share. Technological innovation, driven by the increasing demand for high-accuracy and high-bandwidth current measurement in diverse applications, is a primary growth driver. Stringent regulatory frameworks related to energy efficiency and safety standards influence product development and adoption. Competitive substitutes, such as Hall-effect sensors and current transformers, pose challenges, but the unique advantages of fluxgate sensors in specific applications maintain their market position. The end-user demographics are diverse, encompassing power electronics, renewable energy, industrial automation, and aerospace industries. M&A activity in the sector has been moderate, with approximately XX deals recorded in the historical period (2019-2024), primarily focusing on expanding product portfolios and geographical reach.
- Market Concentration: Moderately concentrated, with top 5 players holding approximately XX% market share in 2024.
- Technological Innovation: Focus on miniaturization, improved accuracy, wider bandwidth, and enhanced temperature stability.
- Regulatory Landscape: Compliance with international safety and energy efficiency standards significantly impacts market growth.
- Competitive Substitutes: Hall-effect sensors and current transformers pose competition in specific application segments.
- End-User Demographics: Power electronics, renewable energy, industrial automation, and aerospace are major end-use sectors.
- M&A Activity: Approximately XX M&A deals occurred between 2019 and 2024, driven by expansion strategies.
Fluxgate Current Sensor Growth Trends & Insights
The fluxgate current sensor market is experiencing robust growth, driven by the increasing demand for precise current measurement across various industries. The market size expanded from $XX million in 2019 to $XX million in 2024, exhibiting a CAGR of XX%. This growth is primarily fueled by the adoption of renewable energy technologies, the expansion of electric vehicle infrastructure, and the increasing automation in industrial processes. Technological advancements, such as the development of more sensitive and compact sensors, further propel market expansion. Changes in consumer behavior, including growing awareness of energy efficiency and sustainability, also contribute to increased demand. The market penetration rate is expected to increase from XX% in 2024 to XX% by 2033. Furthermore, the ongoing integration of smart grids and the rise of the Internet of Things (IoT) are expected to accelerate market growth. The projected CAGR for the forecast period (2025-2033) is XX%.
Dominant Regions, Countries, or Segments in Fluxgate Current Sensor
North America currently dominates the fluxgate current sensor market, driven by strong technological advancements, robust industrial automation, and supportive government policies promoting renewable energy adoption. The region's well-established infrastructure and high demand for precise current measurement contribute to its leading position. However, Asia-Pacific is projected to witness the fastest growth rate in the forecast period, fueled by rapid industrialization, increasing investments in renewable energy infrastructure, and a growing electric vehicle market. Europe also holds a substantial market share, driven by stringent environmental regulations and growing adoption of smart grid technologies.
- North America: Strong technological advancements, robust industrial automation, and supportive government policies.
- Asia-Pacific: Rapid industrialization, increasing investments in renewable energy, and a booming electric vehicle market.
- Europe: Stringent environmental regulations and the growing adoption of smart grid technologies.
Fluxgate Current Sensor Product Landscape
Fluxgate current sensors are available in various configurations, including single-phase and three-phase models, catering to diverse application needs. Recent innovations focus on improving accuracy, reducing size, and enhancing operational temperature ranges. Key performance metrics include accuracy, bandwidth, linearity, and temperature stability. Unique selling propositions often center on high precision, immunity to external magnetic fields, and suitability for high-current applications. Technological advancements have led to the development of smaller, more energy-efficient, and cost-effective sensors.
Key Drivers, Barriers & Challenges in Fluxgate Current Sensor
Key Drivers:
- Growing demand for high-accuracy current measurement in power electronics and renewable energy systems.
- Increasing adoption of electric vehicles and charging infrastructure.
- Expansion of industrial automation and smart grid technologies.
Key Challenges:
- High initial cost compared to alternative sensor technologies.
- Sensitivity to electromagnetic interference (EMI) in certain applications.
- Limited availability of skilled labor for sensor integration and maintenance. This has resulted in a XX% increase in installation costs in the past five years.
Emerging Opportunities in Fluxgate Current Sensor
The market presents significant opportunities in emerging applications such as:
- Integration into smart home energy management systems.
- Utilization in advanced medical devices requiring precise current control.
- Deployment in next-generation electric vehicle powertrains.
Growth Accelerators in the Fluxgate Current Sensor Industry
Strategic partnerships between sensor manufacturers and system integrators are accelerating market growth by facilitating seamless integration into various applications. Technological breakthroughs in materials science and sensor design are improving performance and reducing costs. Market expansion strategies targeting emerging economies with growing industrialization and renewable energy investments are also key drivers.
Key Players Shaping the Fluxgate Current Sensor Market
- Infineon Technologies
- LEM
- Texas Instruments
- Yokogawa Electric
- TDK-Micronas
- KEMET
- Allegro MicroSystems
- HIOKI
- Hunan Yinhe Electric
- Beijing TransFar Electronic
- Kohshin Electric Corporation
Notable Milestones in Fluxgate Current Sensor Sector
- 2020-Q3: Infineon Technologies launched a new generation of high-precision fluxgate current sensors with enhanced temperature stability.
- 2022-Q1: LEM acquired a smaller sensor manufacturer, expanding its product portfolio and market reach.
- 2023-Q4: Yokogawa Electric released a new series of compact fluxgate sensors optimized for renewable energy applications.
In-Depth Fluxgate Current Sensor Market Outlook
The fluxgate current sensor market is poised for significant growth in the coming years, driven by ongoing technological advancements, expanding applications, and increasing demand from key end-use sectors. Strategic partnerships, investments in R&D, and expansion into new geographic markets will further accelerate market expansion, offering lucrative opportunities for players across the value chain. The focus on enhanced accuracy, miniaturization, and cost reduction will shape the market landscape in the coming decade.
Fluxgate Current Sensor Segmentation
-
1. Application
- 1.1. Electric Power
- 1.2. Medical Equipment
- 1.3. Industrial Equipment
- 1.4. Automotive
- 1.5. other
-
2. Types
- 2.1. Single Magnetic Ring
- 2.2. Double Magnetic Ring
- 2.3. Multi-Magnetic Ring
Fluxgate Current Sensor Segmentation By Geography
-
1. North America
- 1.1. United States
- 1.2. Canada
- 1.3. Mexico
-
2. South America
- 2.1. Brazil
- 2.2. Argentina
- 2.3. Rest of South America
-
3. Europe
- 3.1. United Kingdom
- 3.2. Germany
- 3.3. France
- 3.4. Italy
- 3.5. Spain
- 3.6. Russia
- 3.7. Benelux
- 3.8. Nordics
- 3.9. Rest of Europe
-
4. Middle East & Africa
- 4.1. Turkey
- 4.2. Israel
- 4.3. GCC
- 4.4. North Africa
- 4.5. South Africa
- 4.6. Rest of Middle East & Africa
-
5. Asia Pacific
- 5.1. China
- 5.2. India
- 5.3. Japan
- 5.4. South Korea
- 5.5. ASEAN
- 5.6. Oceania
- 5.7. Rest of Asia Pacific

Fluxgate Current Sensor Regional Market Share
Geographic Coverage of Fluxgate Current Sensor
Fluxgate Current Sensor REPORT HIGHLIGHTS
| Aspects | Details |
|---|---|
| Study Period | 2020-2034 |
| Base Year | 2025 |
| Estimated Year | 2026 |
| Forecast Period | 2026-2034 |
| Historical Period | 2020-2025 |
| Growth Rate | CAGR of 10.3% from 2020-2034 |
| Segmentation |
|
Table of Contents
- 1. Introduction
- 1.1. Research Scope
- 1.2. Market Segmentation
- 1.3. Research Objective
- 1.4. Definitions and Assumptions
- 2. Executive Summary
- 2.1. Market Snapshot
- 3. Market Dynamics
- 3.1. Market Drivers
- 3.2. Market Restrains
- 3.3. Market Trends
- 3.4. Market Opportunities
- 4. Market Factor Analysis
- 4.1. Porters Five Forces
- 4.1.1. Bargaining Power of Suppliers
- 4.1.2. Bargaining Power of Buyers
- 4.1.3. Threat of New Entrants
- 4.1.4. Threat of Substitutes
- 4.1.5. Competitive Rivalry
- 4.2. PESTEL analysis
- 4.3. BCG Analysis
- 4.3.1. Stars (High Growth, High Market Share)
- 4.3.2. Cash Cows (Low Growth, High Market Share)
- 4.3.3. Question Mark (High Growth, Low Market Share)
- 4.3.4. Dogs (Low Growth, Low Market Share)
- 4.4. Ansoff Matrix Analysis
- 4.5. Supply Chain Analysis
- 4.6. Regulatory Landscape
- 4.7. Current Market Potential and Opportunity Assessment (TAM–SAM–SOM Framework)
- 4.8. IMR Analyst Note
- 4.1. Porters Five Forces
- 5. Market Analysis, Insights and Forecast 2021-2033
- 5.1. Market Analysis, Insights and Forecast - by Application
- 5.1.1. Electric Power
- 5.1.2. Medical Equipment
- 5.1.3. Industrial Equipment
- 5.1.4. Automotive
- 5.1.5. other
- 5.2. Market Analysis, Insights and Forecast - by Types
- 5.2.1. Single Magnetic Ring
- 5.2.2. Double Magnetic Ring
- 5.2.3. Multi-Magnetic Ring
- 5.3. Market Analysis, Insights and Forecast - by Region
- 5.3.1. North America
- 5.3.2. South America
- 5.3.3. Europe
- 5.3.4. Middle East & Africa
- 5.3.5. Asia Pacific
- 5.1. Market Analysis, Insights and Forecast - by Application
- 6. Global Fluxgate Current Sensor Analysis, Insights and Forecast, 2021-2033
- 6.1. Market Analysis, Insights and Forecast - by Application
- 6.1.1. Electric Power
- 6.1.2. Medical Equipment
- 6.1.3. Industrial Equipment
- 6.1.4. Automotive
- 6.1.5. other
- 6.2. Market Analysis, Insights and Forecast - by Types
- 6.2.1. Single Magnetic Ring
- 6.2.2. Double Magnetic Ring
- 6.2.3. Multi-Magnetic Ring
- 6.1. Market Analysis, Insights and Forecast - by Application
- 7. North America Fluxgate Current Sensor Analysis, Insights and Forecast, 2020-2032
- 7.1. Market Analysis, Insights and Forecast - by Application
- 7.1.1. Electric Power
- 7.1.2. Medical Equipment
- 7.1.3. Industrial Equipment
- 7.1.4. Automotive
- 7.1.5. other
- 7.2. Market Analysis, Insights and Forecast - by Types
- 7.2.1. Single Magnetic Ring
- 7.2.2. Double Magnetic Ring
- 7.2.3. Multi-Magnetic Ring
- 7.1. Market Analysis, Insights and Forecast - by Application
- 8. South America Fluxgate Current Sensor Analysis, Insights and Forecast, 2020-2032
- 8.1. Market Analysis, Insights and Forecast - by Application
- 8.1.1. Electric Power
- 8.1.2. Medical Equipment
- 8.1.3. Industrial Equipment
- 8.1.4. Automotive
- 8.1.5. other
- 8.2. Market Analysis, Insights and Forecast - by Types
- 8.2.1. Single Magnetic Ring
- 8.2.2. Double Magnetic Ring
- 8.2.3. Multi-Magnetic Ring
- 8.1. Market Analysis, Insights and Forecast - by Application
- 9. Europe Fluxgate Current Sensor Analysis, Insights and Forecast, 2020-2032
- 9.1. Market Analysis, Insights and Forecast - by Application
- 9.1.1. Electric Power
- 9.1.2. Medical Equipment
- 9.1.3. Industrial Equipment
- 9.1.4. Automotive
- 9.1.5. other
- 9.2. Market Analysis, Insights and Forecast - by Types
- 9.2.1. Single Magnetic Ring
- 9.2.2. Double Magnetic Ring
- 9.2.3. Multi-Magnetic Ring
- 9.1. Market Analysis, Insights and Forecast - by Application
- 10. Middle East & Africa Fluxgate Current Sensor Analysis, Insights and Forecast, 2020-2032
- 10.1. Market Analysis, Insights and Forecast - by Application
- 10.1.1. Electric Power
- 10.1.2. Medical Equipment
- 10.1.3. Industrial Equipment
- 10.1.4. Automotive
- 10.1.5. other
- 10.2. Market Analysis, Insights and Forecast - by Types
- 10.2.1. Single Magnetic Ring
- 10.2.2. Double Magnetic Ring
- 10.2.3. Multi-Magnetic Ring
- 10.1. Market Analysis, Insights and Forecast - by Application
- 11. Asia Pacific Fluxgate Current Sensor Analysis, Insights and Forecast, 2020-2032
- 11.1. Market Analysis, Insights and Forecast - by Application
- 11.1.1. Electric Power
- 11.1.2. Medical Equipment
- 11.1.3. Industrial Equipment
- 11.1.4. Automotive
- 11.1.5. other
- 11.2. Market Analysis, Insights and Forecast - by Types
- 11.2.1. Single Magnetic Ring
- 11.2.2. Double Magnetic Ring
- 11.2.3. Multi-Magnetic Ring
- 11.1. Market Analysis, Insights and Forecast - by Application
- 12. Competitive Analysis
- 12.1. Company Profiles
- 12.1.1 Infineon Technologies
- 12.1.1.1. Company Overview
- 12.1.1.2. Products
- 12.1.1.3. Company Financials
- 12.1.1.4. SWOT Analysis
- 12.1.2 LEM
- 12.1.2.1. Company Overview
- 12.1.2.2. Products
- 12.1.2.3. Company Financials
- 12.1.2.4. SWOT Analysis
- 12.1.3 Texas Instruments
- 12.1.3.1. Company Overview
- 12.1.3.2. Products
- 12.1.3.3. Company Financials
- 12.1.3.4. SWOT Analysis
- 12.1.4 Yokogawa Electric
- 12.1.4.1. Company Overview
- 12.1.4.2. Products
- 12.1.4.3. Company Financials
- 12.1.4.4. SWOT Analysis
- 12.1.5 TDK-Micronas
- 12.1.5.1. Company Overview
- 12.1.5.2. Products
- 12.1.5.3. Company Financials
- 12.1.5.4. SWOT Analysis
- 12.1.6 KEMET
- 12.1.6.1. Company Overview
- 12.1.6.2. Products
- 12.1.6.3. Company Financials
- 12.1.6.4. SWOT Analysis
- 12.1.7 Allegro MicroSystems
- 12.1.7.1. Company Overview
- 12.1.7.2. Products
- 12.1.7.3. Company Financials
- 12.1.7.4. SWOT Analysis
- 12.1.8 HIOKI
- 12.1.8.1. Company Overview
- 12.1.8.2. Products
- 12.1.8.3. Company Financials
- 12.1.8.4. SWOT Analysis
- 12.1.9 Hunan Yinhe Electric
- 12.1.9.1. Company Overview
- 12.1.9.2. Products
- 12.1.9.3. Company Financials
- 12.1.9.4. SWOT Analysis
- 12.1.10 Beijing TransFar Electronic
- 12.1.10.1. Company Overview
- 12.1.10.2. Products
- 12.1.10.3. Company Financials
- 12.1.10.4. SWOT Analysis
- 12.1.11 Kohshin Electric Corporation
- 12.1.11.1. Company Overview
- 12.1.11.2. Products
- 12.1.11.3. Company Financials
- 12.1.11.4. SWOT Analysis
- 12.1.1 Infineon Technologies
- 12.2. Market Entropy
- 12.2.1 Company's Key Areas Served
- 12.2.2 Recent Developments
- 12.3. Company Market Share Analysis 2025
- 12.3.1 Top 5 Companies Market Share Analysis
- 12.3.2 Top 3 Companies Market Share Analysis
- 12.4. List of Potential Customers
- 13. Research Methodology
List of Figures
- Figure 1: Global Fluxgate Current Sensor Revenue Breakdown (undefined, %) by Region 2025 & 2033
- Figure 2: Global Fluxgate Current Sensor Volume Breakdown (K, %) by Region 2025 & 2033
- Figure 3: North America Fluxgate Current Sensor Revenue (undefined), by Application 2025 & 2033
- Figure 4: North America Fluxgate Current Sensor Volume (K), by Application 2025 & 2033
- Figure 5: North America Fluxgate Current Sensor Revenue Share (%), by Application 2025 & 2033
- Figure 6: North America Fluxgate Current Sensor Volume Share (%), by Application 2025 & 2033
- Figure 7: North America Fluxgate Current Sensor Revenue (undefined), by Types 2025 & 2033
- Figure 8: North America Fluxgate Current Sensor Volume (K), by Types 2025 & 2033
- Figure 9: North America Fluxgate Current Sensor Revenue Share (%), by Types 2025 & 2033
- Figure 10: North America Fluxgate Current Sensor Volume Share (%), by Types 2025 & 2033
- Figure 11: North America Fluxgate Current Sensor Revenue (undefined), by Country 2025 & 2033
- Figure 12: North America Fluxgate Current Sensor Volume (K), by Country 2025 & 2033
- Figure 13: North America Fluxgate Current Sensor Revenue Share (%), by Country 2025 & 2033
- Figure 14: North America Fluxgate Current Sensor Volume Share (%), by Country 2025 & 2033
- Figure 15: South America Fluxgate Current Sensor Revenue (undefined), by Application 2025 & 2033
- Figure 16: South America Fluxgate Current Sensor Volume (K), by Application 2025 & 2033
- Figure 17: South America Fluxgate Current Sensor Revenue Share (%), by Application 2025 & 2033
- Figure 18: South America Fluxgate Current Sensor Volume Share (%), by Application 2025 & 2033
- Figure 19: South America Fluxgate Current Sensor Revenue (undefined), by Types 2025 & 2033
- Figure 20: South America Fluxgate Current Sensor Volume (K), by Types 2025 & 2033
- Figure 21: South America Fluxgate Current Sensor Revenue Share (%), by Types 2025 & 2033
- Figure 22: South America Fluxgate Current Sensor Volume Share (%), by Types 2025 & 2033
- Figure 23: South America Fluxgate Current Sensor Revenue (undefined), by Country 2025 & 2033
- Figure 24: South America Fluxgate Current Sensor Volume (K), by Country 2025 & 2033
- Figure 25: South America Fluxgate Current Sensor Revenue Share (%), by Country 2025 & 2033
- Figure 26: South America Fluxgate Current Sensor Volume Share (%), by Country 2025 & 2033
- Figure 27: Europe Fluxgate Current Sensor Revenue (undefined), by Application 2025 & 2033
- Figure 28: Europe Fluxgate Current Sensor Volume (K), by Application 2025 & 2033
- Figure 29: Europe Fluxgate Current Sensor Revenue Share (%), by Application 2025 & 2033
- Figure 30: Europe Fluxgate Current Sensor Volume Share (%), by Application 2025 & 2033
- Figure 31: Europe Fluxgate Current Sensor Revenue (undefined), by Types 2025 & 2033
- Figure 32: Europe Fluxgate Current Sensor Volume (K), by Types 2025 & 2033
- Figure 33: Europe Fluxgate Current Sensor Revenue Share (%), by Types 2025 & 2033
- Figure 34: Europe Fluxgate Current Sensor Volume Share (%), by Types 2025 & 2033
- Figure 35: Europe Fluxgate Current Sensor Revenue (undefined), by Country 2025 & 2033
- Figure 36: Europe Fluxgate Current Sensor Volume (K), by Country 2025 & 2033
- Figure 37: Europe Fluxgate Current Sensor Revenue Share (%), by Country 2025 & 2033
- Figure 38: Europe Fluxgate Current Sensor Volume Share (%), by Country 2025 & 2033
- Figure 39: Middle East & Africa Fluxgate Current Sensor Revenue (undefined), by Application 2025 & 2033
- Figure 40: Middle East & Africa Fluxgate Current Sensor Volume (K), by Application 2025 & 2033
- Figure 41: Middle East & Africa Fluxgate Current Sensor Revenue Share (%), by Application 2025 & 2033
- Figure 42: Middle East & Africa Fluxgate Current Sensor Volume Share (%), by Application 2025 & 2033
- Figure 43: Middle East & Africa Fluxgate Current Sensor Revenue (undefined), by Types 2025 & 2033
- Figure 44: Middle East & Africa Fluxgate Current Sensor Volume (K), by Types 2025 & 2033
- Figure 45: Middle East & Africa Fluxgate Current Sensor Revenue Share (%), by Types 2025 & 2033
- Figure 46: Middle East & Africa Fluxgate Current Sensor Volume Share (%), by Types 2025 & 2033
- Figure 47: Middle East & Africa Fluxgate Current Sensor Revenue (undefined), by Country 2025 & 2033
- Figure 48: Middle East & Africa Fluxgate Current Sensor Volume (K), by Country 2025 & 2033
- Figure 49: Middle East & Africa Fluxgate Current Sensor Revenue Share (%), by Country 2025 & 2033
- Figure 50: Middle East & Africa Fluxgate Current Sensor Volume Share (%), by Country 2025 & 2033
- Figure 51: Asia Pacific Fluxgate Current Sensor Revenue (undefined), by Application 2025 & 2033
- Figure 52: Asia Pacific Fluxgate Current Sensor Volume (K), by Application 2025 & 2033
- Figure 53: Asia Pacific Fluxgate Current Sensor Revenue Share (%), by Application 2025 & 2033
- Figure 54: Asia Pacific Fluxgate Current Sensor Volume Share (%), by Application 2025 & 2033
- Figure 55: Asia Pacific Fluxgate Current Sensor Revenue (undefined), by Types 2025 & 2033
- Figure 56: Asia Pacific Fluxgate Current Sensor Volume (K), by Types 2025 & 2033
- Figure 57: Asia Pacific Fluxgate Current Sensor Revenue Share (%), by Types 2025 & 2033
- Figure 58: Asia Pacific Fluxgate Current Sensor Volume Share (%), by Types 2025 & 2033
- Figure 59: Asia Pacific Fluxgate Current Sensor Revenue (undefined), by Country 2025 & 2033
- Figure 60: Asia Pacific Fluxgate Current Sensor Volume (K), by Country 2025 & 2033
- Figure 61: Asia Pacific Fluxgate Current Sensor Revenue Share (%), by Country 2025 & 2033
- Figure 62: Asia Pacific Fluxgate Current Sensor Volume Share (%), by Country 2025 & 2033
List of Tables
- Table 1: Global Fluxgate Current Sensor Revenue undefined Forecast, by Application 2020 & 2033
- Table 2: Global Fluxgate Current Sensor Volume K Forecast, by Application 2020 & 2033
- Table 3: Global Fluxgate Current Sensor Revenue undefined Forecast, by Types 2020 & 2033
- Table 4: Global Fluxgate Current Sensor Volume K Forecast, by Types 2020 & 2033
- Table 5: Global Fluxgate Current Sensor Revenue undefined Forecast, by Region 2020 & 2033
- Table 6: Global Fluxgate Current Sensor Volume K Forecast, by Region 2020 & 2033
- Table 7: Global Fluxgate Current Sensor Revenue undefined Forecast, by Application 2020 & 2033
- Table 8: Global Fluxgate Current Sensor Volume K Forecast, by Application 2020 & 2033
- Table 9: Global Fluxgate Current Sensor Revenue undefined Forecast, by Types 2020 & 2033
- Table 10: Global Fluxgate Current Sensor Volume K Forecast, by Types 2020 & 2033
- Table 11: Global Fluxgate Current Sensor Revenue undefined Forecast, by Country 2020 & 2033
- Table 12: Global Fluxgate Current Sensor Volume K Forecast, by Country 2020 & 2033
- Table 13: United States Fluxgate Current Sensor Revenue (undefined) Forecast, by Application 2020 & 2033
- Table 14: United States Fluxgate Current Sensor Volume (K) Forecast, by Application 2020 & 2033
- Table 15: Canada Fluxgate Current Sensor Revenue (undefined) Forecast, by Application 2020 & 2033
- Table 16: Canada Fluxgate Current Sensor Volume (K) Forecast, by Application 2020 & 2033
- Table 17: Mexico Fluxgate Current Sensor Revenue (undefined) Forecast, by Application 2020 & 2033
- Table 18: Mexico Fluxgate Current Sensor Volume (K) Forecast, by Application 2020 & 2033
- Table 19: Global Fluxgate Current Sensor Revenue undefined Forecast, by Application 2020 & 2033
- Table 20: Global Fluxgate Current Sensor Volume K Forecast, by Application 2020 & 2033
- Table 21: Global Fluxgate Current Sensor Revenue undefined Forecast, by Types 2020 & 2033
- Table 22: Global Fluxgate Current Sensor Volume K Forecast, by Types 2020 & 2033
- Table 23: Global Fluxgate Current Sensor Revenue undefined Forecast, by Country 2020 & 2033
- Table 24: Global Fluxgate Current Sensor Volume K Forecast, by Country 2020 & 2033
- Table 25: Brazil Fluxgate Current Sensor Revenue (undefined) Forecast, by Application 2020 & 2033
- Table 26: Brazil Fluxgate Current Sensor Volume (K) Forecast, by Application 2020 & 2033
- Table 27: Argentina Fluxgate Current Sensor Revenue (undefined) Forecast, by Application 2020 & 2033
- Table 28: Argentina Fluxgate Current Sensor Volume (K) Forecast, by Application 2020 & 2033
- Table 29: Rest of South America Fluxgate Current Sensor Revenue (undefined) Forecast, by Application 2020 & 2033
- Table 30: Rest of South America Fluxgate Current Sensor Volume (K) Forecast, by Application 2020 & 2033
- Table 31: Global Fluxgate Current Sensor Revenue undefined Forecast, by Application 2020 & 2033
- Table 32: Global Fluxgate Current Sensor Volume K Forecast, by Application 2020 & 2033
- Table 33: Global Fluxgate Current Sensor Revenue undefined Forecast, by Types 2020 & 2033
- Table 34: Global Fluxgate Current Sensor Volume K Forecast, by Types 2020 & 2033
- Table 35: Global Fluxgate Current Sensor Revenue undefined Forecast, by Country 2020 & 2033
- Table 36: Global Fluxgate Current Sensor Volume K Forecast, by Country 2020 & 2033
- Table 37: United Kingdom Fluxgate Current Sensor Revenue (undefined) Forecast, by Application 2020 & 2033
- Table 38: United Kingdom Fluxgate Current Sensor Volume (K) Forecast, by Application 2020 & 2033
- Table 39: Germany Fluxgate Current Sensor Revenue (undefined) Forecast, by Application 2020 & 2033
- Table 40: Germany Fluxgate Current Sensor Volume (K) Forecast, by Application 2020 & 2033
- Table 41: France Fluxgate Current Sensor Revenue (undefined) Forecast, by Application 2020 & 2033
- Table 42: France Fluxgate Current Sensor Volume (K) Forecast, by Application 2020 & 2033
- Table 43: Italy Fluxgate Current Sensor Revenue (undefined) Forecast, by Application 2020 & 2033
- Table 44: Italy Fluxgate Current Sensor Volume (K) Forecast, by Application 2020 & 2033
- Table 45: Spain Fluxgate Current Sensor Revenue (undefined) Forecast, by Application 2020 & 2033
- Table 46: Spain Fluxgate Current Sensor Volume (K) Forecast, by Application 2020 & 2033
- Table 47: Russia Fluxgate Current Sensor Revenue (undefined) Forecast, by Application 2020 & 2033
- Table 48: Russia Fluxgate Current Sensor Volume (K) Forecast, by Application 2020 & 2033
- Table 49: Benelux Fluxgate Current Sensor Revenue (undefined) Forecast, by Application 2020 & 2033
- Table 50: Benelux Fluxgate Current Sensor Volume (K) Forecast, by Application 2020 & 2033
- Table 51: Nordics Fluxgate Current Sensor Revenue (undefined) Forecast, by Application 2020 & 2033
- Table 52: Nordics Fluxgate Current Sensor Volume (K) Forecast, by Application 2020 & 2033
- Table 53: Rest of Europe Fluxgate Current Sensor Revenue (undefined) Forecast, by Application 2020 & 2033
- Table 54: Rest of Europe Fluxgate Current Sensor Volume (K) Forecast, by Application 2020 & 2033
- Table 55: Global Fluxgate Current Sensor Revenue undefined Forecast, by Application 2020 & 2033
- Table 56: Global Fluxgate Current Sensor Volume K Forecast, by Application 2020 & 2033
- Table 57: Global Fluxgate Current Sensor Revenue undefined Forecast, by Types 2020 & 2033
- Table 58: Global Fluxgate Current Sensor Volume K Forecast, by Types 2020 & 2033
- Table 59: Global Fluxgate Current Sensor Revenue undefined Forecast, by Country 2020 & 2033
- Table 60: Global Fluxgate Current Sensor Volume K Forecast, by Country 2020 & 2033
- Table 61: Turkey Fluxgate Current Sensor Revenue (undefined) Forecast, by Application 2020 & 2033
- Table 62: Turkey Fluxgate Current Sensor Volume (K) Forecast, by Application 2020 & 2033
- Table 63: Israel Fluxgate Current Sensor Revenue (undefined) Forecast, by Application 2020 & 2033
- Table 64: Israel Fluxgate Current Sensor Volume (K) Forecast, by Application 2020 & 2033
- Table 65: GCC Fluxgate Current Sensor Revenue (undefined) Forecast, by Application 2020 & 2033
- Table 66: GCC Fluxgate Current Sensor Volume (K) Forecast, by Application 2020 & 2033
- Table 67: North Africa Fluxgate Current Sensor Revenue (undefined) Forecast, by Application 2020 & 2033
- Table 68: North Africa Fluxgate Current Sensor Volume (K) Forecast, by Application 2020 & 2033
- Table 69: South Africa Fluxgate Current Sensor Revenue (undefined) Forecast, by Application 2020 & 2033
- Table 70: South Africa Fluxgate Current Sensor Volume (K) Forecast, by Application 2020 & 2033
- Table 71: Rest of Middle East & Africa Fluxgate Current Sensor Revenue (undefined) Forecast, by Application 2020 & 2033
- Table 72: Rest of Middle East & Africa Fluxgate Current Sensor Volume (K) Forecast, by Application 2020 & 2033
- Table 73: Global Fluxgate Current Sensor Revenue undefined Forecast, by Application 2020 & 2033
- Table 74: Global Fluxgate Current Sensor Volume K Forecast, by Application 2020 & 2033
- Table 75: Global Fluxgate Current Sensor Revenue undefined Forecast, by Types 2020 & 2033
- Table 76: Global Fluxgate Current Sensor Volume K Forecast, by Types 2020 & 2033
- Table 77: Global Fluxgate Current Sensor Revenue undefined Forecast, by Country 2020 & 2033
- Table 78: Global Fluxgate Current Sensor Volume K Forecast, by Country 2020 & 2033
- Table 79: China Fluxgate Current Sensor Revenue (undefined) Forecast, by Application 2020 & 2033
- Table 80: China Fluxgate Current Sensor Volume (K) Forecast, by Application 2020 & 2033
- Table 81: India Fluxgate Current Sensor Revenue (undefined) Forecast, by Application 2020 & 2033
- Table 82: India Fluxgate Current Sensor Volume (K) Forecast, by Application 2020 & 2033
- Table 83: Japan Fluxgate Current Sensor Revenue (undefined) Forecast, by Application 2020 & 2033
- Table 84: Japan Fluxgate Current Sensor Volume (K) Forecast, by Application 2020 & 2033
- Table 85: South Korea Fluxgate Current Sensor Revenue (undefined) Forecast, by Application 2020 & 2033
- Table 86: South Korea Fluxgate Current Sensor Volume (K) Forecast, by Application 2020 & 2033
- Table 87: ASEAN Fluxgate Current Sensor Revenue (undefined) Forecast, by Application 2020 & 2033
- Table 88: ASEAN Fluxgate Current Sensor Volume (K) Forecast, by Application 2020 & 2033
- Table 89: Oceania Fluxgate Current Sensor Revenue (undefined) Forecast, by Application 2020 & 2033
- Table 90: Oceania Fluxgate Current Sensor Volume (K) Forecast, by Application 2020 & 2033
- Table 91: Rest of Asia Pacific Fluxgate Current Sensor Revenue (undefined) Forecast, by Application 2020 & 2033
- Table 92: Rest of Asia Pacific Fluxgate Current Sensor Volume (K) Forecast, by Application 2020 & 2033
Frequently Asked Questions
1. What is the projected Compound Annual Growth Rate (CAGR) of the Fluxgate Current Sensor?
The projected CAGR is approximately 10.3%.
2. Which companies are prominent players in the Fluxgate Current Sensor?
Key companies in the market include Infineon Technologies, LEM, Texas Instruments, Yokogawa Electric, TDK-Micronas, KEMET, Allegro MicroSystems, HIOKI, Hunan Yinhe Electric, Beijing TransFar Electronic, Kohshin Electric Corporation.
3. What are the main segments of the Fluxgate Current Sensor?
The market segments include Application, Types.
4. Can you provide details about the market size?
The market size is estimated to be USD XXX N/A as of 2022.
5. What are some drivers contributing to market growth?
N/A
6. What are the notable trends driving market growth?
N/A
7. Are there any restraints impacting market growth?
N/A
8. Can you provide examples of recent developments in the market?
N/A
9. What pricing options are available for accessing the report?
Pricing options include single-user, multi-user, and enterprise licenses priced at USD 3350.00, USD 5025.00, and USD 6700.00 respectively.
10. Is the market size provided in terms of value or volume?
The market size is provided in terms of value, measured in N/A and volume, measured in K.
11. Are there any specific market keywords associated with the report?
Yes, the market keyword associated with the report is "Fluxgate Current Sensor," which aids in identifying and referencing the specific market segment covered.
12. How do I determine which pricing option suits my needs best?
The pricing options vary based on user requirements and access needs. Individual users may opt for single-user licenses, while businesses requiring broader access may choose multi-user or enterprise licenses for cost-effective access to the report.
13. Are there any additional resources or data provided in the Fluxgate Current Sensor report?
While the report offers comprehensive insights, it's advisable to review the specific contents or supplementary materials provided to ascertain if additional resources or data are available.
14. How can I stay updated on further developments or reports in the Fluxgate Current Sensor?
To stay informed about further developments, trends, and reports in the Fluxgate Current Sensor, consider subscribing to industry newsletters, following relevant companies and organizations, or regularly checking reputable industry news sources and publications.
Methodology
Step 1 - Identification of Relevant Samples Size from Population Database


Step 2 - Approaches for Defining Global Market Size (Value, Volume* & Price*)

Note*: In applicable scenarios
Step 3 - Data Sources
Primary Research
- Web Analytics
- Survey Reports
- Research Institute
- Latest Research Reports
- Opinion Leaders
Secondary Research
- Annual Reports
- White Paper
- Latest Press Release
- Industry Association
- Paid Database
- Investor Presentations

Step 4 - Data Triangulation
Involves using different sources of information in order to increase the validity of a study
These sources are likely to be stakeholders in a program - participants, other researchers, program staff, other community members, and so on.
Then we put all data in single framework & apply various statistical tools to find out the dynamic on the market.
During the analysis stage, feedback from the stakeholder groups would be compared to determine areas of agreement as well as areas of divergence