

Key Insights
The global food glycerin market is forecast to reach $2.9 billion by 2025, expanding at a CAGR of 5.9%. This growth is primarily attributed to the surging demand within the food and beverage sector. The increasing preference for processed foods, confectionery, and baked goods, where glycerin serves as a vital humectant, sweetener, and texturizer, is a key driver. Additionally, health-conscious consumers are increasingly opting for glycerin due to its natural and safe profile compared to artificial additives. Leading market participants, including Wilmar Oleochemicals, Cargill, and P&G Chemicals, are instrumental in shaping market dynamics through innovation and strategic collaborations. Potential challenges include raw material price volatility and evolving regulatory frameworks. Market segmentation is anticipated across product types (e.g., vegetable, animal glycerin), applications (e.g., confectionery, bakery, dairy), and geographical regions. Future expansion will likely emphasize sustainable sourcing and novel applications to meet growing consumer demand for natural and healthy food products.
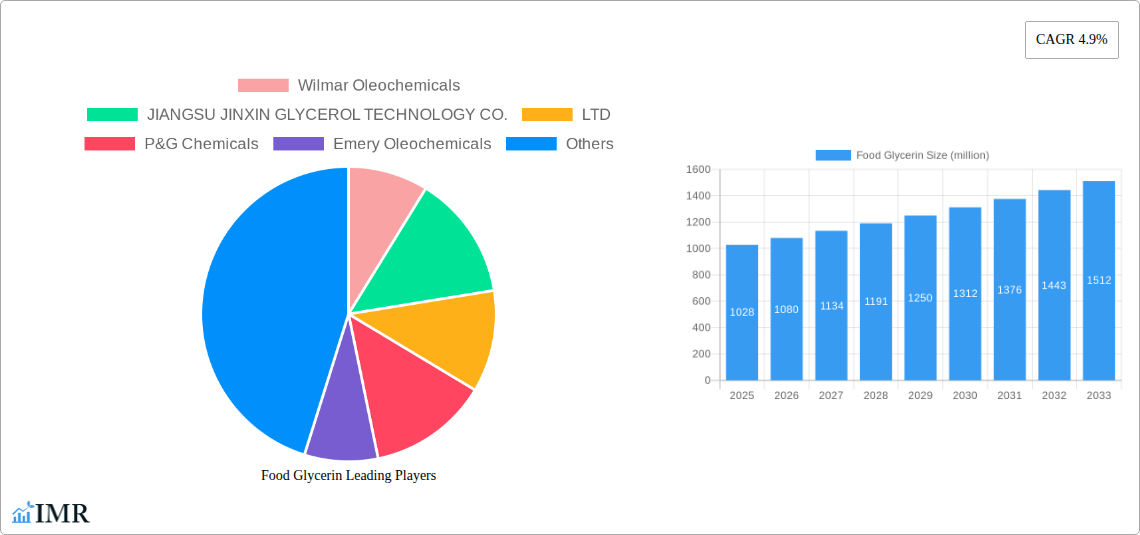
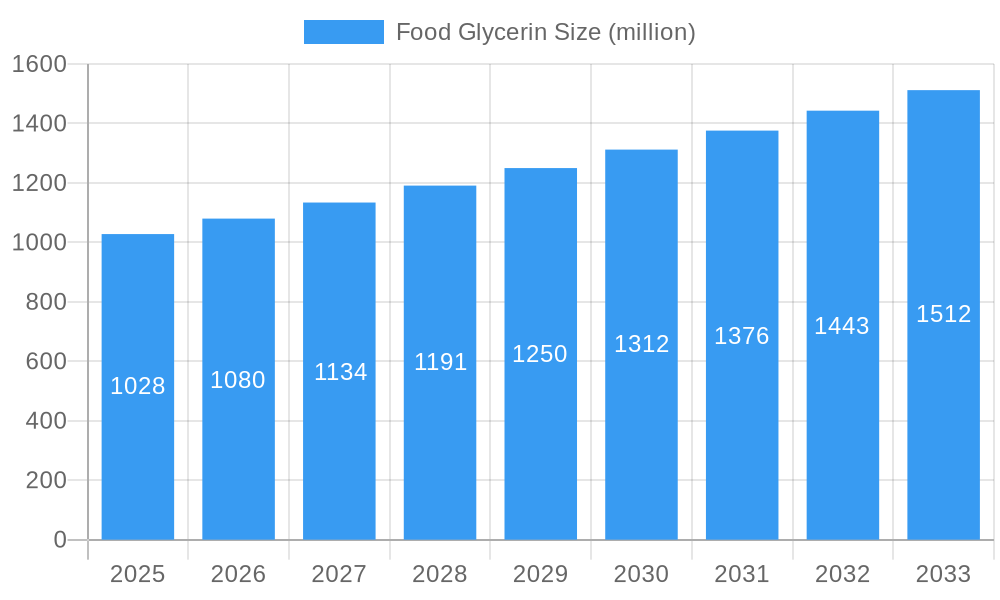
Food Glycerin Market Size (In Billion)
The competitive environment features a blend of established multinational corporations and agile specialized manufacturers. Key players maintain their market standing through robust distribution channels and advanced research and development. Emerging companies focusing on sustainable and niche glycerin products offer disruptive potential. Regional growth is influenced by variations in consumer preferences and regulatory standards, with areas exhibiting high processed food consumption and stringent food safety regulations expected to experience accelerated expansion. Further research should encompass detailed regional analysis, comprehensive market segmentation, and the impact of emerging technologies on food-grade glycerin production and application.
Food Glycerin Company Market Share
Food Glycerin Market Report: 2019-2033
This comprehensive report provides a detailed analysis of the global food glycerin market, encompassing market dynamics, growth trends, regional dominance, product landscape, challenges, opportunities, and key players. The study period spans from 2019 to 2033, with a base year of 2025 and a forecast period from 2025 to 2033. The historical period covered is 2019-2024. This report is invaluable for industry professionals, investors, and anyone seeking a deep understanding of this vital food ingredient market. The parent market is the overall glycerin market, and the child market focuses specifically on food applications. The market size values are presented in million units.
Food Glycerin Market Dynamics & Structure
The global food glycerin market is characterized by moderate concentration, with several major players holding significant market share. The market is driven by technological advancements in glycerin production, leading to higher purity and cost-effectiveness. Regulatory frameworks concerning food additives significantly influence market dynamics. Competitive substitutes, such as other humectants, exist, but food glycerin retains a strong position due to its versatile functionality and relatively low cost. The end-user demographics are broad, encompassing food and beverage manufacturers across various segments. M&A activity has been moderate in recent years, with xx deals recorded between 2019 and 2024, leading to some market consolidation.
- Market Concentration: Moderately concentrated, with top 5 players holding approximately xx% market share in 2024.
- Technological Innovation: Focus on sustainable production methods and improved purity levels. Innovation barriers include high capital investment and regulatory compliance.
- Regulatory Framework: Stringent food safety regulations impact production and labeling requirements. Variations across regions necessitate compliance strategies.
- Competitive Substitutes: Other humectants (e.g., sorbitol, propylene glycol) present competition, but glycerin retains advantages in cost and functionality.
- End-User Demographics: Diverse, including confectionery, bakery, dairy, and meat processing industries.
- M&A Trends: xx M&A deals between 2019 and 2024, indicating consolidation and strategic expansion among key players.
Food Glycerin Growth Trends & Insights
The global food glycerin market experienced steady growth from 2019 to 2024, with a CAGR of xx%. This growth is attributable to the increasing demand for processed foods, rising disposable incomes in developing economies, and the functional benefits of glycerin as a humectant, sweetener, and solvent in various food applications. Technological advancements in production have lowered costs, further fueling market expansion. Consumer preference for healthier and more convenient foods also plays a role, as glycerin contributes to improved texture and shelf life. Market penetration in developing regions remains high, indicating significant future growth potential. Disruptive technologies in this area are primarily focused on more efficient and sustainable production methods.
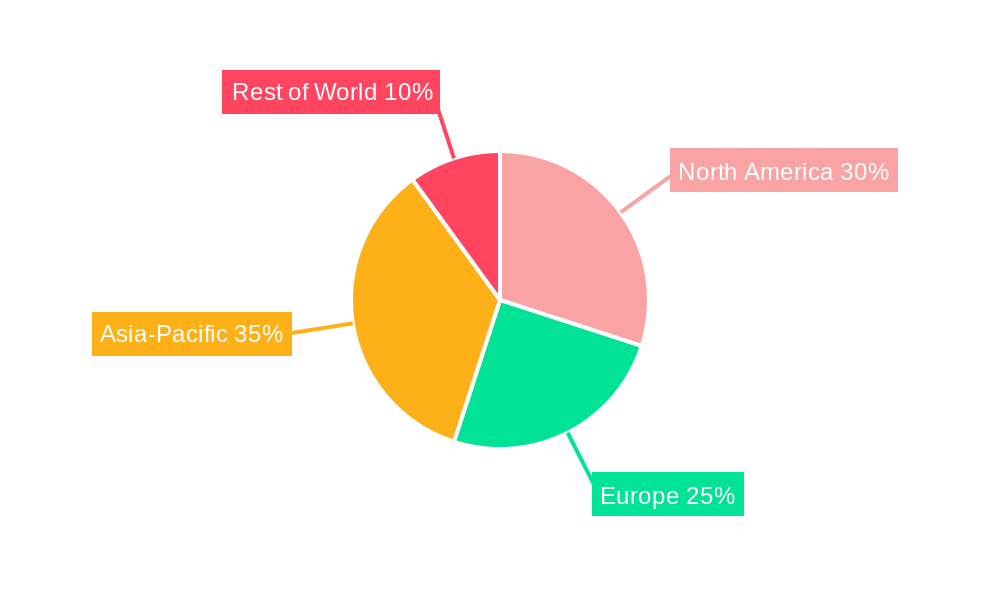
Dominant Regions, Countries, or Segments in Food Glycerin
The Asia-Pacific region dominated the food glycerin market in 2024, accounting for approximately xx% of the global market share. This dominance is primarily driven by strong economic growth, expanding food processing industries, and increasing consumption of processed foods in countries like China and India. Europe and North America also hold significant market shares, fueled by established food and beverage industries and strong regulatory frameworks.
- Key Drivers in Asia-Pacific: Rapid economic growth, increasing disposable incomes, and the expansion of the food processing sector.
- Dominance Factors: Large consumer base, significant production capacity, and lower production costs in some regions.
- Growth Potential: High growth potential in developing countries within the Asia-Pacific region and increasing demand in other regions.
Food Glycerin Product Landscape
Food-grade glycerin is available in various purities, impacting its application and price. Recent innovations focus on enhancing purity, reducing impurities, and developing sustainable production processes. The key applications are as a humectant, sweetener, and solvent in a wide array of food products, each with specific quality requirements. The USP (United States Pharmacopeia) grade is particularly important for food applications requiring high purity. Unique selling propositions often focus on origin (e.g., vegetable-based), purity, and sustainability certifications.
Key Drivers, Barriers & Challenges in Food Glycerin
Key Drivers:
- Growing demand for processed and convenient foods.
- Increasing use of glycerin as a natural alternative to artificial ingredients.
- Technological advancements lowering production costs.
Challenges:
- Fluctuations in raw material prices (e.g., vegetable oils).
- Stringent regulatory compliance requirements, varying by region.
- Competition from alternative humectants and sweeteners. The impact of these challenges on market growth is estimated at xx% reduction in projected growth by 2033.
Emerging Opportunities in Food Glycerin
- Growing demand for organic and sustainably produced food glycerin.
- Expansion into niche applications, such as functional foods and dietary supplements.
- Development of new glycerin-based food ingredients with enhanced functionality.
Growth Accelerators in the Food Glycerin Industry
The food glycerin market is poised for sustained growth driven by technological innovations focusing on enhanced efficiency and sustainability in production. Strategic partnerships between producers and food manufacturers are also accelerating market growth. Expansion into new geographic markets, particularly in developing economies with growing food processing sectors, represents another major growth accelerator.
Key Players Shaping the Food Glycerin Market
- Wilmar Oleochemicals
- JIANGSU JINXIN GLYCEROL TECHNOLOGY CO.,LTD
- P&G Chemicals
- Emery Oleochemicals
- Cargill
- Aemetis
- TGC
- Oleon
- KemX
- Sakamoto Yakuhin kogyo Co.,Ltd.
- Vance Bioenergy
- KLK OLEO
- Archer Daniels Midland
- Vantage Oleochemicals
- VVF
- PMC Biogenix
- Twin Rivers Technologies
- LDCAI
- Peter Cremer North America
- Owensboro Grain
Notable Milestones in Food Glycerin Sector
- 2021: Introduction of a new sustainable glycerin production process by a major player, reducing carbon footprint by xx%.
- 2022: Acquisition of a smaller glycerin producer by a larger multinational company, expanding market share.
- 2023: Launch of a new food-grade glycerin with enhanced purity and functionality by a leading manufacturer.
In-Depth Food Glycerin Market Outlook
The food glycerin market is poised for robust growth over the forecast period (2025-2033), driven by sustained demand from the food and beverage industry and continuous technological advancements. Strategic partnerships, expansion into new markets, and increasing focus on sustainability are key factors contributing to this positive outlook. The market is expected to reach xx million units by 2033, representing a significant opportunity for key players and new entrants alike.
Food Glycerin Segmentation
-
1. Application
- 1.1. Fruit Juice, Vinegar
- 1.2. Wine
- 1.3. Cured Products, Dried Meat, Sausages
- 1.4. Preserved Fruit
- 1.5. Others
-
2. Type
- 2.1. Natural
- 2.2. Synthetic
Food Glycerin Segmentation By Geography
-
1. North America
- 1.1. United States
- 1.2. Canada
- 1.3. Mexico
-
2. South America
- 2.1. Brazil
- 2.2. Argentina
- 2.3. Rest of South America
-
3. Europe
- 3.1. United Kingdom
- 3.2. Germany
- 3.3. France
- 3.4. Italy
- 3.5. Spain
- 3.6. Russia
- 3.7. Benelux
- 3.8. Nordics
- 3.9. Rest of Europe
-
4. Middle East & Africa
- 4.1. Turkey
- 4.2. Israel
- 4.3. GCC
- 4.4. North Africa
- 4.5. South Africa
- 4.6. Rest of Middle East & Africa
-
5. Asia Pacific
- 5.1. China
- 5.2. India
- 5.3. Japan
- 5.4. South Korea
- 5.5. ASEAN
- 5.6. Oceania
- 5.7. Rest of Asia Pacific
Food Glycerin Regional Market Share
Geographic Coverage of Food Glycerin
Food Glycerin REPORT HIGHLIGHTS
| Aspects | Details |
|---|---|
| Study Period | 2020-2034 |
| Base Year | 2025 |
| Estimated Year | 2026 |
| Forecast Period | 2026-2034 |
| Historical Period | 2020-2025 |
| Growth Rate | CAGR of 5.9% from 2020-2034 |
| Segmentation |
|
Table of Contents
- 1. Introduction
- 1.1. Research Scope
- 1.2. Market Segmentation
- 1.3. Research Methodology
- 1.4. Definitions and Assumptions
- 2. Executive Summary
- 2.1. Introduction
- 3. Market Dynamics
- 3.1. Introduction
- 3.2. Market Drivers
- 3.3. Market Restrains
- 3.4. Market Trends
- 4. Market Factor Analysis
- 4.1. Porters Five Forces
- 4.2. Supply/Value Chain
- 4.3. PESTEL analysis
- 4.4. Market Entropy
- 4.5. Patent/Trademark Analysis
- 5. Global Food Glycerin Analysis, Insights and Forecast, 2020-2032
- 5.1. Market Analysis, Insights and Forecast - by Application
- 5.1.1. Fruit Juice, Vinegar
- 5.1.2. Wine
- 5.1.3. Cured Products, Dried Meat, Sausages
- 5.1.4. Preserved Fruit
- 5.1.5. Others
- 5.2. Market Analysis, Insights and Forecast - by Type
- 5.2.1. Natural
- 5.2.2. Synthetic
- 5.3. Market Analysis, Insights and Forecast - by Region
- 5.3.1. North America
- 5.3.2. South America
- 5.3.3. Europe
- 5.3.4. Middle East & Africa
- 5.3.5. Asia Pacific
- 5.1. Market Analysis, Insights and Forecast - by Application
- 6. North America Food Glycerin Analysis, Insights and Forecast, 2020-2032
- 6.1. Market Analysis, Insights and Forecast - by Application
- 6.1.1. Fruit Juice, Vinegar
- 6.1.2. Wine
- 6.1.3. Cured Products, Dried Meat, Sausages
- 6.1.4. Preserved Fruit
- 6.1.5. Others
- 6.2. Market Analysis, Insights and Forecast - by Type
- 6.2.1. Natural
- 6.2.2. Synthetic
- 6.1. Market Analysis, Insights and Forecast - by Application
- 7. South America Food Glycerin Analysis, Insights and Forecast, 2020-2032
- 7.1. Market Analysis, Insights and Forecast - by Application
- 7.1.1. Fruit Juice, Vinegar
- 7.1.2. Wine
- 7.1.3. Cured Products, Dried Meat, Sausages
- 7.1.4. Preserved Fruit
- 7.1.5. Others
- 7.2. Market Analysis, Insights and Forecast - by Type
- 7.2.1. Natural
- 7.2.2. Synthetic
- 7.1. Market Analysis, Insights and Forecast - by Application
- 8. Europe Food Glycerin Analysis, Insights and Forecast, 2020-2032
- 8.1. Market Analysis, Insights and Forecast - by Application
- 8.1.1. Fruit Juice, Vinegar
- 8.1.2. Wine
- 8.1.3. Cured Products, Dried Meat, Sausages
- 8.1.4. Preserved Fruit
- 8.1.5. Others
- 8.2. Market Analysis, Insights and Forecast - by Type
- 8.2.1. Natural
- 8.2.2. Synthetic
- 8.1. Market Analysis, Insights and Forecast - by Application
- 9. Middle East & Africa Food Glycerin Analysis, Insights and Forecast, 2020-2032
- 9.1. Market Analysis, Insights and Forecast - by Application
- 9.1.1. Fruit Juice, Vinegar
- 9.1.2. Wine
- 9.1.3. Cured Products, Dried Meat, Sausages
- 9.1.4. Preserved Fruit
- 9.1.5. Others
- 9.2. Market Analysis, Insights and Forecast - by Type
- 9.2.1. Natural
- 9.2.2. Synthetic
- 9.1. Market Analysis, Insights and Forecast - by Application
- 10. Asia Pacific Food Glycerin Analysis, Insights and Forecast, 2020-2032
- 10.1. Market Analysis, Insights and Forecast - by Application
- 10.1.1. Fruit Juice, Vinegar
- 10.1.2. Wine
- 10.1.3. Cured Products, Dried Meat, Sausages
- 10.1.4. Preserved Fruit
- 10.1.5. Others
- 10.2. Market Analysis, Insights and Forecast - by Type
- 10.2.1. Natural
- 10.2.2. Synthetic
- 10.1. Market Analysis, Insights and Forecast - by Application
- 11. Competitive Analysis
- 11.1. Global Market Share Analysis 2025
- 11.2. Company Profiles
- 11.2.1 Wilmar Oleochemicals
- 11.2.1.1. Overview
- 11.2.1.2. Products
- 11.2.1.3. SWOT Analysis
- 11.2.1.4. Recent Developments
- 11.2.1.5. Financials (Based on Availability)
- 11.2.2 JIANGSU JINXIN GLYCEROL TECHNOLOGY CO.
- 11.2.2.1. Overview
- 11.2.2.2. Products
- 11.2.2.3. SWOT Analysis
- 11.2.2.4. Recent Developments
- 11.2.2.5. Financials (Based on Availability)
- 11.2.3 LTD
- 11.2.3.1. Overview
- 11.2.3.2. Products
- 11.2.3.3. SWOT Analysis
- 11.2.3.4. Recent Developments
- 11.2.3.5. Financials (Based on Availability)
- 11.2.4 P&G Chemicals
- 11.2.4.1. Overview
- 11.2.4.2. Products
- 11.2.4.3. SWOT Analysis
- 11.2.4.4. Recent Developments
- 11.2.4.5. Financials (Based on Availability)
- 11.2.5 Emery Oleochemicals
- 11.2.5.1. Overview
- 11.2.5.2. Products
- 11.2.5.3. SWOT Analysis
- 11.2.5.4. Recent Developments
- 11.2.5.5. Financials (Based on Availability)
- 11.2.6 Cargill
- 11.2.6.1. Overview
- 11.2.6.2. Products
- 11.2.6.3. SWOT Analysis
- 11.2.6.4. Recent Developments
- 11.2.6.5. Financials (Based on Availability)
- 11.2.7 Aemetis
- 11.2.7.1. Overview
- 11.2.7.2. Products
- 11.2.7.3. SWOT Analysis
- 11.2.7.4. Recent Developments
- 11.2.7.5. Financials (Based on Availability)
- 11.2.8 TGC
- 11.2.8.1. Overview
- 11.2.8.2. Products
- 11.2.8.3. SWOT Analysis
- 11.2.8.4. Recent Developments
- 11.2.8.5. Financials (Based on Availability)
- 11.2.9 Oleon
- 11.2.9.1. Overview
- 11.2.9.2. Products
- 11.2.9.3. SWOT Analysis
- 11.2.9.4. Recent Developments
- 11.2.9.5. Financials (Based on Availability)
- 11.2.10 KemX
- 11.2.10.1. Overview
- 11.2.10.2. Products
- 11.2.10.3. SWOT Analysis
- 11.2.10.4. Recent Developments
- 11.2.10.5. Financials (Based on Availability)
- 11.2.11 Sakamoto Yakuhin kogyo Co.
- 11.2.11.1. Overview
- 11.2.11.2. Products
- 11.2.11.3. SWOT Analysis
- 11.2.11.4. Recent Developments
- 11.2.11.5. Financials (Based on Availability)
- 11.2.12 Ltd.
- 11.2.12.1. Overview
- 11.2.12.2. Products
- 11.2.12.3. SWOT Analysis
- 11.2.12.4. Recent Developments
- 11.2.12.5. Financials (Based on Availability)
- 11.2.13 Vance Bioenergy
- 11.2.13.1. Overview
- 11.2.13.2. Products
- 11.2.13.3. SWOT Analysis
- 11.2.13.4. Recent Developments
- 11.2.13.5. Financials (Based on Availability)
- 11.2.14 KLK OLEO
- 11.2.14.1. Overview
- 11.2.14.2. Products
- 11.2.14.3. SWOT Analysis
- 11.2.14.4. Recent Developments
- 11.2.14.5. Financials (Based on Availability)
- 11.2.15 Archer Daniels Midland
- 11.2.15.1. Overview
- 11.2.15.2. Products
- 11.2.15.3. SWOT Analysis
- 11.2.15.4. Recent Developments
- 11.2.15.5. Financials (Based on Availability)
- 11.2.16 Vantage Oleochemicals
- 11.2.16.1. Overview
- 11.2.16.2. Products
- 11.2.16.3. SWOT Analysis
- 11.2.16.4. Recent Developments
- 11.2.16.5. Financials (Based on Availability)
- 11.2.17 VVF
- 11.2.17.1. Overview
- 11.2.17.2. Products
- 11.2.17.3. SWOT Analysis
- 11.2.17.4. Recent Developments
- 11.2.17.5. Financials (Based on Availability)
- 11.2.18 PMC Biogenix
- 11.2.18.1. Overview
- 11.2.18.2. Products
- 11.2.18.3. SWOT Analysis
- 11.2.18.4. Recent Developments
- 11.2.18.5. Financials (Based on Availability)
- 11.2.19 Twin Rivers Technologies
- 11.2.19.1. Overview
- 11.2.19.2. Products
- 11.2.19.3. SWOT Analysis
- 11.2.19.4. Recent Developments
- 11.2.19.5. Financials (Based on Availability)
- 11.2.20 LDCAI
- 11.2.20.1. Overview
- 11.2.20.2. Products
- 11.2.20.3. SWOT Analysis
- 11.2.20.4. Recent Developments
- 11.2.20.5. Financials (Based on Availability)
- 11.2.21 Peter Cremer North America
- 11.2.21.1. Overview
- 11.2.21.2. Products
- 11.2.21.3. SWOT Analysis
- 11.2.21.4. Recent Developments
- 11.2.21.5. Financials (Based on Availability)
- 11.2.22 Owensboro Grain
- 11.2.22.1. Overview
- 11.2.22.2. Products
- 11.2.22.3. SWOT Analysis
- 11.2.22.4. Recent Developments
- 11.2.22.5. Financials (Based on Availability)
- 11.2.1 Wilmar Oleochemicals
List of Figures
- Figure 1: Global Food Glycerin Revenue Breakdown (billion, %) by Region 2025 & 2033
- Figure 2: Global Food Glycerin Volume Breakdown (K, %) by Region 2025 & 2033
- Figure 3: North America Food Glycerin Revenue (billion), by Application 2025 & 2033
- Figure 4: North America Food Glycerin Volume (K), by Application 2025 & 2033
- Figure 5: North America Food Glycerin Revenue Share (%), by Application 2025 & 2033
- Figure 6: North America Food Glycerin Volume Share (%), by Application 2025 & 2033
- Figure 7: North America Food Glycerin Revenue (billion), by Type 2025 & 2033
- Figure 8: North America Food Glycerin Volume (K), by Type 2025 & 2033
- Figure 9: North America Food Glycerin Revenue Share (%), by Type 2025 & 2033
- Figure 10: North America Food Glycerin Volume Share (%), by Type 2025 & 2033
- Figure 11: North America Food Glycerin Revenue (billion), by Country 2025 & 2033
- Figure 12: North America Food Glycerin Volume (K), by Country 2025 & 2033
- Figure 13: North America Food Glycerin Revenue Share (%), by Country 2025 & 2033
- Figure 14: North America Food Glycerin Volume Share (%), by Country 2025 & 2033
- Figure 15: South America Food Glycerin Revenue (billion), by Application 2025 & 2033
- Figure 16: South America Food Glycerin Volume (K), by Application 2025 & 2033
- Figure 17: South America Food Glycerin Revenue Share (%), by Application 2025 & 2033
- Figure 18: South America Food Glycerin Volume Share (%), by Application 2025 & 2033
- Figure 19: South America Food Glycerin Revenue (billion), by Type 2025 & 2033
- Figure 20: South America Food Glycerin Volume (K), by Type 2025 & 2033
- Figure 21: South America Food Glycerin Revenue Share (%), by Type 2025 & 2033
- Figure 22: South America Food Glycerin Volume Share (%), by Type 2025 & 2033
- Figure 23: South America Food Glycerin Revenue (billion), by Country 2025 & 2033
- Figure 24: South America Food Glycerin Volume (K), by Country 2025 & 2033
- Figure 25: South America Food Glycerin Revenue Share (%), by Country 2025 & 2033
- Figure 26: South America Food Glycerin Volume Share (%), by Country 2025 & 2033
- Figure 27: Europe Food Glycerin Revenue (billion), by Application 2025 & 2033
- Figure 28: Europe Food Glycerin Volume (K), by Application 2025 & 2033
- Figure 29: Europe Food Glycerin Revenue Share (%), by Application 2025 & 2033
- Figure 30: Europe Food Glycerin Volume Share (%), by Application 2025 & 2033
- Figure 31: Europe Food Glycerin Revenue (billion), by Type 2025 & 2033
- Figure 32: Europe Food Glycerin Volume (K), by Type 2025 & 2033
- Figure 33: Europe Food Glycerin Revenue Share (%), by Type 2025 & 2033
- Figure 34: Europe Food Glycerin Volume Share (%), by Type 2025 & 2033
- Figure 35: Europe Food Glycerin Revenue (billion), by Country 2025 & 2033
- Figure 36: Europe Food Glycerin Volume (K), by Country 2025 & 2033
- Figure 37: Europe Food Glycerin Revenue Share (%), by Country 2025 & 2033
- Figure 38: Europe Food Glycerin Volume Share (%), by Country 2025 & 2033
- Figure 39: Middle East & Africa Food Glycerin Revenue (billion), by Application 2025 & 2033
- Figure 40: Middle East & Africa Food Glycerin Volume (K), by Application 2025 & 2033
- Figure 41: Middle East & Africa Food Glycerin Revenue Share (%), by Application 2025 & 2033
- Figure 42: Middle East & Africa Food Glycerin Volume Share (%), by Application 2025 & 2033
- Figure 43: Middle East & Africa Food Glycerin Revenue (billion), by Type 2025 & 2033
- Figure 44: Middle East & Africa Food Glycerin Volume (K), by Type 2025 & 2033
- Figure 45: Middle East & Africa Food Glycerin Revenue Share (%), by Type 2025 & 2033
- Figure 46: Middle East & Africa Food Glycerin Volume Share (%), by Type 2025 & 2033
- Figure 47: Middle East & Africa Food Glycerin Revenue (billion), by Country 2025 & 2033
- Figure 48: Middle East & Africa Food Glycerin Volume (K), by Country 2025 & 2033
- Figure 49: Middle East & Africa Food Glycerin Revenue Share (%), by Country 2025 & 2033
- Figure 50: Middle East & Africa Food Glycerin Volume Share (%), by Country 2025 & 2033
- Figure 51: Asia Pacific Food Glycerin Revenue (billion), by Application 2025 & 2033
- Figure 52: Asia Pacific Food Glycerin Volume (K), by Application 2025 & 2033
- Figure 53: Asia Pacific Food Glycerin Revenue Share (%), by Application 2025 & 2033
- Figure 54: Asia Pacific Food Glycerin Volume Share (%), by Application 2025 & 2033
- Figure 55: Asia Pacific Food Glycerin Revenue (billion), by Type 2025 & 2033
- Figure 56: Asia Pacific Food Glycerin Volume (K), by Type 2025 & 2033
- Figure 57: Asia Pacific Food Glycerin Revenue Share (%), by Type 2025 & 2033
- Figure 58: Asia Pacific Food Glycerin Volume Share (%), by Type 2025 & 2033
- Figure 59: Asia Pacific Food Glycerin Revenue (billion), by Country 2025 & 2033
- Figure 60: Asia Pacific Food Glycerin Volume (K), by Country 2025 & 2033
- Figure 61: Asia Pacific Food Glycerin Revenue Share (%), by Country 2025 & 2033
- Figure 62: Asia Pacific Food Glycerin Volume Share (%), by Country 2025 & 2033
List of Tables
- Table 1: Global Food Glycerin Revenue billion Forecast, by Application 2020 & 2033
- Table 2: Global Food Glycerin Volume K Forecast, by Application 2020 & 2033
- Table 3: Global Food Glycerin Revenue billion Forecast, by Type 2020 & 2033
- Table 4: Global Food Glycerin Volume K Forecast, by Type 2020 & 2033
- Table 5: Global Food Glycerin Revenue billion Forecast, by Region 2020 & 2033
- Table 6: Global Food Glycerin Volume K Forecast, by Region 2020 & 2033
- Table 7: Global Food Glycerin Revenue billion Forecast, by Application 2020 & 2033
- Table 8: Global Food Glycerin Volume K Forecast, by Application 2020 & 2033
- Table 9: Global Food Glycerin Revenue billion Forecast, by Type 2020 & 2033
- Table 10: Global Food Glycerin Volume K Forecast, by Type 2020 & 2033
- Table 11: Global Food Glycerin Revenue billion Forecast, by Country 2020 & 2033
- Table 12: Global Food Glycerin Volume K Forecast, by Country 2020 & 2033
- Table 13: United States Food Glycerin Revenue (billion) Forecast, by Application 2020 & 2033
- Table 14: United States Food Glycerin Volume (K) Forecast, by Application 2020 & 2033
- Table 15: Canada Food Glycerin Revenue (billion) Forecast, by Application 2020 & 2033
- Table 16: Canada Food Glycerin Volume (K) Forecast, by Application 2020 & 2033
- Table 17: Mexico Food Glycerin Revenue (billion) Forecast, by Application 2020 & 2033
- Table 18: Mexico Food Glycerin Volume (K) Forecast, by Application 2020 & 2033
- Table 19: Global Food Glycerin Revenue billion Forecast, by Application 2020 & 2033
- Table 20: Global Food Glycerin Volume K Forecast, by Application 2020 & 2033
- Table 21: Global Food Glycerin Revenue billion Forecast, by Type 2020 & 2033
- Table 22: Global Food Glycerin Volume K Forecast, by Type 2020 & 2033
- Table 23: Global Food Glycerin Revenue billion Forecast, by Country 2020 & 2033
- Table 24: Global Food Glycerin Volume K Forecast, by Country 2020 & 2033
- Table 25: Brazil Food Glycerin Revenue (billion) Forecast, by Application 2020 & 2033
- Table 26: Brazil Food Glycerin Volume (K) Forecast, by Application 2020 & 2033
- Table 27: Argentina Food Glycerin Revenue (billion) Forecast, by Application 2020 & 2033
- Table 28: Argentina Food Glycerin Volume (K) Forecast, by Application 2020 & 2033
- Table 29: Rest of South America Food Glycerin Revenue (billion) Forecast, by Application 2020 & 2033
- Table 30: Rest of South America Food Glycerin Volume (K) Forecast, by Application 2020 & 2033
- Table 31: Global Food Glycerin Revenue billion Forecast, by Application 2020 & 2033
- Table 32: Global Food Glycerin Volume K Forecast, by Application 2020 & 2033
- Table 33: Global Food Glycerin Revenue billion Forecast, by Type 2020 & 2033
- Table 34: Global Food Glycerin Volume K Forecast, by Type 2020 & 2033
- Table 35: Global Food Glycerin Revenue billion Forecast, by Country 2020 & 2033
- Table 36: Global Food Glycerin Volume K Forecast, by Country 2020 & 2033
- Table 37: United Kingdom Food Glycerin Revenue (billion) Forecast, by Application 2020 & 2033
- Table 38: United Kingdom Food Glycerin Volume (K) Forecast, by Application 2020 & 2033
- Table 39: Germany Food Glycerin Revenue (billion) Forecast, by Application 2020 & 2033
- Table 40: Germany Food Glycerin Volume (K) Forecast, by Application 2020 & 2033
- Table 41: France Food Glycerin Revenue (billion) Forecast, by Application 2020 & 2033
- Table 42: France Food Glycerin Volume (K) Forecast, by Application 2020 & 2033
- Table 43: Italy Food Glycerin Revenue (billion) Forecast, by Application 2020 & 2033
- Table 44: Italy Food Glycerin Volume (K) Forecast, by Application 2020 & 2033
- Table 45: Spain Food Glycerin Revenue (billion) Forecast, by Application 2020 & 2033
- Table 46: Spain Food Glycerin Volume (K) Forecast, by Application 2020 & 2033
- Table 47: Russia Food Glycerin Revenue (billion) Forecast, by Application 2020 & 2033
- Table 48: Russia Food Glycerin Volume (K) Forecast, by Application 2020 & 2033
- Table 49: Benelux Food Glycerin Revenue (billion) Forecast, by Application 2020 & 2033
- Table 50: Benelux Food Glycerin Volume (K) Forecast, by Application 2020 & 2033
- Table 51: Nordics Food Glycerin Revenue (billion) Forecast, by Application 2020 & 2033
- Table 52: Nordics Food Glycerin Volume (K) Forecast, by Application 2020 & 2033
- Table 53: Rest of Europe Food Glycerin Revenue (billion) Forecast, by Application 2020 & 2033
- Table 54: Rest of Europe Food Glycerin Volume (K) Forecast, by Application 2020 & 2033
- Table 55: Global Food Glycerin Revenue billion Forecast, by Application 2020 & 2033
- Table 56: Global Food Glycerin Volume K Forecast, by Application 2020 & 2033
- Table 57: Global Food Glycerin Revenue billion Forecast, by Type 2020 & 2033
- Table 58: Global Food Glycerin Volume K Forecast, by Type 2020 & 2033
- Table 59: Global Food Glycerin Revenue billion Forecast, by Country 2020 & 2033
- Table 60: Global Food Glycerin Volume K Forecast, by Country 2020 & 2033
- Table 61: Turkey Food Glycerin Revenue (billion) Forecast, by Application 2020 & 2033
- Table 62: Turkey Food Glycerin Volume (K) Forecast, by Application 2020 & 2033
- Table 63: Israel Food Glycerin Revenue (billion) Forecast, by Application 2020 & 2033
- Table 64: Israel Food Glycerin Volume (K) Forecast, by Application 2020 & 2033
- Table 65: GCC Food Glycerin Revenue (billion) Forecast, by Application 2020 & 2033
- Table 66: GCC Food Glycerin Volume (K) Forecast, by Application 2020 & 2033
- Table 67: North Africa Food Glycerin Revenue (billion) Forecast, by Application 2020 & 2033
- Table 68: North Africa Food Glycerin Volume (K) Forecast, by Application 2020 & 2033
- Table 69: South Africa Food Glycerin Revenue (billion) Forecast, by Application 2020 & 2033
- Table 70: South Africa Food Glycerin Volume (K) Forecast, by Application 2020 & 2033
- Table 71: Rest of Middle East & Africa Food Glycerin Revenue (billion) Forecast, by Application 2020 & 2033
- Table 72: Rest of Middle East & Africa Food Glycerin Volume (K) Forecast, by Application 2020 & 2033
- Table 73: Global Food Glycerin Revenue billion Forecast, by Application 2020 & 2033
- Table 74: Global Food Glycerin Volume K Forecast, by Application 2020 & 2033
- Table 75: Global Food Glycerin Revenue billion Forecast, by Type 2020 & 2033
- Table 76: Global Food Glycerin Volume K Forecast, by Type 2020 & 2033
- Table 77: Global Food Glycerin Revenue billion Forecast, by Country 2020 & 2033
- Table 78: Global Food Glycerin Volume K Forecast, by Country 2020 & 2033
- Table 79: China Food Glycerin Revenue (billion) Forecast, by Application 2020 & 2033
- Table 80: China Food Glycerin Volume (K) Forecast, by Application 2020 & 2033
- Table 81: India Food Glycerin Revenue (billion) Forecast, by Application 2020 & 2033
- Table 82: India Food Glycerin Volume (K) Forecast, by Application 2020 & 2033
- Table 83: Japan Food Glycerin Revenue (billion) Forecast, by Application 2020 & 2033
- Table 84: Japan Food Glycerin Volume (K) Forecast, by Application 2020 & 2033
- Table 85: South Korea Food Glycerin Revenue (billion) Forecast, by Application 2020 & 2033
- Table 86: South Korea Food Glycerin Volume (K) Forecast, by Application 2020 & 2033
- Table 87: ASEAN Food Glycerin Revenue (billion) Forecast, by Application 2020 & 2033
- Table 88: ASEAN Food Glycerin Volume (K) Forecast, by Application 2020 & 2033
- Table 89: Oceania Food Glycerin Revenue (billion) Forecast, by Application 2020 & 2033
- Table 90: Oceania Food Glycerin Volume (K) Forecast, by Application 2020 & 2033
- Table 91: Rest of Asia Pacific Food Glycerin Revenue (billion) Forecast, by Application 2020 & 2033
- Table 92: Rest of Asia Pacific Food Glycerin Volume (K) Forecast, by Application 2020 & 2033
Frequently Asked Questions
1. What is the projected Compound Annual Growth Rate (CAGR) of the Food Glycerin?
The projected CAGR is approximately 5.9%.
2. Which companies are prominent players in the Food Glycerin?
Key companies in the market include Wilmar Oleochemicals, JIANGSU JINXIN GLYCEROL TECHNOLOGY CO., LTD, P&G Chemicals, Emery Oleochemicals, Cargill, Aemetis, TGC, Oleon, KemX, Sakamoto Yakuhin kogyo Co., Ltd., Vance Bioenergy, KLK OLEO, Archer Daniels Midland, Vantage Oleochemicals, VVF, PMC Biogenix, Twin Rivers Technologies, LDCAI, Peter Cremer North America, Owensboro Grain.
3. What are the main segments of the Food Glycerin?
The market segments include Application, Type.
4. Can you provide details about the market size?
The market size is estimated to be USD 2.9 billion as of 2022.
5. What are some drivers contributing to market growth?
N/A
6. What are the notable trends driving market growth?
N/A
7. Are there any restraints impacting market growth?
N/A
8. Can you provide examples of recent developments in the market?
N/A
9. What pricing options are available for accessing the report?
Pricing options include single-user, multi-user, and enterprise licenses priced at USD 3950.00, USD 5925.00, and USD 7900.00 respectively.
10. Is the market size provided in terms of value or volume?
The market size is provided in terms of value, measured in billion and volume, measured in K.
11. Are there any specific market keywords associated with the report?
Yes, the market keyword associated with the report is "Food Glycerin," which aids in identifying and referencing the specific market segment covered.
12. How do I determine which pricing option suits my needs best?
The pricing options vary based on user requirements and access needs. Individual users may opt for single-user licenses, while businesses requiring broader access may choose multi-user or enterprise licenses for cost-effective access to the report.
13. Are there any additional resources or data provided in the Food Glycerin report?
While the report offers comprehensive insights, it's advisable to review the specific contents or supplementary materials provided to ascertain if additional resources or data are available.
14. How can I stay updated on further developments or reports in the Food Glycerin?
To stay informed about further developments, trends, and reports in the Food Glycerin, consider subscribing to industry newsletters, following relevant companies and organizations, or regularly checking reputable industry news sources and publications.
Methodology
Step 1 - Identification of Relevant Samples Size from Population Database


Step 2 - Approaches for Defining Global Market Size (Value, Volume* & Price*)

Note*: In applicable scenarios
Step 3 - Data Sources
Primary Research
- Web Analytics
- Survey Reports
- Research Institute
- Latest Research Reports
- Opinion Leaders
Secondary Research
- Annual Reports
- White Paper
- Latest Press Release
- Industry Association
- Paid Database
- Investor Presentations

Step 4 - Data Triangulation
Involves using different sources of information in order to increase the validity of a study
These sources are likely to be stakeholders in a program - participants, other researchers, program staff, other community members, and so on.
Then we put all data in single framework & apply various statistical tools to find out the dynamic on the market.
During the analysis stage, feedback from the stakeholder groups would be compared to determine areas of agreement as well as areas of divergence