

Key Insights
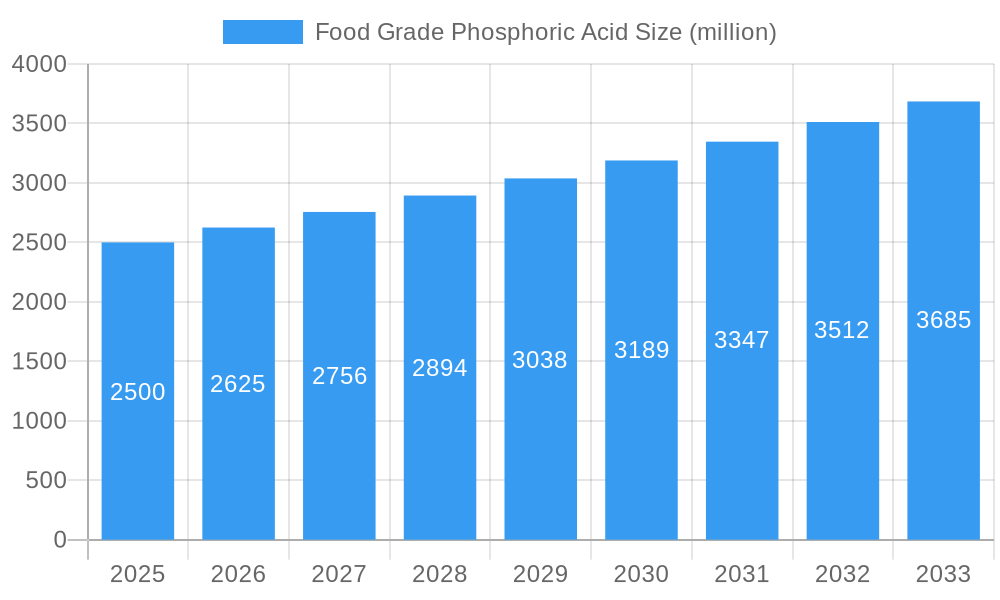
The global food grade phosphoric acid market is projected for substantial growth, driven by escalating demand within the food and beverage sector. This expansion is attributable to its widespread application as a crucial food additive, serving as an acidity regulator, flavor enhancer, and chelating agent across a diverse range of processed foods, beverages, and dietary supplements. The market is anticipated to experience a Compound Annual Growth Rate (CAGR) of 3.4% from a base year of 2025, reaching a market size of 2.58 billion by the end of the forecast period. This upward trajectory is further supported by a growing global population and an increased consumption of processed food products, particularly in emerging economies. Leading industry players, including The Mosaic Company, Nutrien, and ICL Food Specialties, are at the forefront of innovation, strategically expanding their product offerings to address this rising demand. Despite potential challenges from fluctuating raw material costs and evolving regulatory landscapes, the market's resilience is underpinned by the essential function of phosphoric acid in food processing.
Food Grade Phosphoric Acid Market Size (In Billion)
Market segmentation highlights significant opportunities across various applications. The soft drink segment remains a dominant consumer, while a growing consumer preference for healthier food alternatives is expected to spur demand in segments such as bakery products and dairy alternatives. Regional consumption patterns and regulatory frameworks significantly influence market dynamics. North America and Europe are expected to retain substantial market shares due to their mature and sophisticated food processing industries. Conversely, the Asia-Pacific region is poised for considerable growth, propelled by rapid economic development and evolving dietary habits. Competitive landscapes feature a blend of established multinational corporations and agile regional enterprises, fostering both innovation and competitive pricing. Future market developments are likely to be shaped by advancements in food processing technologies and a growing emphasis on sustainable production methodologies.
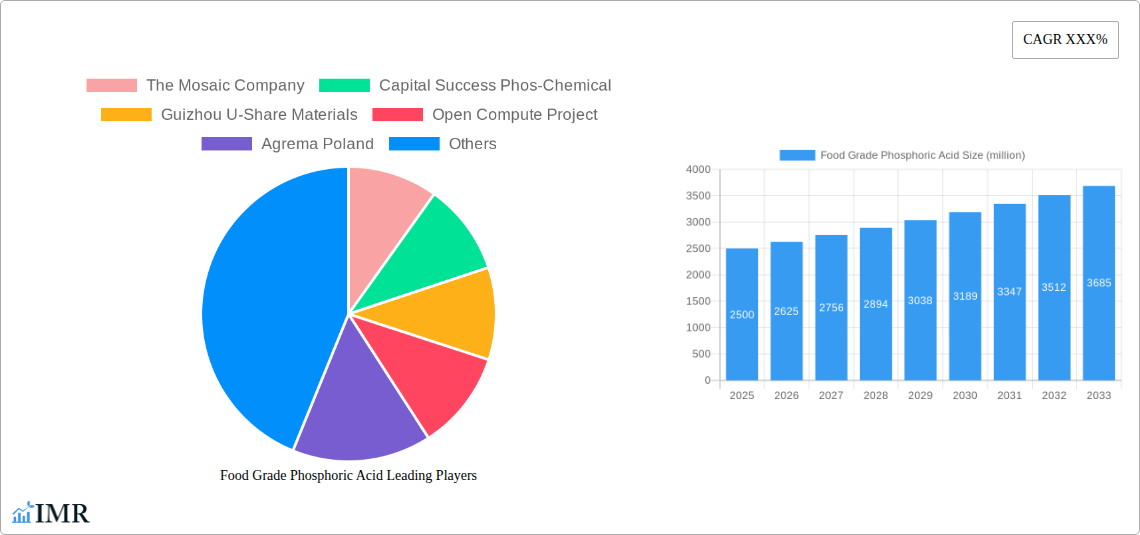
Food Grade Phosphoric Acid Company Market Share
Food Grade Phosphoric Acid Market Report: 2019-2033
This comprehensive report provides an in-depth analysis of the Food Grade Phosphoric Acid market, encompassing market dynamics, growth trends, regional dominance, product landscape, key players, and future outlook. The study period covers 2019-2033, with 2025 serving as the base and estimated year. The forecast period spans 2025-2033, and the historical period encompasses 2019-2024. This report is an essential resource for industry professionals, investors, and stakeholders seeking a detailed understanding of this vital segment within the broader phosphoric acid and food additive markets. The market size is projected to reach xx million units by 2033.
Food Grade Phosphoric Acid Market Dynamics & Structure
The food grade phosphoric acid market is characterized by moderate concentration, with key players holding significant market share. Technological innovation, driven by the demand for higher purity and efficiency in production, is a major factor. Stringent regulatory frameworks concerning food safety and environmental impact significantly influence market operations. Competitive pressure from substitute acids, such as citric acid, necessitates continuous product improvement. End-user demographics, particularly in the food and beverage industry, shape demand patterns. M&A activity has been relatively consistent, with xx deals recorded between 2019 and 2024, primarily focused on expanding production capacity and geographic reach.
- Market Concentration: Moderately concentrated, with top 5 players holding approximately 65% market share in 2024.
- Technological Innovation: Focus on improving purity, reducing production costs, and enhancing sustainability.
- Regulatory Framework: Stringent regulations regarding food safety and environmental impact are key drivers of market dynamics.
- Competitive Substitutes: Citric acid and other food-grade acids present competitive pressure.
- M&A Activity: xx deals recorded between 2019 and 2024, primarily focused on capacity expansion and market reach.
- Innovation Barriers: High initial investment costs and stringent regulatory approvals hinder rapid innovation.
Food Grade Phosphoric Acid Growth Trends & Insights
The food grade phosphoric acid market has experienced steady growth throughout the historical period (2019-2024), with a CAGR of xx%. This growth is primarily fueled by increasing demand from the food and beverage industry, particularly in processed foods and beverages. Technological advancements in production and purification processes have enhanced product quality and reduced costs, further boosting market adoption. Consumer preference for convenient and processed foods contributes significantly to market expansion. However, growing health consciousness and concerns regarding potential health effects of excessive phosphoric acid consumption present a challenge. Market penetration is currently at xx% and is projected to reach xx% by 2033. Technological disruptions, such as the adoption of more sustainable production methods, are expected to further shape market dynamics.
Dominant Regions, Countries, or Segments in Food Grade Phosphoric Acid
The North American region currently holds the largest market share for food grade phosphoric acid, driven by robust demand from the food processing industry and strong regulatory frameworks supporting the sector. China and other parts of Asia are experiencing rapid growth due to rising consumption of processed foods and beverages. Within the segment breakdown, the soft drinks segment dominates, followed by processed meat and dairy products.
- Key Drivers in North America: Strong food processing industry, established regulatory framework, and high consumer demand.
- Key Drivers in Asia: Rising disposable incomes, increased consumption of processed foods, and rapid economic growth.
- Dominant Segment: Soft drinks, followed by processed meat and dairy products.
- Market Share: North America holds approximately xx% of the global market share in 2024, projected to xx% by 2033.
Food Grade Phosphoric Acid Product Landscape
Food grade phosphoric acid is primarily offered in liquid form with varying concentrations, tailored to specific applications. Recent innovations focus on enhanced purity, reduced impurities, and improved handling characteristics. Key selling propositions include consistent quality, traceability, and compliance with stringent food safety standards. Technological advancements include improved purification processes leading to higher-purity products.
Key Drivers, Barriers & Challenges in Food Grade Phosphoric Acid
Key Drivers:
- Rising demand for processed foods and beverages.
- Technological advancements in production and purification.
- Increasing use in food applications requiring acidity regulation.
Challenges & Restraints:
- Fluctuations in raw material prices (phosphate rock).
- Stringent environmental regulations.
- Competition from substitute acids.
- Supply chain disruptions could impact availability and pricing. The impact is estimated at xx million units annually.
Emerging Opportunities in Food Grade Phosphoric Acid
Emerging markets in developing economies present significant opportunities for growth. The rising demand for convenient and shelf-stable foods fuels the growth potential. New applications in the functional food and beverage segments are also driving market expansion.
Growth Accelerators in the Food Grade Phosphoric Acid Industry
Technological advancements in production processes, enhancing efficiency and sustainability, are significant growth catalysts. Strategic partnerships and collaborations between producers and food companies are strengthening the supply chain and driving innovation. Expansion into new geographical markets, especially in developing economies, presents further growth opportunities.
Key Players Shaping the Food Grade Phosphoric Acid Market
- The Mosaic Company
- Capital Success Phos-Chemical
- Guizhou U-Share Materials
- Open Compute Project
- Agrema Poland
- Nutrien
- Yuntianhua International Chemical
- ICL Food Specialties
- Israel Chemicals
- Wengfu
Notable Milestones in Food Grade Phosphoric Acid Sector
- 2021: ICL Food Specialties launched a new high-purity food grade phosphoric acid.
- 2022: The Mosaic Company invested in expanding its production capacity.
- 2023: New regulations concerning food-grade phosphoric acid were implemented in the European Union.
In-Depth Food Grade Phosphoric Acid Market Outlook
The food grade phosphoric acid market is poised for continued growth, driven by consistent demand from the food and beverage sector, technological advancements, and expansion into new markets. Strategic investments in production capacity and research and development will shape future market dynamics. Opportunities exist in developing sustainable and cost-effective production methods, as well as in exploring new applications in functional foods and beverages. The market is projected to reach xx million units by 2033.
Food Grade Phosphoric Acid Segmentation
-
1. Application
- 1.1. Food Additive
- 1.2. Fragrances
- 1.3. Beverage industry
- 1.4. Bakery
- 1.5. Other
-
2. Type
- 2.1. 85% Content
- 2.2. 75% Content
- 2.3. Other
Food Grade Phosphoric Acid Segmentation By Geography
-
1. North America
- 1.1. United States
- 1.2. Canada
- 1.3. Mexico
-
2. South America
- 2.1. Brazil
- 2.2. Argentina
- 2.3. Rest of South America
-
3. Europe
- 3.1. United Kingdom
- 3.2. Germany
- 3.3. France
- 3.4. Italy
- 3.5. Spain
- 3.6. Russia
- 3.7. Benelux
- 3.8. Nordics
- 3.9. Rest of Europe
-
4. Middle East & Africa
- 4.1. Turkey
- 4.2. Israel
- 4.3. GCC
- 4.4. North Africa
- 4.5. South Africa
- 4.6. Rest of Middle East & Africa
-
5. Asia Pacific
- 5.1. China
- 5.2. India
- 5.3. Japan
- 5.4. South Korea
- 5.5. ASEAN
- 5.6. Oceania
- 5.7. Rest of Asia Pacific

Food Grade Phosphoric Acid Regional Market Share
Geographic Coverage of Food Grade Phosphoric Acid
Food Grade Phosphoric Acid REPORT HIGHLIGHTS
| Aspects | Details |
|---|---|
| Study Period | 2020-2034 |
| Base Year | 2025 |
| Estimated Year | 2026 |
| Forecast Period | 2026-2034 |
| Historical Period | 2020-2025 |
| Growth Rate | CAGR of 3.4% from 2020-2034 |
| Segmentation |
|
Table of Contents
- 1. Introduction
- 1.1. Research Scope
- 1.2. Market Segmentation
- 1.3. Research Methodology
- 1.4. Definitions and Assumptions
- 2. Executive Summary
- 2.1. Introduction
- 3. Market Dynamics
- 3.1. Introduction
- 3.2. Market Drivers
- 3.3. Market Restrains
- 3.4. Market Trends
- 4. Market Factor Analysis
- 4.1. Porters Five Forces
- 4.2. Supply/Value Chain
- 4.3. PESTEL analysis
- 4.4. Market Entropy
- 4.5. Patent/Trademark Analysis
- 5. Global Food Grade Phosphoric Acid Analysis, Insights and Forecast, 2020-2032
- 5.1. Market Analysis, Insights and Forecast - by Application
- 5.1.1. Food Additive
- 5.1.2. Fragrances
- 5.1.3. Beverage industry
- 5.1.4. Bakery
- 5.1.5. Other
- 5.2. Market Analysis, Insights and Forecast - by Type
- 5.2.1. 85% Content
- 5.2.2. 75% Content
- 5.2.3. Other
- 5.3. Market Analysis, Insights and Forecast - by Region
- 5.3.1. North America
- 5.3.2. South America
- 5.3.3. Europe
- 5.3.4. Middle East & Africa
- 5.3.5. Asia Pacific
- 5.1. Market Analysis, Insights and Forecast - by Application
- 6. North America Food Grade Phosphoric Acid Analysis, Insights and Forecast, 2020-2032
- 6.1. Market Analysis, Insights and Forecast - by Application
- 6.1.1. Food Additive
- 6.1.2. Fragrances
- 6.1.3. Beverage industry
- 6.1.4. Bakery
- 6.1.5. Other
- 6.2. Market Analysis, Insights and Forecast - by Type
- 6.2.1. 85% Content
- 6.2.2. 75% Content
- 6.2.3. Other
- 6.1. Market Analysis, Insights and Forecast - by Application
- 7. South America Food Grade Phosphoric Acid Analysis, Insights and Forecast, 2020-2032
- 7.1. Market Analysis, Insights and Forecast - by Application
- 7.1.1. Food Additive
- 7.1.2. Fragrances
- 7.1.3. Beverage industry
- 7.1.4. Bakery
- 7.1.5. Other
- 7.2. Market Analysis, Insights and Forecast - by Type
- 7.2.1. 85% Content
- 7.2.2. 75% Content
- 7.2.3. Other
- 7.1. Market Analysis, Insights and Forecast - by Application
- 8. Europe Food Grade Phosphoric Acid Analysis, Insights and Forecast, 2020-2032
- 8.1. Market Analysis, Insights and Forecast - by Application
- 8.1.1. Food Additive
- 8.1.2. Fragrances
- 8.1.3. Beverage industry
- 8.1.4. Bakery
- 8.1.5. Other
- 8.2. Market Analysis, Insights and Forecast - by Type
- 8.2.1. 85% Content
- 8.2.2. 75% Content
- 8.2.3. Other
- 8.1. Market Analysis, Insights and Forecast - by Application
- 9. Middle East & Africa Food Grade Phosphoric Acid Analysis, Insights and Forecast, 2020-2032
- 9.1. Market Analysis, Insights and Forecast - by Application
- 9.1.1. Food Additive
- 9.1.2. Fragrances
- 9.1.3. Beverage industry
- 9.1.4. Bakery
- 9.1.5. Other
- 9.2. Market Analysis, Insights and Forecast - by Type
- 9.2.1. 85% Content
- 9.2.2. 75% Content
- 9.2.3. Other
- 9.1. Market Analysis, Insights and Forecast - by Application
- 10. Asia Pacific Food Grade Phosphoric Acid Analysis, Insights and Forecast, 2020-2032
- 10.1. Market Analysis, Insights and Forecast - by Application
- 10.1.1. Food Additive
- 10.1.2. Fragrances
- 10.1.3. Beverage industry
- 10.1.4. Bakery
- 10.1.5. Other
- 10.2. Market Analysis, Insights and Forecast - by Type
- 10.2.1. 85% Content
- 10.2.2. 75% Content
- 10.2.3. Other
- 10.1. Market Analysis, Insights and Forecast - by Application
- 11. Competitive Analysis
- 11.1. Global Market Share Analysis 2025
- 11.2. Company Profiles
- 11.2.1 The Mosaic Company
- 11.2.1.1. Overview
- 11.2.1.2. Products
- 11.2.1.3. SWOT Analysis
- 11.2.1.4. Recent Developments
- 11.2.1.5. Financials (Based on Availability)
- 11.2.2 Capital Success Phos-Chemical
- 11.2.2.1. Overview
- 11.2.2.2. Products
- 11.2.2.3. SWOT Analysis
- 11.2.2.4. Recent Developments
- 11.2.2.5. Financials (Based on Availability)
- 11.2.3 Guizhou U-Share Materials
- 11.2.3.1. Overview
- 11.2.3.2. Products
- 11.2.3.3. SWOT Analysis
- 11.2.3.4. Recent Developments
- 11.2.3.5. Financials (Based on Availability)
- 11.2.4 Open Compute Project
- 11.2.4.1. Overview
- 11.2.4.2. Products
- 11.2.4.3. SWOT Analysis
- 11.2.4.4. Recent Developments
- 11.2.4.5. Financials (Based on Availability)
- 11.2.5 Agrema Poland
- 11.2.5.1. Overview
- 11.2.5.2. Products
- 11.2.5.3. SWOT Analysis
- 11.2.5.4. Recent Developments
- 11.2.5.5. Financials (Based on Availability)
- 11.2.6 Nutrien
- 11.2.6.1. Overview
- 11.2.6.2. Products
- 11.2.6.3. SWOT Analysis
- 11.2.6.4. Recent Developments
- 11.2.6.5. Financials (Based on Availability)
- 11.2.7 Yuntianhua International Chemical
- 11.2.7.1. Overview
- 11.2.7.2. Products
- 11.2.7.3. SWOT Analysis
- 11.2.7.4. Recent Developments
- 11.2.7.5. Financials (Based on Availability)
- 11.2.8 ICL Food Specialties
- 11.2.8.1. Overview
- 11.2.8.2. Products
- 11.2.8.3. SWOT Analysis
- 11.2.8.4. Recent Developments
- 11.2.8.5. Financials (Based on Availability)
- 11.2.9 Israel Chemicals
- 11.2.9.1. Overview
- 11.2.9.2. Products
- 11.2.9.3. SWOT Analysis
- 11.2.9.4. Recent Developments
- 11.2.9.5. Financials (Based on Availability)
- 11.2.10 Wengfu
- 11.2.10.1. Overview
- 11.2.10.2. Products
- 11.2.10.3. SWOT Analysis
- 11.2.10.4. Recent Developments
- 11.2.10.5. Financials (Based on Availability)
- 11.2.1 The Mosaic Company
List of Figures
- Figure 1: Global Food Grade Phosphoric Acid Revenue Breakdown (billion, %) by Region 2025 & 2033
- Figure 2: Global Food Grade Phosphoric Acid Volume Breakdown (K, %) by Region 2025 & 2033
- Figure 3: North America Food Grade Phosphoric Acid Revenue (billion), by Application 2025 & 2033
- Figure 4: North America Food Grade Phosphoric Acid Volume (K), by Application 2025 & 2033
- Figure 5: North America Food Grade Phosphoric Acid Revenue Share (%), by Application 2025 & 2033
- Figure 6: North America Food Grade Phosphoric Acid Volume Share (%), by Application 2025 & 2033
- Figure 7: North America Food Grade Phosphoric Acid Revenue (billion), by Type 2025 & 2033
- Figure 8: North America Food Grade Phosphoric Acid Volume (K), by Type 2025 & 2033
- Figure 9: North America Food Grade Phosphoric Acid Revenue Share (%), by Type 2025 & 2033
- Figure 10: North America Food Grade Phosphoric Acid Volume Share (%), by Type 2025 & 2033
- Figure 11: North America Food Grade Phosphoric Acid Revenue (billion), by Country 2025 & 2033
- Figure 12: North America Food Grade Phosphoric Acid Volume (K), by Country 2025 & 2033
- Figure 13: North America Food Grade Phosphoric Acid Revenue Share (%), by Country 2025 & 2033
- Figure 14: North America Food Grade Phosphoric Acid Volume Share (%), by Country 2025 & 2033
- Figure 15: South America Food Grade Phosphoric Acid Revenue (billion), by Application 2025 & 2033
- Figure 16: South America Food Grade Phosphoric Acid Volume (K), by Application 2025 & 2033
- Figure 17: South America Food Grade Phosphoric Acid Revenue Share (%), by Application 2025 & 2033
- Figure 18: South America Food Grade Phosphoric Acid Volume Share (%), by Application 2025 & 2033
- Figure 19: South America Food Grade Phosphoric Acid Revenue (billion), by Type 2025 & 2033
- Figure 20: South America Food Grade Phosphoric Acid Volume (K), by Type 2025 & 2033
- Figure 21: South America Food Grade Phosphoric Acid Revenue Share (%), by Type 2025 & 2033
- Figure 22: South America Food Grade Phosphoric Acid Volume Share (%), by Type 2025 & 2033
- Figure 23: South America Food Grade Phosphoric Acid Revenue (billion), by Country 2025 & 2033
- Figure 24: South America Food Grade Phosphoric Acid Volume (K), by Country 2025 & 2033
- Figure 25: South America Food Grade Phosphoric Acid Revenue Share (%), by Country 2025 & 2033
- Figure 26: South America Food Grade Phosphoric Acid Volume Share (%), by Country 2025 & 2033
- Figure 27: Europe Food Grade Phosphoric Acid Revenue (billion), by Application 2025 & 2033
- Figure 28: Europe Food Grade Phosphoric Acid Volume (K), by Application 2025 & 2033
- Figure 29: Europe Food Grade Phosphoric Acid Revenue Share (%), by Application 2025 & 2033
- Figure 30: Europe Food Grade Phosphoric Acid Volume Share (%), by Application 2025 & 2033
- Figure 31: Europe Food Grade Phosphoric Acid Revenue (billion), by Type 2025 & 2033
- Figure 32: Europe Food Grade Phosphoric Acid Volume (K), by Type 2025 & 2033
- Figure 33: Europe Food Grade Phosphoric Acid Revenue Share (%), by Type 2025 & 2033
- Figure 34: Europe Food Grade Phosphoric Acid Volume Share (%), by Type 2025 & 2033
- Figure 35: Europe Food Grade Phosphoric Acid Revenue (billion), by Country 2025 & 2033
- Figure 36: Europe Food Grade Phosphoric Acid Volume (K), by Country 2025 & 2033
- Figure 37: Europe Food Grade Phosphoric Acid Revenue Share (%), by Country 2025 & 2033
- Figure 38: Europe Food Grade Phosphoric Acid Volume Share (%), by Country 2025 & 2033
- Figure 39: Middle East & Africa Food Grade Phosphoric Acid Revenue (billion), by Application 2025 & 2033
- Figure 40: Middle East & Africa Food Grade Phosphoric Acid Volume (K), by Application 2025 & 2033
- Figure 41: Middle East & Africa Food Grade Phosphoric Acid Revenue Share (%), by Application 2025 & 2033
- Figure 42: Middle East & Africa Food Grade Phosphoric Acid Volume Share (%), by Application 2025 & 2033
- Figure 43: Middle East & Africa Food Grade Phosphoric Acid Revenue (billion), by Type 2025 & 2033
- Figure 44: Middle East & Africa Food Grade Phosphoric Acid Volume (K), by Type 2025 & 2033
- Figure 45: Middle East & Africa Food Grade Phosphoric Acid Revenue Share (%), by Type 2025 & 2033
- Figure 46: Middle East & Africa Food Grade Phosphoric Acid Volume Share (%), by Type 2025 & 2033
- Figure 47: Middle East & Africa Food Grade Phosphoric Acid Revenue (billion), by Country 2025 & 2033
- Figure 48: Middle East & Africa Food Grade Phosphoric Acid Volume (K), by Country 2025 & 2033
- Figure 49: Middle East & Africa Food Grade Phosphoric Acid Revenue Share (%), by Country 2025 & 2033
- Figure 50: Middle East & Africa Food Grade Phosphoric Acid Volume Share (%), by Country 2025 & 2033
- Figure 51: Asia Pacific Food Grade Phosphoric Acid Revenue (billion), by Application 2025 & 2033
- Figure 52: Asia Pacific Food Grade Phosphoric Acid Volume (K), by Application 2025 & 2033
- Figure 53: Asia Pacific Food Grade Phosphoric Acid Revenue Share (%), by Application 2025 & 2033
- Figure 54: Asia Pacific Food Grade Phosphoric Acid Volume Share (%), by Application 2025 & 2033
- Figure 55: Asia Pacific Food Grade Phosphoric Acid Revenue (billion), by Type 2025 & 2033
- Figure 56: Asia Pacific Food Grade Phosphoric Acid Volume (K), by Type 2025 & 2033
- Figure 57: Asia Pacific Food Grade Phosphoric Acid Revenue Share (%), by Type 2025 & 2033
- Figure 58: Asia Pacific Food Grade Phosphoric Acid Volume Share (%), by Type 2025 & 2033
- Figure 59: Asia Pacific Food Grade Phosphoric Acid Revenue (billion), by Country 2025 & 2033
- Figure 60: Asia Pacific Food Grade Phosphoric Acid Volume (K), by Country 2025 & 2033
- Figure 61: Asia Pacific Food Grade Phosphoric Acid Revenue Share (%), by Country 2025 & 2033
- Figure 62: Asia Pacific Food Grade Phosphoric Acid Volume Share (%), by Country 2025 & 2033
List of Tables
- Table 1: Global Food Grade Phosphoric Acid Revenue billion Forecast, by Application 2020 & 2033
- Table 2: Global Food Grade Phosphoric Acid Volume K Forecast, by Application 2020 & 2033
- Table 3: Global Food Grade Phosphoric Acid Revenue billion Forecast, by Type 2020 & 2033
- Table 4: Global Food Grade Phosphoric Acid Volume K Forecast, by Type 2020 & 2033
- Table 5: Global Food Grade Phosphoric Acid Revenue billion Forecast, by Region 2020 & 2033
- Table 6: Global Food Grade Phosphoric Acid Volume K Forecast, by Region 2020 & 2033
- Table 7: Global Food Grade Phosphoric Acid Revenue billion Forecast, by Application 2020 & 2033
- Table 8: Global Food Grade Phosphoric Acid Volume K Forecast, by Application 2020 & 2033
- Table 9: Global Food Grade Phosphoric Acid Revenue billion Forecast, by Type 2020 & 2033
- Table 10: Global Food Grade Phosphoric Acid Volume K Forecast, by Type 2020 & 2033
- Table 11: Global Food Grade Phosphoric Acid Revenue billion Forecast, by Country 2020 & 2033
- Table 12: Global Food Grade Phosphoric Acid Volume K Forecast, by Country 2020 & 2033
- Table 13: United States Food Grade Phosphoric Acid Revenue (billion) Forecast, by Application 2020 & 2033
- Table 14: United States Food Grade Phosphoric Acid Volume (K) Forecast, by Application 2020 & 2033
- Table 15: Canada Food Grade Phosphoric Acid Revenue (billion) Forecast, by Application 2020 & 2033
- Table 16: Canada Food Grade Phosphoric Acid Volume (K) Forecast, by Application 2020 & 2033
- Table 17: Mexico Food Grade Phosphoric Acid Revenue (billion) Forecast, by Application 2020 & 2033
- Table 18: Mexico Food Grade Phosphoric Acid Volume (K) Forecast, by Application 2020 & 2033
- Table 19: Global Food Grade Phosphoric Acid Revenue billion Forecast, by Application 2020 & 2033
- Table 20: Global Food Grade Phosphoric Acid Volume K Forecast, by Application 2020 & 2033
- Table 21: Global Food Grade Phosphoric Acid Revenue billion Forecast, by Type 2020 & 2033
- Table 22: Global Food Grade Phosphoric Acid Volume K Forecast, by Type 2020 & 2033
- Table 23: Global Food Grade Phosphoric Acid Revenue billion Forecast, by Country 2020 & 2033
- Table 24: Global Food Grade Phosphoric Acid Volume K Forecast, by Country 2020 & 2033
- Table 25: Brazil Food Grade Phosphoric Acid Revenue (billion) Forecast, by Application 2020 & 2033
- Table 26: Brazil Food Grade Phosphoric Acid Volume (K) Forecast, by Application 2020 & 2033
- Table 27: Argentina Food Grade Phosphoric Acid Revenue (billion) Forecast, by Application 2020 & 2033
- Table 28: Argentina Food Grade Phosphoric Acid Volume (K) Forecast, by Application 2020 & 2033
- Table 29: Rest of South America Food Grade Phosphoric Acid Revenue (billion) Forecast, by Application 2020 & 2033
- Table 30: Rest of South America Food Grade Phosphoric Acid Volume (K) Forecast, by Application 2020 & 2033
- Table 31: Global Food Grade Phosphoric Acid Revenue billion Forecast, by Application 2020 & 2033
- Table 32: Global Food Grade Phosphoric Acid Volume K Forecast, by Application 2020 & 2033
- Table 33: Global Food Grade Phosphoric Acid Revenue billion Forecast, by Type 2020 & 2033
- Table 34: Global Food Grade Phosphoric Acid Volume K Forecast, by Type 2020 & 2033
- Table 35: Global Food Grade Phosphoric Acid Revenue billion Forecast, by Country 2020 & 2033
- Table 36: Global Food Grade Phosphoric Acid Volume K Forecast, by Country 2020 & 2033
- Table 37: United Kingdom Food Grade Phosphoric Acid Revenue (billion) Forecast, by Application 2020 & 2033
- Table 38: United Kingdom Food Grade Phosphoric Acid Volume (K) Forecast, by Application 2020 & 2033
- Table 39: Germany Food Grade Phosphoric Acid Revenue (billion) Forecast, by Application 2020 & 2033
- Table 40: Germany Food Grade Phosphoric Acid Volume (K) Forecast, by Application 2020 & 2033
- Table 41: France Food Grade Phosphoric Acid Revenue (billion) Forecast, by Application 2020 & 2033
- Table 42: France Food Grade Phosphoric Acid Volume (K) Forecast, by Application 2020 & 2033
- Table 43: Italy Food Grade Phosphoric Acid Revenue (billion) Forecast, by Application 2020 & 2033
- Table 44: Italy Food Grade Phosphoric Acid Volume (K) Forecast, by Application 2020 & 2033
- Table 45: Spain Food Grade Phosphoric Acid Revenue (billion) Forecast, by Application 2020 & 2033
- Table 46: Spain Food Grade Phosphoric Acid Volume (K) Forecast, by Application 2020 & 2033
- Table 47: Russia Food Grade Phosphoric Acid Revenue (billion) Forecast, by Application 2020 & 2033
- Table 48: Russia Food Grade Phosphoric Acid Volume (K) Forecast, by Application 2020 & 2033
- Table 49: Benelux Food Grade Phosphoric Acid Revenue (billion) Forecast, by Application 2020 & 2033
- Table 50: Benelux Food Grade Phosphoric Acid Volume (K) Forecast, by Application 2020 & 2033
- Table 51: Nordics Food Grade Phosphoric Acid Revenue (billion) Forecast, by Application 2020 & 2033
- Table 52: Nordics Food Grade Phosphoric Acid Volume (K) Forecast, by Application 2020 & 2033
- Table 53: Rest of Europe Food Grade Phosphoric Acid Revenue (billion) Forecast, by Application 2020 & 2033
- Table 54: Rest of Europe Food Grade Phosphoric Acid Volume (K) Forecast, by Application 2020 & 2033
- Table 55: Global Food Grade Phosphoric Acid Revenue billion Forecast, by Application 2020 & 2033
- Table 56: Global Food Grade Phosphoric Acid Volume K Forecast, by Application 2020 & 2033
- Table 57: Global Food Grade Phosphoric Acid Revenue billion Forecast, by Type 2020 & 2033
- Table 58: Global Food Grade Phosphoric Acid Volume K Forecast, by Type 2020 & 2033
- Table 59: Global Food Grade Phosphoric Acid Revenue billion Forecast, by Country 2020 & 2033
- Table 60: Global Food Grade Phosphoric Acid Volume K Forecast, by Country 2020 & 2033
- Table 61: Turkey Food Grade Phosphoric Acid Revenue (billion) Forecast, by Application 2020 & 2033
- Table 62: Turkey Food Grade Phosphoric Acid Volume (K) Forecast, by Application 2020 & 2033
- Table 63: Israel Food Grade Phosphoric Acid Revenue (billion) Forecast, by Application 2020 & 2033
- Table 64: Israel Food Grade Phosphoric Acid Volume (K) Forecast, by Application 2020 & 2033
- Table 65: GCC Food Grade Phosphoric Acid Revenue (billion) Forecast, by Application 2020 & 2033
- Table 66: GCC Food Grade Phosphoric Acid Volume (K) Forecast, by Application 2020 & 2033
- Table 67: North Africa Food Grade Phosphoric Acid Revenue (billion) Forecast, by Application 2020 & 2033
- Table 68: North Africa Food Grade Phosphoric Acid Volume (K) Forecast, by Application 2020 & 2033
- Table 69: South Africa Food Grade Phosphoric Acid Revenue (billion) Forecast, by Application 2020 & 2033
- Table 70: South Africa Food Grade Phosphoric Acid Volume (K) Forecast, by Application 2020 & 2033
- Table 71: Rest of Middle East & Africa Food Grade Phosphoric Acid Revenue (billion) Forecast, by Application 2020 & 2033
- Table 72: Rest of Middle East & Africa Food Grade Phosphoric Acid Volume (K) Forecast, by Application 2020 & 2033
- Table 73: Global Food Grade Phosphoric Acid Revenue billion Forecast, by Application 2020 & 2033
- Table 74: Global Food Grade Phosphoric Acid Volume K Forecast, by Application 2020 & 2033
- Table 75: Global Food Grade Phosphoric Acid Revenue billion Forecast, by Type 2020 & 2033
- Table 76: Global Food Grade Phosphoric Acid Volume K Forecast, by Type 2020 & 2033
- Table 77: Global Food Grade Phosphoric Acid Revenue billion Forecast, by Country 2020 & 2033
- Table 78: Global Food Grade Phosphoric Acid Volume K Forecast, by Country 2020 & 2033
- Table 79: China Food Grade Phosphoric Acid Revenue (billion) Forecast, by Application 2020 & 2033
- Table 80: China Food Grade Phosphoric Acid Volume (K) Forecast, by Application 2020 & 2033
- Table 81: India Food Grade Phosphoric Acid Revenue (billion) Forecast, by Application 2020 & 2033
- Table 82: India Food Grade Phosphoric Acid Volume (K) Forecast, by Application 2020 & 2033
- Table 83: Japan Food Grade Phosphoric Acid Revenue (billion) Forecast, by Application 2020 & 2033
- Table 84: Japan Food Grade Phosphoric Acid Volume (K) Forecast, by Application 2020 & 2033
- Table 85: South Korea Food Grade Phosphoric Acid Revenue (billion) Forecast, by Application 2020 & 2033
- Table 86: South Korea Food Grade Phosphoric Acid Volume (K) Forecast, by Application 2020 & 2033
- Table 87: ASEAN Food Grade Phosphoric Acid Revenue (billion) Forecast, by Application 2020 & 2033
- Table 88: ASEAN Food Grade Phosphoric Acid Volume (K) Forecast, by Application 2020 & 2033
- Table 89: Oceania Food Grade Phosphoric Acid Revenue (billion) Forecast, by Application 2020 & 2033
- Table 90: Oceania Food Grade Phosphoric Acid Volume (K) Forecast, by Application 2020 & 2033
- Table 91: Rest of Asia Pacific Food Grade Phosphoric Acid Revenue (billion) Forecast, by Application 2020 & 2033
- Table 92: Rest of Asia Pacific Food Grade Phosphoric Acid Volume (K) Forecast, by Application 2020 & 2033
Frequently Asked Questions
1. What is the projected Compound Annual Growth Rate (CAGR) of the Food Grade Phosphoric Acid?
The projected CAGR is approximately 3.4%.
2. Which companies are prominent players in the Food Grade Phosphoric Acid?
Key companies in the market include The Mosaic Company, Capital Success Phos-Chemical, Guizhou U-Share Materials, Open Compute Project, Agrema Poland, Nutrien, Yuntianhua International Chemical, ICL Food Specialties, Israel Chemicals, Wengfu.
3. What are the main segments of the Food Grade Phosphoric Acid?
The market segments include Application, Type.
4. Can you provide details about the market size?
The market size is estimated to be USD 2.58 billion as of 2022.
5. What are some drivers contributing to market growth?
N/A
6. What are the notable trends driving market growth?
N/A
7. Are there any restraints impacting market growth?
N/A
8. Can you provide examples of recent developments in the market?
N/A
9. What pricing options are available for accessing the report?
Pricing options include single-user, multi-user, and enterprise licenses priced at USD 3950.00, USD 5925.00, and USD 7900.00 respectively.
10. Is the market size provided in terms of value or volume?
The market size is provided in terms of value, measured in billion and volume, measured in K.
11. Are there any specific market keywords associated with the report?
Yes, the market keyword associated with the report is "Food Grade Phosphoric Acid," which aids in identifying and referencing the specific market segment covered.
12. How do I determine which pricing option suits my needs best?
The pricing options vary based on user requirements and access needs. Individual users may opt for single-user licenses, while businesses requiring broader access may choose multi-user or enterprise licenses for cost-effective access to the report.
13. Are there any additional resources or data provided in the Food Grade Phosphoric Acid report?
While the report offers comprehensive insights, it's advisable to review the specific contents or supplementary materials provided to ascertain if additional resources or data are available.
14. How can I stay updated on further developments or reports in the Food Grade Phosphoric Acid?
To stay informed about further developments, trends, and reports in the Food Grade Phosphoric Acid, consider subscribing to industry newsletters, following relevant companies and organizations, or regularly checking reputable industry news sources and publications.
Methodology
Step 1 - Identification of Relevant Samples Size from Population Database


Step 2 - Approaches for Defining Global Market Size (Value, Volume* & Price*)

Note*: In applicable scenarios
Step 3 - Data Sources
Primary Research
- Web Analytics
- Survey Reports
- Research Institute
- Latest Research Reports
- Opinion Leaders
Secondary Research
- Annual Reports
- White Paper
- Latest Press Release
- Industry Association
- Paid Database
- Investor Presentations

Step 4 - Data Triangulation
Involves using different sources of information in order to increase the validity of a study
These sources are likely to be stakeholders in a program - participants, other researchers, program staff, other community members, and so on.
Then we put all data in single framework & apply various statistical tools to find out the dynamic on the market.
During the analysis stage, feedback from the stakeholder groups would be compared to determine areas of agreement as well as areas of divergence