

Key Insights
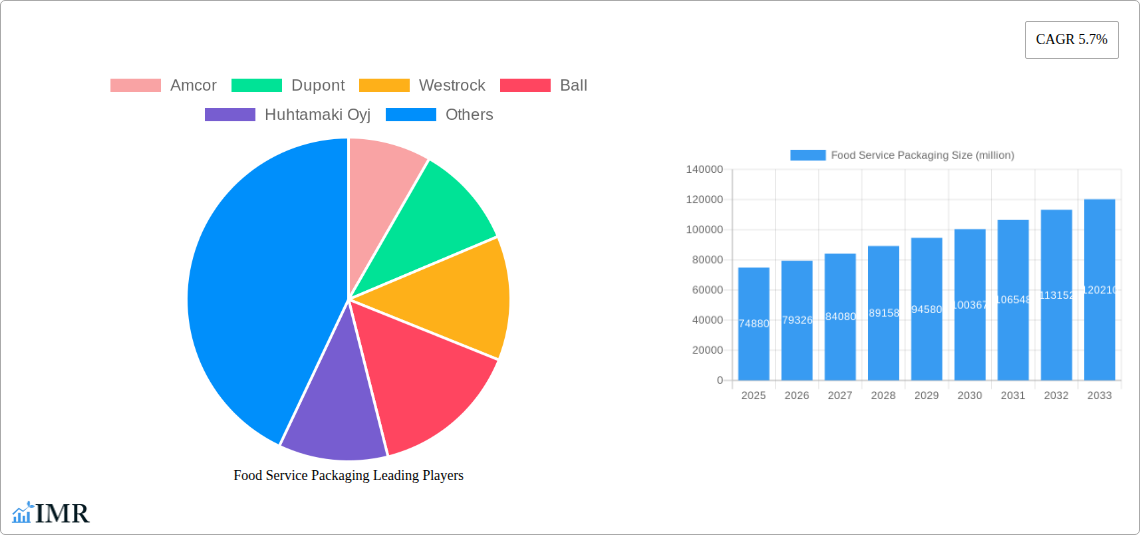
The global food service packaging market is forecast to reach $110.29 billion by 2025, exhibiting strong growth driven by increasing QSR popularity and the demand for convenient, on-the-go food solutions. Heightened focus on food safety, hygiene, and sustainable packaging regulations are key market influencers. Consumer preference is shifting towards eco-friendly options, including biodegradable and compostable materials. Key market players such as Amcor, DuPont, WestRock, and others are driving innovation in material science and packaging design. Advancements in packaging technology, focusing on enhanced barrier properties, extended shelf life, and aesthetics, will further fuel market expansion.
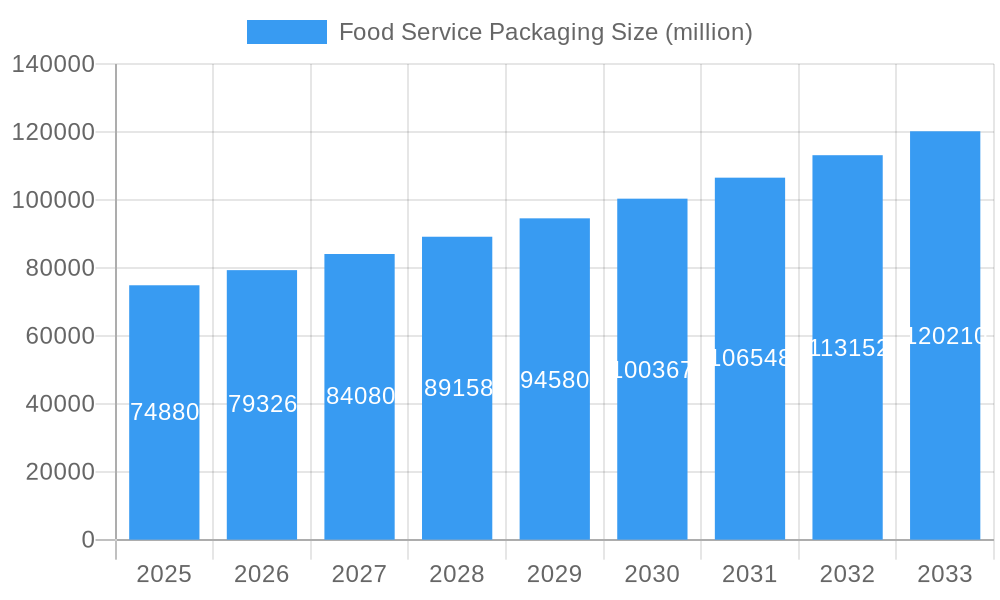
Food Service Packaging Market Size (In Billion)
The market is projected to grow at a compound annual growth rate (CAGR) of 5.5% from 2025 to 2033. Regional growth will vary, with developing economies anticipated to outpace mature markets. Segmentation will evolve with specialized packaging for specific food types. Sustainability initiatives will necessitate R&D investment in eco-friendly materials and manufacturing. Challenges include raw material price volatility, strict environmental regulations, and balancing cost-effectiveness with sustainability. Market success hinges on companies' adaptability and innovation to meet evolving consumer demands and regulatory landscapes.
Food Service Packaging Company Market Share
Food Service Packaging Market Report: 2019-2033
This comprehensive report provides a detailed analysis of the Food Service Packaging market, encompassing market dynamics, growth trends, regional dominance, product landscape, key players, and future outlook. The study period covers 2019-2033, with 2025 serving as the base and estimated year. The forecast period is 2025-2033, and the historical period is 2019-2024. The report offers invaluable insights for industry professionals, investors, and stakeholders seeking to understand and capitalize on opportunities within this dynamic sector. The market is segmented by material type (e.g., paperboard, plastic, etc.) and application (e.g., takeout containers, cups, etc.) The parent market is packaging, and the child market is food packaging.
Food Service Packaging Market Dynamics & Structure
The Food Service Packaging market is characterized by moderate concentration, with key players such as Amcor, Dupont, WestRock, Ball, Huhtamaki Oyj, Sealed Air, Berry Plastic, Reynolds Group Holding, International Paper, DS Smith, and Genpak holding significant market share. The market size in 2025 is estimated at xx million units. Technological innovation, particularly in sustainable and biodegradable materials, is a key driver, alongside evolving consumer preferences towards eco-friendly options. Stringent regulatory frameworks concerning single-use plastics are impacting material choices and prompting the adoption of more sustainable alternatives. Competitive substitutes include reusable packaging and alternative delivery models. M&A activity is prevalent, with xx major deals recorded between 2019 and 2024, driving consolidation within the sector.
- Market Concentration: Moderately concentrated, with top 10 players holding approximately xx% market share in 2025.
- Technological Innovation: Focus on biodegradable, compostable, and recyclable materials is accelerating.
- Regulatory Framework: Stringent regulations on single-use plastics are influencing product development and adoption.
- Competitive Substitutes: Reusable packaging and alternative delivery methods pose challenges.
- M&A Activity: xx major mergers and acquisitions between 2019 and 2024, driving consolidation and innovation.
- End-User Demographics: Growing demand from quick-service restaurants and food delivery services.
Food Service Packaging Growth Trends & Insights
The Food Service Packaging market experienced robust growth between 2019 and 2024, with a CAGR of xx%. This growth is attributed to several factors, including the rise of food delivery services, increasing disposable incomes, changing consumer lifestyles and preferences (demand for convenience), and expansion of the quick-service restaurant segment. Technological advancements, such as the development of innovative materials and improved manufacturing processes, are also driving market expansion. The market penetration rate for eco-friendly packaging is increasing, although still relatively low compared to traditional options. Consumer behavior is shifting towards greater sustainability concerns, impacting packaging choices.
The adoption rate for sustainable materials (bioplastics, paper-based) is projected to increase significantly from xx% in 2025 to xx% by 2033. The market is expected to reach xx million units by 2033, with a projected CAGR of xx% during the forecast period.
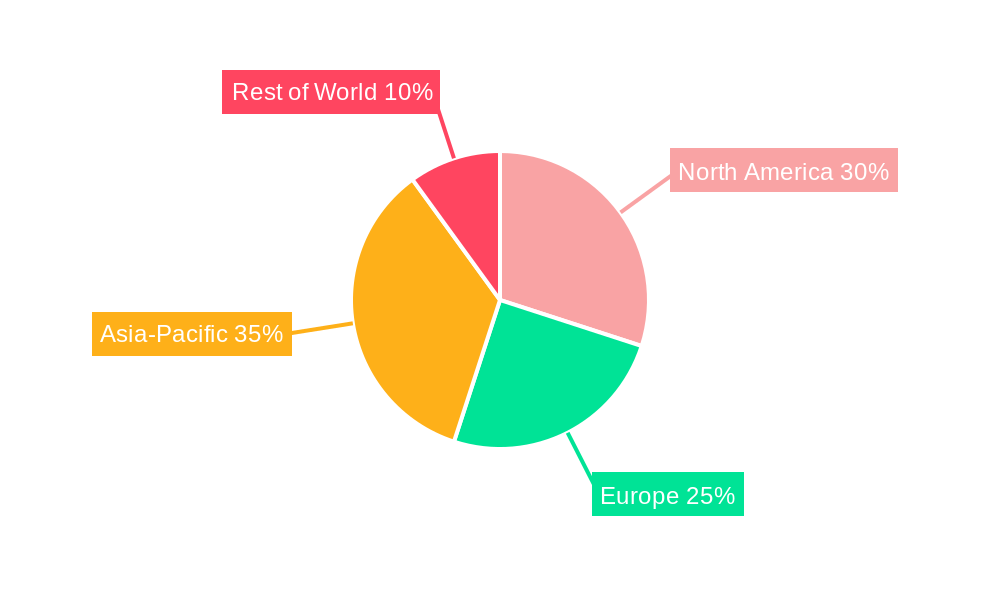
Dominant Regions, Countries, or Segments in Food Service Packaging
North America holds the largest market share in the Food Service Packaging sector, followed by Europe and Asia-Pacific. The dominance of North America stems from high disposable incomes, the prevalence of quick-service restaurants and food delivery platforms, and a well-established food service industry infrastructure. Strong economic growth and favorable regulatory environments contribute to this region's leading position. Within North America, the United States commands the largest share due to factors such as high demand from large restaurant chains and developed food delivery ecosystem.
- North America: High disposable incomes, robust food service sector, strong delivery infrastructure.
- Europe: Growing demand for sustainable packaging solutions and stringent environmental regulations.
- Asia-Pacific: Rapid economic growth and expanding middle class drive significant demand.
- Key Drivers: Favorable economic conditions, rising consumer demand for convenience, and technological innovation.
Food Service Packaging Product Landscape
The Food Service Packaging market offers a wide array of products, including disposable containers (paperboard, plastic, and foam), cups, lids, bags, and cutlery. Recent innovations focus on eco-friendly materials, such as biodegradable plastics and compostable paperboard, to meet growing environmental concerns. These newer products often incorporate features enhancing food preservation, temperature control, and convenience. Improvements in barrier technology and material properties are aimed at extending product shelf life and reducing food waste.
Key Drivers, Barriers & Challenges in Food Service Packaging
Key Drivers:
- Growing demand from food delivery and quick-service restaurants.
- Increasing consumer preference for convenience and on-the-go meals.
- Technological advances in sustainable and functional packaging materials.
Challenges & Restraints:
- Fluctuations in raw material prices, impacting production costs.
- Stringent environmental regulations and increasing pressure for sustainable options.
- Intense competition and price pressures from various packaging manufacturers.
Emerging Opportunities in Food Service Packaging
- Growing demand for sustainable and eco-friendly packaging.
- Development of innovative materials with improved barrier properties and functionalities.
- Expansion into emerging markets with high growth potential.
Growth Accelerators in the Food Service Packaging Industry
Technological breakthroughs in material science, particularly in biodegradable and compostable alternatives, are key drivers of long-term growth. Strategic partnerships and collaborations between packaging manufacturers and food service businesses are also fostering innovation. Market expansion strategies targeting emerging economies with growing food service sectors are expected to unlock significant opportunities.
Key Players Shaping the Food Service Packaging Market
Notable Milestones in Food Service Packaging Sector
- 2020: Increased focus on sustainable packaging solutions due to heightened environmental concerns.
- 2021: Several major players launched new lines of compostable and recyclable food service packaging.
- 2022: Significant investments in research and development for advanced biodegradable materials.
- 2023: Several mergers and acquisitions further consolidated the industry landscape.
In-Depth Food Service Packaging Market Outlook
The Food Service Packaging market is poised for continued growth over the next decade, driven by the increasing demand for convenience, the expansion of the food delivery sector, and the growing adoption of sustainable packaging solutions. Strategic investments in research and development, coupled with strategic partnerships and acquisitions, will shape the market landscape. Opportunities exist for companies that can offer innovative, sustainable, and cost-effective packaging solutions catering to the evolving needs of the food service industry.
Food Service Packaging Segmentation
-
1. Application
- 1.1. Alcoholic Beverages
- 1.2. Non-alcoholic Beverages
- 1.3. Fruits & Vegetables
- 1.4. Bakery & Confectionery
-
2. Type
- 2.1. Flexible Packaging
- 2.2. Rigid Packaging
Food Service Packaging Segmentation By Geography
-
1. North America
- 1.1. United States
- 1.2. Canada
- 1.3. Mexico
-
2. South America
- 2.1. Brazil
- 2.2. Argentina
- 2.3. Rest of South America
-
3. Europe
- 3.1. United Kingdom
- 3.2. Germany
- 3.3. France
- 3.4. Italy
- 3.5. Spain
- 3.6. Russia
- 3.7. Benelux
- 3.8. Nordics
- 3.9. Rest of Europe
-
4. Middle East & Africa
- 4.1. Turkey
- 4.2. Israel
- 4.3. GCC
- 4.4. North Africa
- 4.5. South Africa
- 4.6. Rest of Middle East & Africa
-
5. Asia Pacific
- 5.1. China
- 5.2. India
- 5.3. Japan
- 5.4. South Korea
- 5.5. ASEAN
- 5.6. Oceania
- 5.7. Rest of Asia Pacific
Food Service Packaging Regional Market Share
Geographic Coverage of Food Service Packaging
Food Service Packaging REPORT HIGHLIGHTS
| Aspects | Details |
|---|---|
| Study Period | 2020-2034 |
| Base Year | 2025 |
| Estimated Year | 2026 |
| Forecast Period | 2026-2034 |
| Historical Period | 2020-2025 |
| Growth Rate | CAGR of 5.5% from 2020-2034 |
| Segmentation |
|
Table of Contents
- 1. Introduction
- 1.1. Research Scope
- 1.2. Market Segmentation
- 1.3. Research Objective
- 1.4. Definitions and Assumptions
- 2. Executive Summary
- 2.1. Market Snapshot
- 3. Market Dynamics
- 3.1. Market Drivers
- 3.2. Market Restrains
- 3.3. Market Trends
- 3.4. Market Opportunities
- 4. Market Factor Analysis
- 4.1. Porters Five Forces
- 4.1.1. Bargaining Power of Suppliers
- 4.1.2. Bargaining Power of Buyers
- 4.1.3. Threat of New Entrants
- 4.1.4. Threat of Substitutes
- 4.1.5. Competitive Rivalry
- 4.2. PESTEL analysis
- 4.3. BCG Analysis
- 4.3.1. Stars (High Growth, High Market Share)
- 4.3.2. Cash Cows (Low Growth, High Market Share)
- 4.3.3. Question Mark (High Growth, Low Market Share)
- 4.3.4. Dogs (Low Growth, Low Market Share)
- 4.4. Ansoff Matrix Analysis
- 4.5. Supply Chain Analysis
- 4.6. Regulatory Landscape
- 4.7. Current Market Potential and Opportunity Assessment (TAM–SAM–SOM Framework)
- 4.8. IMR Analyst Note
- 4.1. Porters Five Forces
- 5. Market Analysis, Insights and Forecast 2021-2033
- 5.1. Market Analysis, Insights and Forecast - by Application
- 5.1.1. Alcoholic Beverages
- 5.1.2. Non-alcoholic Beverages
- 5.1.3. Fruits & Vegetables
- 5.1.4. Bakery & Confectionery
- 5.2. Market Analysis, Insights and Forecast - by Type
- 5.2.1. Flexible Packaging
- 5.2.2. Rigid Packaging
- 5.3. Market Analysis, Insights and Forecast - by Region
- 5.3.1. North America
- 5.3.2. South America
- 5.3.3. Europe
- 5.3.4. Middle East & Africa
- 5.3.5. Asia Pacific
- 5.1. Market Analysis, Insights and Forecast - by Application
- 6. Global Food Service Packaging Analysis, Insights and Forecast, 2021-2033
- 6.1. Market Analysis, Insights and Forecast - by Application
- 6.1.1. Alcoholic Beverages
- 6.1.2. Non-alcoholic Beverages
- 6.1.3. Fruits & Vegetables
- 6.1.4. Bakery & Confectionery
- 6.2. Market Analysis, Insights and Forecast - by Type
- 6.2.1. Flexible Packaging
- 6.2.2. Rigid Packaging
- 6.1. Market Analysis, Insights and Forecast - by Application
- 7. North America Food Service Packaging Analysis, Insights and Forecast, 2020-2032
- 7.1. Market Analysis, Insights and Forecast - by Application
- 7.1.1. Alcoholic Beverages
- 7.1.2. Non-alcoholic Beverages
- 7.1.3. Fruits & Vegetables
- 7.1.4. Bakery & Confectionery
- 7.2. Market Analysis, Insights and Forecast - by Type
- 7.2.1. Flexible Packaging
- 7.2.2. Rigid Packaging
- 7.1. Market Analysis, Insights and Forecast - by Application
- 8. South America Food Service Packaging Analysis, Insights and Forecast, 2020-2032
- 8.1. Market Analysis, Insights and Forecast - by Application
- 8.1.1. Alcoholic Beverages
- 8.1.2. Non-alcoholic Beverages
- 8.1.3. Fruits & Vegetables
- 8.1.4. Bakery & Confectionery
- 8.2. Market Analysis, Insights and Forecast - by Type
- 8.2.1. Flexible Packaging
- 8.2.2. Rigid Packaging
- 8.1. Market Analysis, Insights and Forecast - by Application
- 9. Europe Food Service Packaging Analysis, Insights and Forecast, 2020-2032
- 9.1. Market Analysis, Insights and Forecast - by Application
- 9.1.1. Alcoholic Beverages
- 9.1.2. Non-alcoholic Beverages
- 9.1.3. Fruits & Vegetables
- 9.1.4. Bakery & Confectionery
- 9.2. Market Analysis, Insights and Forecast - by Type
- 9.2.1. Flexible Packaging
- 9.2.2. Rigid Packaging
- 9.1. Market Analysis, Insights and Forecast - by Application
- 10. Middle East & Africa Food Service Packaging Analysis, Insights and Forecast, 2020-2032
- 10.1. Market Analysis, Insights and Forecast - by Application
- 10.1.1. Alcoholic Beverages
- 10.1.2. Non-alcoholic Beverages
- 10.1.3. Fruits & Vegetables
- 10.1.4. Bakery & Confectionery
- 10.2. Market Analysis, Insights and Forecast - by Type
- 10.2.1. Flexible Packaging
- 10.2.2. Rigid Packaging
- 10.1. Market Analysis, Insights and Forecast - by Application
- 11. Asia Pacific Food Service Packaging Analysis, Insights and Forecast, 2020-2032
- 11.1. Market Analysis, Insights and Forecast - by Application
- 11.1.1. Alcoholic Beverages
- 11.1.2. Non-alcoholic Beverages
- 11.1.3. Fruits & Vegetables
- 11.1.4. Bakery & Confectionery
- 11.2. Market Analysis, Insights and Forecast - by Type
- 11.2.1. Flexible Packaging
- 11.2.2. Rigid Packaging
- 11.1. Market Analysis, Insights and Forecast - by Application
- 12. Competitive Analysis
- 12.1. Company Profiles
- 12.1.1 Amcor
- 12.1.1.1. Company Overview
- 12.1.1.2. Products
- 12.1.1.3. Company Financials
- 12.1.1.4. SWOT Analysis
- 12.1.2 Dupont
- 12.1.2.1. Company Overview
- 12.1.2.2. Products
- 12.1.2.3. Company Financials
- 12.1.2.4. SWOT Analysis
- 12.1.3 Westrock
- 12.1.3.1. Company Overview
- 12.1.3.2. Products
- 12.1.3.3. Company Financials
- 12.1.3.4. SWOT Analysis
- 12.1.4 Ball
- 12.1.4.1. Company Overview
- 12.1.4.2. Products
- 12.1.4.3. Company Financials
- 12.1.4.4. SWOT Analysis
- 12.1.5 Huhtamaki Oyj
- 12.1.5.1. Company Overview
- 12.1.5.2. Products
- 12.1.5.3. Company Financials
- 12.1.5.4. SWOT Analysis
- 12.1.6 Sealed Air
- 12.1.6.1. Company Overview
- 12.1.6.2. Products
- 12.1.6.3. Company Financials
- 12.1.6.4. SWOT Analysis
- 12.1.7 Berry Plastic
- 12.1.7.1. Company Overview
- 12.1.7.2. Products
- 12.1.7.3. Company Financials
- 12.1.7.4. SWOT Analysis
- 12.1.8 Reynolds Group Holding
- 12.1.8.1. Company Overview
- 12.1.8.2. Products
- 12.1.8.3. Company Financials
- 12.1.8.4. SWOT Analysis
- 12.1.9 International Paper
- 12.1.9.1. Company Overview
- 12.1.9.2. Products
- 12.1.9.3. Company Financials
- 12.1.9.4. SWOT Analysis
- 12.1.10 Ds Smith
- 12.1.10.1. Company Overview
- 12.1.10.2. Products
- 12.1.10.3. Company Financials
- 12.1.10.4. SWOT Analysis
- 12.1.11 Genpak
- 12.1.11.1. Company Overview
- 12.1.11.2. Products
- 12.1.11.3. Company Financials
- 12.1.11.4. SWOT Analysis
- 12.1.1 Amcor
- 12.2. Market Entropy
- 12.2.1 Company's Key Areas Served
- 12.2.2 Recent Developments
- 12.3. Company Market Share Analysis 2025
- 12.3.1 Top 5 Companies Market Share Analysis
- 12.3.2 Top 3 Companies Market Share Analysis
- 12.4. List of Potential Customers
- 13. Research Methodology
List of Figures
- Figure 1: Global Food Service Packaging Revenue Breakdown (billion, %) by Region 2025 & 2033
- Figure 2: Global Food Service Packaging Volume Breakdown (K, %) by Region 2025 & 2033
- Figure 3: North America Food Service Packaging Revenue (billion), by Application 2025 & 2033
- Figure 4: North America Food Service Packaging Volume (K), by Application 2025 & 2033
- Figure 5: North America Food Service Packaging Revenue Share (%), by Application 2025 & 2033
- Figure 6: North America Food Service Packaging Volume Share (%), by Application 2025 & 2033
- Figure 7: North America Food Service Packaging Revenue (billion), by Type 2025 & 2033
- Figure 8: North America Food Service Packaging Volume (K), by Type 2025 & 2033
- Figure 9: North America Food Service Packaging Revenue Share (%), by Type 2025 & 2033
- Figure 10: North America Food Service Packaging Volume Share (%), by Type 2025 & 2033
- Figure 11: North America Food Service Packaging Revenue (billion), by Country 2025 & 2033
- Figure 12: North America Food Service Packaging Volume (K), by Country 2025 & 2033
- Figure 13: North America Food Service Packaging Revenue Share (%), by Country 2025 & 2033
- Figure 14: North America Food Service Packaging Volume Share (%), by Country 2025 & 2033
- Figure 15: South America Food Service Packaging Revenue (billion), by Application 2025 & 2033
- Figure 16: South America Food Service Packaging Volume (K), by Application 2025 & 2033
- Figure 17: South America Food Service Packaging Revenue Share (%), by Application 2025 & 2033
- Figure 18: South America Food Service Packaging Volume Share (%), by Application 2025 & 2033
- Figure 19: South America Food Service Packaging Revenue (billion), by Type 2025 & 2033
- Figure 20: South America Food Service Packaging Volume (K), by Type 2025 & 2033
- Figure 21: South America Food Service Packaging Revenue Share (%), by Type 2025 & 2033
- Figure 22: South America Food Service Packaging Volume Share (%), by Type 2025 & 2033
- Figure 23: South America Food Service Packaging Revenue (billion), by Country 2025 & 2033
- Figure 24: South America Food Service Packaging Volume (K), by Country 2025 & 2033
- Figure 25: South America Food Service Packaging Revenue Share (%), by Country 2025 & 2033
- Figure 26: South America Food Service Packaging Volume Share (%), by Country 2025 & 2033
- Figure 27: Europe Food Service Packaging Revenue (billion), by Application 2025 & 2033
- Figure 28: Europe Food Service Packaging Volume (K), by Application 2025 & 2033
- Figure 29: Europe Food Service Packaging Revenue Share (%), by Application 2025 & 2033
- Figure 30: Europe Food Service Packaging Volume Share (%), by Application 2025 & 2033
- Figure 31: Europe Food Service Packaging Revenue (billion), by Type 2025 & 2033
- Figure 32: Europe Food Service Packaging Volume (K), by Type 2025 & 2033
- Figure 33: Europe Food Service Packaging Revenue Share (%), by Type 2025 & 2033
- Figure 34: Europe Food Service Packaging Volume Share (%), by Type 2025 & 2033
- Figure 35: Europe Food Service Packaging Revenue (billion), by Country 2025 & 2033
- Figure 36: Europe Food Service Packaging Volume (K), by Country 2025 & 2033
- Figure 37: Europe Food Service Packaging Revenue Share (%), by Country 2025 & 2033
- Figure 38: Europe Food Service Packaging Volume Share (%), by Country 2025 & 2033
- Figure 39: Middle East & Africa Food Service Packaging Revenue (billion), by Application 2025 & 2033
- Figure 40: Middle East & Africa Food Service Packaging Volume (K), by Application 2025 & 2033
- Figure 41: Middle East & Africa Food Service Packaging Revenue Share (%), by Application 2025 & 2033
- Figure 42: Middle East & Africa Food Service Packaging Volume Share (%), by Application 2025 & 2033
- Figure 43: Middle East & Africa Food Service Packaging Revenue (billion), by Type 2025 & 2033
- Figure 44: Middle East & Africa Food Service Packaging Volume (K), by Type 2025 & 2033
- Figure 45: Middle East & Africa Food Service Packaging Revenue Share (%), by Type 2025 & 2033
- Figure 46: Middle East & Africa Food Service Packaging Volume Share (%), by Type 2025 & 2033
- Figure 47: Middle East & Africa Food Service Packaging Revenue (billion), by Country 2025 & 2033
- Figure 48: Middle East & Africa Food Service Packaging Volume (K), by Country 2025 & 2033
- Figure 49: Middle East & Africa Food Service Packaging Revenue Share (%), by Country 2025 & 2033
- Figure 50: Middle East & Africa Food Service Packaging Volume Share (%), by Country 2025 & 2033
- Figure 51: Asia Pacific Food Service Packaging Revenue (billion), by Application 2025 & 2033
- Figure 52: Asia Pacific Food Service Packaging Volume (K), by Application 2025 & 2033
- Figure 53: Asia Pacific Food Service Packaging Revenue Share (%), by Application 2025 & 2033
- Figure 54: Asia Pacific Food Service Packaging Volume Share (%), by Application 2025 & 2033
- Figure 55: Asia Pacific Food Service Packaging Revenue (billion), by Type 2025 & 2033
- Figure 56: Asia Pacific Food Service Packaging Volume (K), by Type 2025 & 2033
- Figure 57: Asia Pacific Food Service Packaging Revenue Share (%), by Type 2025 & 2033
- Figure 58: Asia Pacific Food Service Packaging Volume Share (%), by Type 2025 & 2033
- Figure 59: Asia Pacific Food Service Packaging Revenue (billion), by Country 2025 & 2033
- Figure 60: Asia Pacific Food Service Packaging Volume (K), by Country 2025 & 2033
- Figure 61: Asia Pacific Food Service Packaging Revenue Share (%), by Country 2025 & 2033
- Figure 62: Asia Pacific Food Service Packaging Volume Share (%), by Country 2025 & 2033
List of Tables
- Table 1: Global Food Service Packaging Revenue billion Forecast, by Application 2020 & 2033
- Table 2: Global Food Service Packaging Volume K Forecast, by Application 2020 & 2033
- Table 3: Global Food Service Packaging Revenue billion Forecast, by Type 2020 & 2033
- Table 4: Global Food Service Packaging Volume K Forecast, by Type 2020 & 2033
- Table 5: Global Food Service Packaging Revenue billion Forecast, by Region 2020 & 2033
- Table 6: Global Food Service Packaging Volume K Forecast, by Region 2020 & 2033
- Table 7: Global Food Service Packaging Revenue billion Forecast, by Application 2020 & 2033
- Table 8: Global Food Service Packaging Volume K Forecast, by Application 2020 & 2033
- Table 9: Global Food Service Packaging Revenue billion Forecast, by Type 2020 & 2033
- Table 10: Global Food Service Packaging Volume K Forecast, by Type 2020 & 2033
- Table 11: Global Food Service Packaging Revenue billion Forecast, by Country 2020 & 2033
- Table 12: Global Food Service Packaging Volume K Forecast, by Country 2020 & 2033
- Table 13: United States Food Service Packaging Revenue (billion) Forecast, by Application 2020 & 2033
- Table 14: United States Food Service Packaging Volume (K) Forecast, by Application 2020 & 2033
- Table 15: Canada Food Service Packaging Revenue (billion) Forecast, by Application 2020 & 2033
- Table 16: Canada Food Service Packaging Volume (K) Forecast, by Application 2020 & 2033
- Table 17: Mexico Food Service Packaging Revenue (billion) Forecast, by Application 2020 & 2033
- Table 18: Mexico Food Service Packaging Volume (K) Forecast, by Application 2020 & 2033
- Table 19: Global Food Service Packaging Revenue billion Forecast, by Application 2020 & 2033
- Table 20: Global Food Service Packaging Volume K Forecast, by Application 2020 & 2033
- Table 21: Global Food Service Packaging Revenue billion Forecast, by Type 2020 & 2033
- Table 22: Global Food Service Packaging Volume K Forecast, by Type 2020 & 2033
- Table 23: Global Food Service Packaging Revenue billion Forecast, by Country 2020 & 2033
- Table 24: Global Food Service Packaging Volume K Forecast, by Country 2020 & 2033
- Table 25: Brazil Food Service Packaging Revenue (billion) Forecast, by Application 2020 & 2033
- Table 26: Brazil Food Service Packaging Volume (K) Forecast, by Application 2020 & 2033
- Table 27: Argentina Food Service Packaging Revenue (billion) Forecast, by Application 2020 & 2033
- Table 28: Argentina Food Service Packaging Volume (K) Forecast, by Application 2020 & 2033
- Table 29: Rest of South America Food Service Packaging Revenue (billion) Forecast, by Application 2020 & 2033
- Table 30: Rest of South America Food Service Packaging Volume (K) Forecast, by Application 2020 & 2033
- Table 31: Global Food Service Packaging Revenue billion Forecast, by Application 2020 & 2033
- Table 32: Global Food Service Packaging Volume K Forecast, by Application 2020 & 2033
- Table 33: Global Food Service Packaging Revenue billion Forecast, by Type 2020 & 2033
- Table 34: Global Food Service Packaging Volume K Forecast, by Type 2020 & 2033
- Table 35: Global Food Service Packaging Revenue billion Forecast, by Country 2020 & 2033
- Table 36: Global Food Service Packaging Volume K Forecast, by Country 2020 & 2033
- Table 37: United Kingdom Food Service Packaging Revenue (billion) Forecast, by Application 2020 & 2033
- Table 38: United Kingdom Food Service Packaging Volume (K) Forecast, by Application 2020 & 2033
- Table 39: Germany Food Service Packaging Revenue (billion) Forecast, by Application 2020 & 2033
- Table 40: Germany Food Service Packaging Volume (K) Forecast, by Application 2020 & 2033
- Table 41: France Food Service Packaging Revenue (billion) Forecast, by Application 2020 & 2033
- Table 42: France Food Service Packaging Volume (K) Forecast, by Application 2020 & 2033
- Table 43: Italy Food Service Packaging Revenue (billion) Forecast, by Application 2020 & 2033
- Table 44: Italy Food Service Packaging Volume (K) Forecast, by Application 2020 & 2033
- Table 45: Spain Food Service Packaging Revenue (billion) Forecast, by Application 2020 & 2033
- Table 46: Spain Food Service Packaging Volume (K) Forecast, by Application 2020 & 2033
- Table 47: Russia Food Service Packaging Revenue (billion) Forecast, by Application 2020 & 2033
- Table 48: Russia Food Service Packaging Volume (K) Forecast, by Application 2020 & 2033
- Table 49: Benelux Food Service Packaging Revenue (billion) Forecast, by Application 2020 & 2033
- Table 50: Benelux Food Service Packaging Volume (K) Forecast, by Application 2020 & 2033
- Table 51: Nordics Food Service Packaging Revenue (billion) Forecast, by Application 2020 & 2033
- Table 52: Nordics Food Service Packaging Volume (K) Forecast, by Application 2020 & 2033
- Table 53: Rest of Europe Food Service Packaging Revenue (billion) Forecast, by Application 2020 & 2033
- Table 54: Rest of Europe Food Service Packaging Volume (K) Forecast, by Application 2020 & 2033
- Table 55: Global Food Service Packaging Revenue billion Forecast, by Application 2020 & 2033
- Table 56: Global Food Service Packaging Volume K Forecast, by Application 2020 & 2033
- Table 57: Global Food Service Packaging Revenue billion Forecast, by Type 2020 & 2033
- Table 58: Global Food Service Packaging Volume K Forecast, by Type 2020 & 2033
- Table 59: Global Food Service Packaging Revenue billion Forecast, by Country 2020 & 2033
- Table 60: Global Food Service Packaging Volume K Forecast, by Country 2020 & 2033
- Table 61: Turkey Food Service Packaging Revenue (billion) Forecast, by Application 2020 & 2033
- Table 62: Turkey Food Service Packaging Volume (K) Forecast, by Application 2020 & 2033
- Table 63: Israel Food Service Packaging Revenue (billion) Forecast, by Application 2020 & 2033
- Table 64: Israel Food Service Packaging Volume (K) Forecast, by Application 2020 & 2033
- Table 65: GCC Food Service Packaging Revenue (billion) Forecast, by Application 2020 & 2033
- Table 66: GCC Food Service Packaging Volume (K) Forecast, by Application 2020 & 2033
- Table 67: North Africa Food Service Packaging Revenue (billion) Forecast, by Application 2020 & 2033
- Table 68: North Africa Food Service Packaging Volume (K) Forecast, by Application 2020 & 2033
- Table 69: South Africa Food Service Packaging Revenue (billion) Forecast, by Application 2020 & 2033
- Table 70: South Africa Food Service Packaging Volume (K) Forecast, by Application 2020 & 2033
- Table 71: Rest of Middle East & Africa Food Service Packaging Revenue (billion) Forecast, by Application 2020 & 2033
- Table 72: Rest of Middle East & Africa Food Service Packaging Volume (K) Forecast, by Application 2020 & 2033
- Table 73: Global Food Service Packaging Revenue billion Forecast, by Application 2020 & 2033
- Table 74: Global Food Service Packaging Volume K Forecast, by Application 2020 & 2033
- Table 75: Global Food Service Packaging Revenue billion Forecast, by Type 2020 & 2033
- Table 76: Global Food Service Packaging Volume K Forecast, by Type 2020 & 2033
- Table 77: Global Food Service Packaging Revenue billion Forecast, by Country 2020 & 2033
- Table 78: Global Food Service Packaging Volume K Forecast, by Country 2020 & 2033
- Table 79: China Food Service Packaging Revenue (billion) Forecast, by Application 2020 & 2033
- Table 80: China Food Service Packaging Volume (K) Forecast, by Application 2020 & 2033
- Table 81: India Food Service Packaging Revenue (billion) Forecast, by Application 2020 & 2033
- Table 82: India Food Service Packaging Volume (K) Forecast, by Application 2020 & 2033
- Table 83: Japan Food Service Packaging Revenue (billion) Forecast, by Application 2020 & 2033
- Table 84: Japan Food Service Packaging Volume (K) Forecast, by Application 2020 & 2033
- Table 85: South Korea Food Service Packaging Revenue (billion) Forecast, by Application 2020 & 2033
- Table 86: South Korea Food Service Packaging Volume (K) Forecast, by Application 2020 & 2033
- Table 87: ASEAN Food Service Packaging Revenue (billion) Forecast, by Application 2020 & 2033
- Table 88: ASEAN Food Service Packaging Volume (K) Forecast, by Application 2020 & 2033
- Table 89: Oceania Food Service Packaging Revenue (billion) Forecast, by Application 2020 & 2033
- Table 90: Oceania Food Service Packaging Volume (K) Forecast, by Application 2020 & 2033
- Table 91: Rest of Asia Pacific Food Service Packaging Revenue (billion) Forecast, by Application 2020 & 2033
- Table 92: Rest of Asia Pacific Food Service Packaging Volume (K) Forecast, by Application 2020 & 2033
Frequently Asked Questions
1. What is the projected Compound Annual Growth Rate (CAGR) of the Food Service Packaging?
The projected CAGR is approximately 5.5%.
2. Which companies are prominent players in the Food Service Packaging?
Key companies in the market include Amcor, Dupont, Westrock, Ball, Huhtamaki Oyj, Sealed Air, Berry Plastic, Reynolds Group Holding, International Paper, Ds Smith, Genpak.
3. What are the main segments of the Food Service Packaging?
The market segments include Application, Type.
4. Can you provide details about the market size?
The market size is estimated to be USD 110.29 billion as of 2022.
5. What are some drivers contributing to market growth?
N/A
6. What are the notable trends driving market growth?
N/A
7. Are there any restraints impacting market growth?
N/A
8. Can you provide examples of recent developments in the market?
N/A
9. What pricing options are available for accessing the report?
Pricing options include single-user, multi-user, and enterprise licenses priced at USD 3950.00, USD 5925.00, and USD 7900.00 respectively.
10. Is the market size provided in terms of value or volume?
The market size is provided in terms of value, measured in billion and volume, measured in K.
11. Are there any specific market keywords associated with the report?
Yes, the market keyword associated with the report is "Food Service Packaging," which aids in identifying and referencing the specific market segment covered.
12. How do I determine which pricing option suits my needs best?
The pricing options vary based on user requirements and access needs. Individual users may opt for single-user licenses, while businesses requiring broader access may choose multi-user or enterprise licenses for cost-effective access to the report.
13. Are there any additional resources or data provided in the Food Service Packaging report?
While the report offers comprehensive insights, it's advisable to review the specific contents or supplementary materials provided to ascertain if additional resources or data are available.
14. How can I stay updated on further developments or reports in the Food Service Packaging?
To stay informed about further developments, trends, and reports in the Food Service Packaging, consider subscribing to industry newsletters, following relevant companies and organizations, or regularly checking reputable industry news sources and publications.
Methodology
Step 1 - Identification of Relevant Samples Size from Population Database


Step 2 - Approaches for Defining Global Market Size (Value, Volume* & Price*)

Note*: In applicable scenarios
Step 3 - Data Sources
Primary Research
- Web Analytics
- Survey Reports
- Research Institute
- Latest Research Reports
- Opinion Leaders
Secondary Research
- Annual Reports
- White Paper
- Latest Press Release
- Industry Association
- Paid Database
- Investor Presentations

Step 4 - Data Triangulation
Involves using different sources of information in order to increase the validity of a study
These sources are likely to be stakeholders in a program - participants, other researchers, program staff, other community members, and so on.
Then we put all data in single framework & apply various statistical tools to find out the dynamic on the market.
During the analysis stage, feedback from the stakeholder groups would be compared to determine areas of agreement as well as areas of divergence