

Key Insights
The global fortified food market is poised for significant expansion, driven by heightened consumer awareness of nutritional health and the increasing preference for convenient, health-oriented food choices. The market, projected to reach $191.2 billion by the base year 2025, is anticipated to grow at a Compound Annual Growth Rate (CAGR) of 6.63% between 2025 and 2033. This robust growth trajectory is underpinned by the rising incidence of micronutrient deficiencies globally, particularly in emerging economies. Government-led public health initiatives and the wider adoption of fortified food products by manufacturers are key accelerators. Leading industry players are leveraging their extensive distribution channels and established brand equity to serve a growing consumer base. While fortified cereals and dairy products currently lead market share, fortified beverages and snacks are experiencing rapid demand growth. Despite regulatory complexities and regional consumer perception variations, the market's outlook remains positive, propelled by a sustained focus on long-term health benefits and evolving consumer preferences.
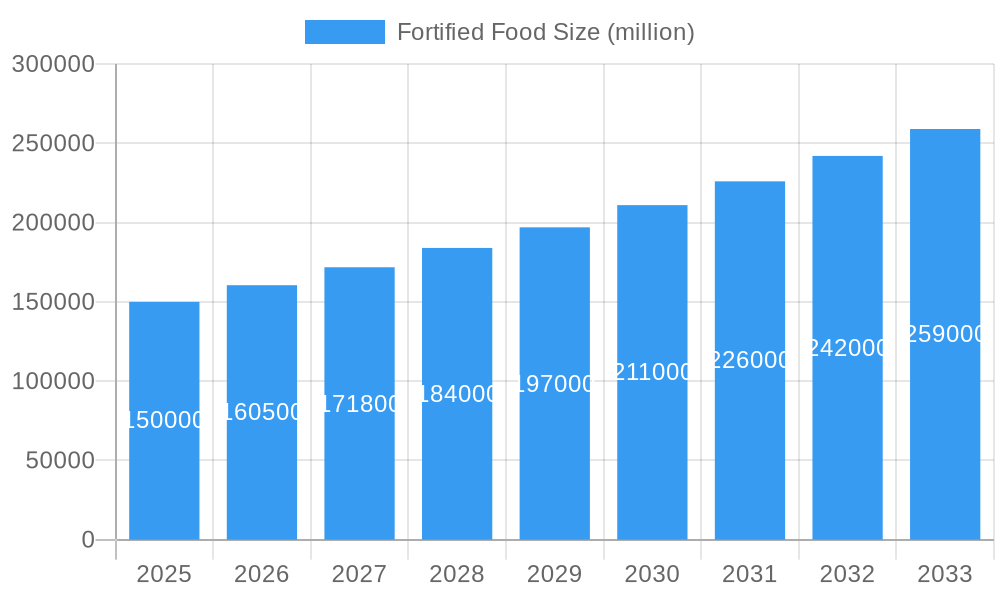
Fortified Food Market Size (In Billion)
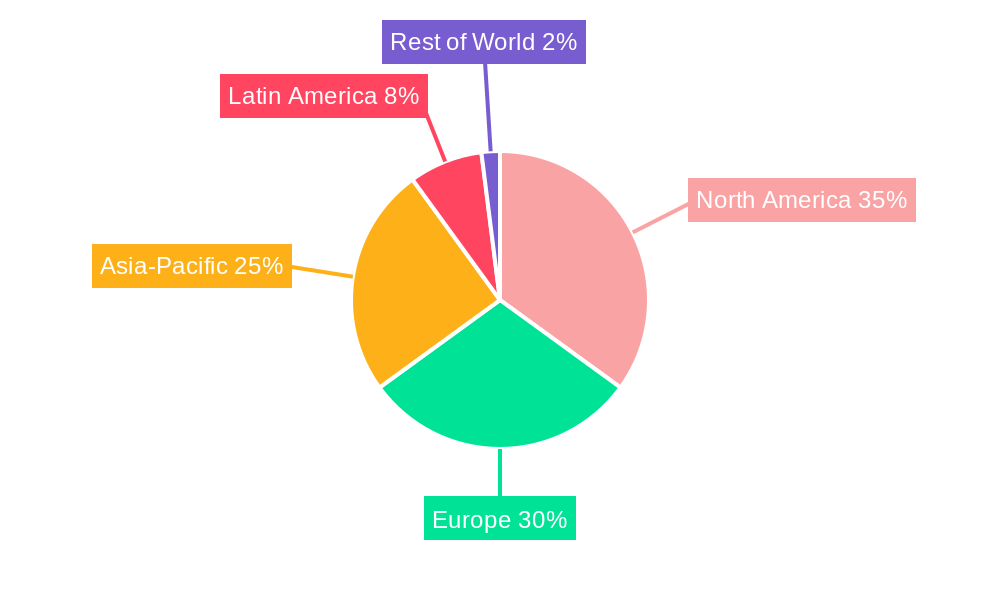
Geographically, North America and Europe presently lead the market, with substantial growth opportunities identified in the developing economies of Asia-Pacific and Latin America. Continued innovation in product development, including fortified options catering to specific dietary requirements and preferences such as gluten-free, vegan, and organic formulations, will be paramount for sustained market leadership. Furthermore, growing consumer emphasis on sustainability and ethical ingredient sourcing is influencing purchasing decisions, prompting manufacturers to embrace responsible operational practices. Intensified competition among key market participants, evidenced by increased investment in research and development, strategic alliances, and mergers and acquisitions, underscores the drive for competitive advantage. Effectively navigating the regulatory environment and adapting to dynamic consumer trends will be critical for enduring success in this evolving market.
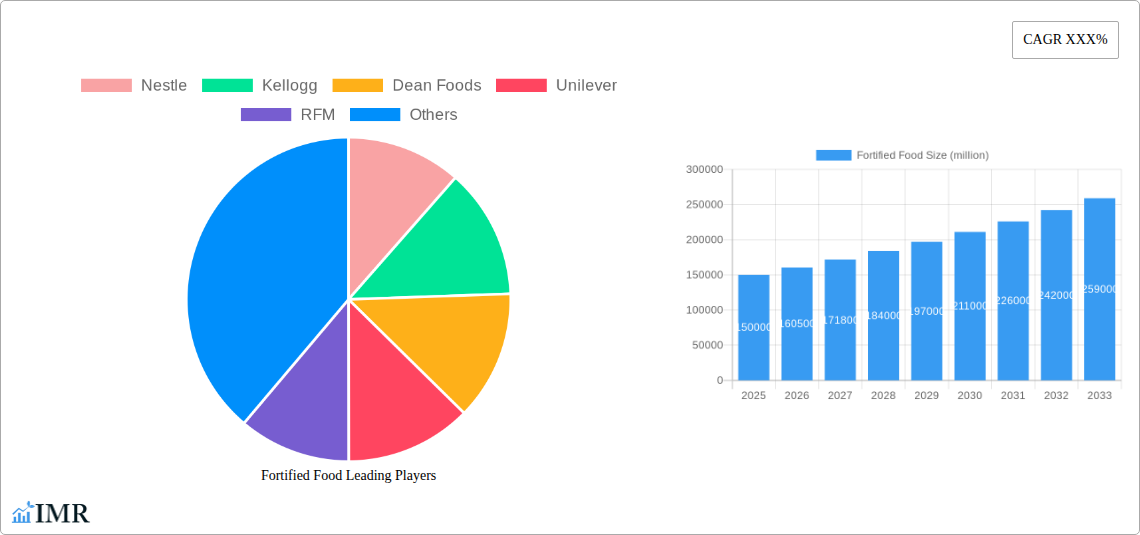
Fortified Food Company Market Share
Fortified Food Market Report: 2019-2033
This comprehensive report provides a detailed analysis of the fortified food market, offering invaluable insights for industry professionals, investors, and strategic decision-makers. The report covers the period 2019-2033, with a base year of 2025 and a forecast period of 2025-2033. The study leverages extensive primary and secondary research to deliver a robust understanding of market dynamics, growth trends, competitive landscape, and future opportunities. This report specifically targets the parent market of food and beverage and the child market of functional foods.
Fortified Food Market Dynamics & Structure
This section analyzes the market structure, identifying key players, their market share, and competitive dynamics. We examine technological advancements driving innovation, regulatory frameworks shaping market access, and the influence of substitute products. The impact of end-user demographics and M&A activities on market evolution are also thoroughly explored.
- Market Concentration: The market is moderately concentrated, with key players like Nestlé, Kellogg's, Unilever, and Kraft Foods holding significant shares. Nestlé's share is estimated at xx%, followed by Kellogg's at xx%, Unilever at xx%, and Kraft Foods at xx%. Smaller players collectively account for the remaining xx%.
- Technological Innovation: Technological advancements in fortification techniques, such as nano-encapsulation and micro-encapsulation, are driving product innovation and improving nutrient bioavailability. However, high R&D costs pose a barrier to entry for smaller players.
- Regulatory Framework: Stringent regulations regarding fortification levels and labeling requirements vary across regions, impacting market access and product development. Compliance costs represent a significant challenge for many companies.
- Competitive Substitutes: Fortified foods compete with other functional foods and dietary supplements, creating a complex competitive landscape. Consumer preference shifts towards natural and organic products pose an additional competitive pressure.
- M&A Activity: The number of M&A deals in the fortified food sector during 2019-2024 totaled xx deals, with a value of xx million USD. These deals primarily involved smaller players being acquired by larger corporations to expand their product portfolio and market reach.
Fortified Food Growth Trends & Insights
This section provides a detailed analysis of the fortified food market's growth trajectory, drawing on extensive data and market intelligence. We explore market size evolution, adoption rates, technological disruptions, and changing consumer behaviors, providing actionable insights into market trends and future potential. The market size (in million units) is projected to reach xx million units in 2025, growing at a CAGR of xx% from 2025 to 2033. Market penetration is estimated at xx% in 2025 and projected to reach xx% by 2033. The increasing awareness of nutritional deficiencies and the growing demand for convenient, healthy food options are key drivers. The increasing prevalence of chronic diseases is further fueling the demand. Technological disruptions, such as personalized nutrition and advanced fortification technologies, will significantly impact the market in the forecast period.
Dominant Regions, Countries, or Segments in Fortified Food
This section identifies the leading regions and segments driving market growth. We analyze the factors contributing to their dominance, such as economic policies, infrastructure development, and consumer preferences. North America currently holds the largest market share, followed by Europe and Asia-Pacific. The high disposable income, increasing health consciousness, and strong regulatory support in North America contribute significantly to its dominance.
- North America: Strong consumer demand for fortified foods driven by health consciousness, high disposable income, and well-established distribution networks.
- Europe: Growing awareness of nutritional deficiencies and the rising adoption of functional foods.
- Asia-Pacific: Rapid economic growth, increasing urbanization, and rising health awareness are driving the market expansion in the region.
Fortified Food Product Landscape
The fortified food product landscape is characterized by a wide range of products, including cereals, dairy products, beverages, and snacks. Innovations focus on enhancing nutrient bioavailability, improving taste and texture, and developing convenient formats. Companies are increasingly adopting sustainable sourcing practices and employing clean-label formulations to cater to consumer demand for transparency and natural ingredients. For example, the introduction of fortified plant-based alternatives to dairy products has been a significant innovation.
Key Drivers, Barriers & Challenges in Fortified Food
Key Drivers: The growing prevalence of micronutrient deficiencies, rising consumer awareness of health and wellness, and the increasing demand for functional foods are key drivers of market growth. Government initiatives promoting food fortification and the development of innovative fortification technologies further contribute to market expansion.
Challenges & Restraints: High production costs, stringent regulatory requirements, and the potential for negative consumer perceptions regarding artificial ingredients pose significant challenges. The stability of added nutrients, especially during storage and processing, is another key concern. Supply chain disruptions and the fluctuating prices of raw materials also impact profitability.
Emerging Opportunities in Fortified Food
Emerging opportunities lie in the development of personalized nutrition products, the expansion into untapped markets in developing countries, and the growing demand for fortified foods targeting specific health conditions. The increasing demand for organic and plant-based fortified foods also presents significant growth opportunities.
Growth Accelerators in the Fortified Food Industry
Strategic partnerships between food manufacturers and nutritional supplement companies, technological advancements that improve nutrient bioavailability, and the expansion of distribution networks into underserved markets are key growth accelerators. Investing in research and development to improve the taste and texture of fortified foods will also enhance market penetration.
Key Players Shaping the Fortified Food Market
- Nestlé
- Kellogg's
- Dean Foods
- Unilever
- RFM
- Kraft Foods
- Meiji Group
- Red Bull
Notable Milestones in Fortified Food Sector
- 2020: Increased investment in research and development by major players focused on enhancing nutrient bioavailability.
- 2021: Several new product launches targeting specific health benefits, including immune support and cognitive function.
- 2022: The introduction of new regulations in several countries regarding labeling and fortification levels.
- 2023: A significant increase in the number of M&A deals as large corporations expand their product portfolios in the fortified food sector.
In-Depth Fortified Food Market Outlook
The fortified food market is poised for significant growth in the coming years, driven by continued consumer demand, technological advancements, and supportive government policies. Strategic partnerships, investments in R&D, and the development of innovative products tailored to specific consumer needs will be crucial for success. The market is expected to reach xx million units by 2033, presenting substantial opportunities for companies to capitalize on this expanding sector.
Fortified Food Segmentation
-
1. Application
- 1.1. Milk Products
- 1.2. Cereals and Cereal Based Products
- 1.3. Confectionaries
- 1.4. Infant Formulas
- 1.5. Fats and Oils
- 1.6. Others Includes Tea
-
2. Type
- 2.1. Zinc
- 2.2. Iron
- 2.3. Copper
- 2.4. Selenium
- 2.5. Folic Acid
- 2.6. Docosahexaenoic Acid
- 2.7. Others
Fortified Food Segmentation By Geography
-
1. North America
- 1.1. United States
- 1.2. Canada
- 1.3. Mexico
-
2. South America
- 2.1. Brazil
- 2.2. Argentina
- 2.3. Rest of South America
-
3. Europe
- 3.1. United Kingdom
- 3.2. Germany
- 3.3. France
- 3.4. Italy
- 3.5. Spain
- 3.6. Russia
- 3.7. Benelux
- 3.8. Nordics
- 3.9. Rest of Europe
-
4. Middle East & Africa
- 4.1. Turkey
- 4.2. Israel
- 4.3. GCC
- 4.4. North Africa
- 4.5. South Africa
- 4.6. Rest of Middle East & Africa
-
5. Asia Pacific
- 5.1. China
- 5.2. India
- 5.3. Japan
- 5.4. South Korea
- 5.5. ASEAN
- 5.6. Oceania
- 5.7. Rest of Asia Pacific
Fortified Food Regional Market Share
Geographic Coverage of Fortified Food
Fortified Food REPORT HIGHLIGHTS
| Aspects | Details |
|---|---|
| Study Period | 2020-2034 |
| Base Year | 2025 |
| Estimated Year | 2026 |
| Forecast Period | 2026-2034 |
| Historical Period | 2020-2025 |
| Growth Rate | CAGR of 6.63% from 2020-2034 |
| Segmentation |
|
Table of Contents
- 1. Introduction
- 1.1. Research Scope
- 1.2. Market Segmentation
- 1.3. Research Methodology
- 1.4. Definitions and Assumptions
- 2. Executive Summary
- 2.1. Introduction
- 3. Market Dynamics
- 3.1. Introduction
- 3.2. Market Drivers
- 3.3. Market Restrains
- 3.4. Market Trends
- 4. Market Factor Analysis
- 4.1. Porters Five Forces
- 4.2. Supply/Value Chain
- 4.3. PESTEL analysis
- 4.4. Market Entropy
- 4.5. Patent/Trademark Analysis
- 5. Global Fortified Food Analysis, Insights and Forecast, 2020-2032
- 5.1. Market Analysis, Insights and Forecast - by Application
- 5.1.1. Milk Products
- 5.1.2. Cereals and Cereal Based Products
- 5.1.3. Confectionaries
- 5.1.4. Infant Formulas
- 5.1.5. Fats and Oils
- 5.1.6. Others Includes Tea
- 5.2. Market Analysis, Insights and Forecast - by Type
- 5.2.1. Zinc
- 5.2.2. Iron
- 5.2.3. Copper
- 5.2.4. Selenium
- 5.2.5. Folic Acid
- 5.2.6. Docosahexaenoic Acid
- 5.2.7. Others
- 5.3. Market Analysis, Insights and Forecast - by Region
- 5.3.1. North America
- 5.3.2. South America
- 5.3.3. Europe
- 5.3.4. Middle East & Africa
- 5.3.5. Asia Pacific
- 5.1. Market Analysis, Insights and Forecast - by Application
- 6. North America Fortified Food Analysis, Insights and Forecast, 2020-2032
- 6.1. Market Analysis, Insights and Forecast - by Application
- 6.1.1. Milk Products
- 6.1.2. Cereals and Cereal Based Products
- 6.1.3. Confectionaries
- 6.1.4. Infant Formulas
- 6.1.5. Fats and Oils
- 6.1.6. Others Includes Tea
- 6.2. Market Analysis, Insights and Forecast - by Type
- 6.2.1. Zinc
- 6.2.2. Iron
- 6.2.3. Copper
- 6.2.4. Selenium
- 6.2.5. Folic Acid
- 6.2.6. Docosahexaenoic Acid
- 6.2.7. Others
- 6.1. Market Analysis, Insights and Forecast - by Application
- 7. South America Fortified Food Analysis, Insights and Forecast, 2020-2032
- 7.1. Market Analysis, Insights and Forecast - by Application
- 7.1.1. Milk Products
- 7.1.2. Cereals and Cereal Based Products
- 7.1.3. Confectionaries
- 7.1.4. Infant Formulas
- 7.1.5. Fats and Oils
- 7.1.6. Others Includes Tea
- 7.2. Market Analysis, Insights and Forecast - by Type
- 7.2.1. Zinc
- 7.2.2. Iron
- 7.2.3. Copper
- 7.2.4. Selenium
- 7.2.5. Folic Acid
- 7.2.6. Docosahexaenoic Acid
- 7.2.7. Others
- 7.1. Market Analysis, Insights and Forecast - by Application
- 8. Europe Fortified Food Analysis, Insights and Forecast, 2020-2032
- 8.1. Market Analysis, Insights and Forecast - by Application
- 8.1.1. Milk Products
- 8.1.2. Cereals and Cereal Based Products
- 8.1.3. Confectionaries
- 8.1.4. Infant Formulas
- 8.1.5. Fats and Oils
- 8.1.6. Others Includes Tea
- 8.2. Market Analysis, Insights and Forecast - by Type
- 8.2.1. Zinc
- 8.2.2. Iron
- 8.2.3. Copper
- 8.2.4. Selenium
- 8.2.5. Folic Acid
- 8.2.6. Docosahexaenoic Acid
- 8.2.7. Others
- 8.1. Market Analysis, Insights and Forecast - by Application
- 9. Middle East & Africa Fortified Food Analysis, Insights and Forecast, 2020-2032
- 9.1. Market Analysis, Insights and Forecast - by Application
- 9.1.1. Milk Products
- 9.1.2. Cereals and Cereal Based Products
- 9.1.3. Confectionaries
- 9.1.4. Infant Formulas
- 9.1.5. Fats and Oils
- 9.1.6. Others Includes Tea
- 9.2. Market Analysis, Insights and Forecast - by Type
- 9.2.1. Zinc
- 9.2.2. Iron
- 9.2.3. Copper
- 9.2.4. Selenium
- 9.2.5. Folic Acid
- 9.2.6. Docosahexaenoic Acid
- 9.2.7. Others
- 9.1. Market Analysis, Insights and Forecast - by Application
- 10. Asia Pacific Fortified Food Analysis, Insights and Forecast, 2020-2032
- 10.1. Market Analysis, Insights and Forecast - by Application
- 10.1.1. Milk Products
- 10.1.2. Cereals and Cereal Based Products
- 10.1.3. Confectionaries
- 10.1.4. Infant Formulas
- 10.1.5. Fats and Oils
- 10.1.6. Others Includes Tea
- 10.2. Market Analysis, Insights and Forecast - by Type
- 10.2.1. Zinc
- 10.2.2. Iron
- 10.2.3. Copper
- 10.2.4. Selenium
- 10.2.5. Folic Acid
- 10.2.6. Docosahexaenoic Acid
- 10.2.7. Others
- 10.1. Market Analysis, Insights and Forecast - by Application
- 11. Competitive Analysis
- 11.1. Global Market Share Analysis 2025
- 11.2. Company Profiles
- 11.2.1 Nestle
- 11.2.1.1. Overview
- 11.2.1.2. Products
- 11.2.1.3. SWOT Analysis
- 11.2.1.4. Recent Developments
- 11.2.1.5. Financials (Based on Availability)
- 11.2.2 Kellogg
- 11.2.2.1. Overview
- 11.2.2.2. Products
- 11.2.2.3. SWOT Analysis
- 11.2.2.4. Recent Developments
- 11.2.2.5. Financials (Based on Availability)
- 11.2.3 Dean Foods
- 11.2.3.1. Overview
- 11.2.3.2. Products
- 11.2.3.3. SWOT Analysis
- 11.2.3.4. Recent Developments
- 11.2.3.5. Financials (Based on Availability)
- 11.2.4 Unilever
- 11.2.4.1. Overview
- 11.2.4.2. Products
- 11.2.4.3. SWOT Analysis
- 11.2.4.4. Recent Developments
- 11.2.4.5. Financials (Based on Availability)
- 11.2.5 RFM
- 11.2.5.1. Overview
- 11.2.5.2. Products
- 11.2.5.3. SWOT Analysis
- 11.2.5.4. Recent Developments
- 11.2.5.5. Financials (Based on Availability)
- 11.2.6 Kraft Foods
- 11.2.6.1. Overview
- 11.2.6.2. Products
- 11.2.6.3. SWOT Analysis
- 11.2.6.4. Recent Developments
- 11.2.6.5. Financials (Based on Availability)
- 11.2.7 Meiji Group
- 11.2.7.1. Overview
- 11.2.7.2. Products
- 11.2.7.3. SWOT Analysis
- 11.2.7.4. Recent Developments
- 11.2.7.5. Financials (Based on Availability)
- 11.2.8 Red Bull
- 11.2.8.1. Overview
- 11.2.8.2. Products
- 11.2.8.3. SWOT Analysis
- 11.2.8.4. Recent Developments
- 11.2.8.5. Financials (Based on Availability)
- 11.2.1 Nestle
List of Figures
- Figure 1: Global Fortified Food Revenue Breakdown (billion, %) by Region 2025 & 2033
- Figure 2: North America Fortified Food Revenue (billion), by Application 2025 & 2033
- Figure 3: North America Fortified Food Revenue Share (%), by Application 2025 & 2033
- Figure 4: North America Fortified Food Revenue (billion), by Type 2025 & 2033
- Figure 5: North America Fortified Food Revenue Share (%), by Type 2025 & 2033
- Figure 6: North America Fortified Food Revenue (billion), by Country 2025 & 2033
- Figure 7: North America Fortified Food Revenue Share (%), by Country 2025 & 2033
- Figure 8: South America Fortified Food Revenue (billion), by Application 2025 & 2033
- Figure 9: South America Fortified Food Revenue Share (%), by Application 2025 & 2033
- Figure 10: South America Fortified Food Revenue (billion), by Type 2025 & 2033
- Figure 11: South America Fortified Food Revenue Share (%), by Type 2025 & 2033
- Figure 12: South America Fortified Food Revenue (billion), by Country 2025 & 2033
- Figure 13: South America Fortified Food Revenue Share (%), by Country 2025 & 2033
- Figure 14: Europe Fortified Food Revenue (billion), by Application 2025 & 2033
- Figure 15: Europe Fortified Food Revenue Share (%), by Application 2025 & 2033
- Figure 16: Europe Fortified Food Revenue (billion), by Type 2025 & 2033
- Figure 17: Europe Fortified Food Revenue Share (%), by Type 2025 & 2033
- Figure 18: Europe Fortified Food Revenue (billion), by Country 2025 & 2033
- Figure 19: Europe Fortified Food Revenue Share (%), by Country 2025 & 2033
- Figure 20: Middle East & Africa Fortified Food Revenue (billion), by Application 2025 & 2033
- Figure 21: Middle East & Africa Fortified Food Revenue Share (%), by Application 2025 & 2033
- Figure 22: Middle East & Africa Fortified Food Revenue (billion), by Type 2025 & 2033
- Figure 23: Middle East & Africa Fortified Food Revenue Share (%), by Type 2025 & 2033
- Figure 24: Middle East & Africa Fortified Food Revenue (billion), by Country 2025 & 2033
- Figure 25: Middle East & Africa Fortified Food Revenue Share (%), by Country 2025 & 2033
- Figure 26: Asia Pacific Fortified Food Revenue (billion), by Application 2025 & 2033
- Figure 27: Asia Pacific Fortified Food Revenue Share (%), by Application 2025 & 2033
- Figure 28: Asia Pacific Fortified Food Revenue (billion), by Type 2025 & 2033
- Figure 29: Asia Pacific Fortified Food Revenue Share (%), by Type 2025 & 2033
- Figure 30: Asia Pacific Fortified Food Revenue (billion), by Country 2025 & 2033
- Figure 31: Asia Pacific Fortified Food Revenue Share (%), by Country 2025 & 2033
List of Tables
- Table 1: Global Fortified Food Revenue billion Forecast, by Application 2020 & 2033
- Table 2: Global Fortified Food Revenue billion Forecast, by Type 2020 & 2033
- Table 3: Global Fortified Food Revenue billion Forecast, by Region 2020 & 2033
- Table 4: Global Fortified Food Revenue billion Forecast, by Application 2020 & 2033
- Table 5: Global Fortified Food Revenue billion Forecast, by Type 2020 & 2033
- Table 6: Global Fortified Food Revenue billion Forecast, by Country 2020 & 2033
- Table 7: United States Fortified Food Revenue (billion) Forecast, by Application 2020 & 2033
- Table 8: Canada Fortified Food Revenue (billion) Forecast, by Application 2020 & 2033
- Table 9: Mexico Fortified Food Revenue (billion) Forecast, by Application 2020 & 2033
- Table 10: Global Fortified Food Revenue billion Forecast, by Application 2020 & 2033
- Table 11: Global Fortified Food Revenue billion Forecast, by Type 2020 & 2033
- Table 12: Global Fortified Food Revenue billion Forecast, by Country 2020 & 2033
- Table 13: Brazil Fortified Food Revenue (billion) Forecast, by Application 2020 & 2033
- Table 14: Argentina Fortified Food Revenue (billion) Forecast, by Application 2020 & 2033
- Table 15: Rest of South America Fortified Food Revenue (billion) Forecast, by Application 2020 & 2033
- Table 16: Global Fortified Food Revenue billion Forecast, by Application 2020 & 2033
- Table 17: Global Fortified Food Revenue billion Forecast, by Type 2020 & 2033
- Table 18: Global Fortified Food Revenue billion Forecast, by Country 2020 & 2033
- Table 19: United Kingdom Fortified Food Revenue (billion) Forecast, by Application 2020 & 2033
- Table 20: Germany Fortified Food Revenue (billion) Forecast, by Application 2020 & 2033
- Table 21: France Fortified Food Revenue (billion) Forecast, by Application 2020 & 2033
- Table 22: Italy Fortified Food Revenue (billion) Forecast, by Application 2020 & 2033
- Table 23: Spain Fortified Food Revenue (billion) Forecast, by Application 2020 & 2033
- Table 24: Russia Fortified Food Revenue (billion) Forecast, by Application 2020 & 2033
- Table 25: Benelux Fortified Food Revenue (billion) Forecast, by Application 2020 & 2033
- Table 26: Nordics Fortified Food Revenue (billion) Forecast, by Application 2020 & 2033
- Table 27: Rest of Europe Fortified Food Revenue (billion) Forecast, by Application 2020 & 2033
- Table 28: Global Fortified Food Revenue billion Forecast, by Application 2020 & 2033
- Table 29: Global Fortified Food Revenue billion Forecast, by Type 2020 & 2033
- Table 30: Global Fortified Food Revenue billion Forecast, by Country 2020 & 2033
- Table 31: Turkey Fortified Food Revenue (billion) Forecast, by Application 2020 & 2033
- Table 32: Israel Fortified Food Revenue (billion) Forecast, by Application 2020 & 2033
- Table 33: GCC Fortified Food Revenue (billion) Forecast, by Application 2020 & 2033
- Table 34: North Africa Fortified Food Revenue (billion) Forecast, by Application 2020 & 2033
- Table 35: South Africa Fortified Food Revenue (billion) Forecast, by Application 2020 & 2033
- Table 36: Rest of Middle East & Africa Fortified Food Revenue (billion) Forecast, by Application 2020 & 2033
- Table 37: Global Fortified Food Revenue billion Forecast, by Application 2020 & 2033
- Table 38: Global Fortified Food Revenue billion Forecast, by Type 2020 & 2033
- Table 39: Global Fortified Food Revenue billion Forecast, by Country 2020 & 2033
- Table 40: China Fortified Food Revenue (billion) Forecast, by Application 2020 & 2033
- Table 41: India Fortified Food Revenue (billion) Forecast, by Application 2020 & 2033
- Table 42: Japan Fortified Food Revenue (billion) Forecast, by Application 2020 & 2033
- Table 43: South Korea Fortified Food Revenue (billion) Forecast, by Application 2020 & 2033
- Table 44: ASEAN Fortified Food Revenue (billion) Forecast, by Application 2020 & 2033
- Table 45: Oceania Fortified Food Revenue (billion) Forecast, by Application 2020 & 2033
- Table 46: Rest of Asia Pacific Fortified Food Revenue (billion) Forecast, by Application 2020 & 2033
Frequently Asked Questions
1. What is the projected Compound Annual Growth Rate (CAGR) of the Fortified Food?
The projected CAGR is approximately 6.63%.
2. Which companies are prominent players in the Fortified Food?
Key companies in the market include Nestle, Kellogg, Dean Foods, Unilever, RFM, Kraft Foods, Meiji Group, Red Bull.
3. What are the main segments of the Fortified Food?
The market segments include Application, Type.
4. Can you provide details about the market size?
The market size is estimated to be USD 191.2 billion as of 2022.
5. What are some drivers contributing to market growth?
N/A
6. What are the notable trends driving market growth?
N/A
7. Are there any restraints impacting market growth?
N/A
8. Can you provide examples of recent developments in the market?
N/A
9. What pricing options are available for accessing the report?
Pricing options include single-user, multi-user, and enterprise licenses priced at USD 3950.00, USD 5925.00, and USD 7900.00 respectively.
10. Is the market size provided in terms of value or volume?
The market size is provided in terms of value, measured in billion.
11. Are there any specific market keywords associated with the report?
Yes, the market keyword associated with the report is "Fortified Food," which aids in identifying and referencing the specific market segment covered.
12. How do I determine which pricing option suits my needs best?
The pricing options vary based on user requirements and access needs. Individual users may opt for single-user licenses, while businesses requiring broader access may choose multi-user or enterprise licenses for cost-effective access to the report.
13. Are there any additional resources or data provided in the Fortified Food report?
While the report offers comprehensive insights, it's advisable to review the specific contents or supplementary materials provided to ascertain if additional resources or data are available.
14. How can I stay updated on further developments or reports in the Fortified Food?
To stay informed about further developments, trends, and reports in the Fortified Food, consider subscribing to industry newsletters, following relevant companies and organizations, or regularly checking reputable industry news sources and publications.
Methodology
Step 1 - Identification of Relevant Samples Size from Population Database


Step 2 - Approaches for Defining Global Market Size (Value, Volume* & Price*)

Note*: In applicable scenarios
Step 3 - Data Sources
Primary Research
- Web Analytics
- Survey Reports
- Research Institute
- Latest Research Reports
- Opinion Leaders
Secondary Research
- Annual Reports
- White Paper
- Latest Press Release
- Industry Association
- Paid Database
- Investor Presentations

Step 4 - Data Triangulation
Involves using different sources of information in order to increase the validity of a study
These sources are likely to be stakeholders in a program - participants, other researchers, program staff, other community members, and so on.
Then we put all data in single framework & apply various statistical tools to find out the dynamic on the market.
During the analysis stage, feedback from the stakeholder groups would be compared to determine areas of agreement as well as areas of divergence