

Key Insights
The global fruit fillings market is poised for significant expansion, projected to reach USD 1.86 billion in 2025. This robust growth is fueled by an anticipated Compound Annual Growth Rate (CAGR) of 5.29% during the forecast period of 2025-2033. This upward trajectory is primarily driven by evolving consumer preferences towards healthier and more natural food options, coupled with the increasing demand for convenient and versatile food products. The burgeoning bakery and confectionery industries, alongside a growing interest in innovative dairy and beverage applications, are key contributors to this market surge. Furthermore, the expanding food service sector and the rising popularity of ready-to-eat meals and snacks that incorporate fruit fillings are expected to sustain this positive momentum.
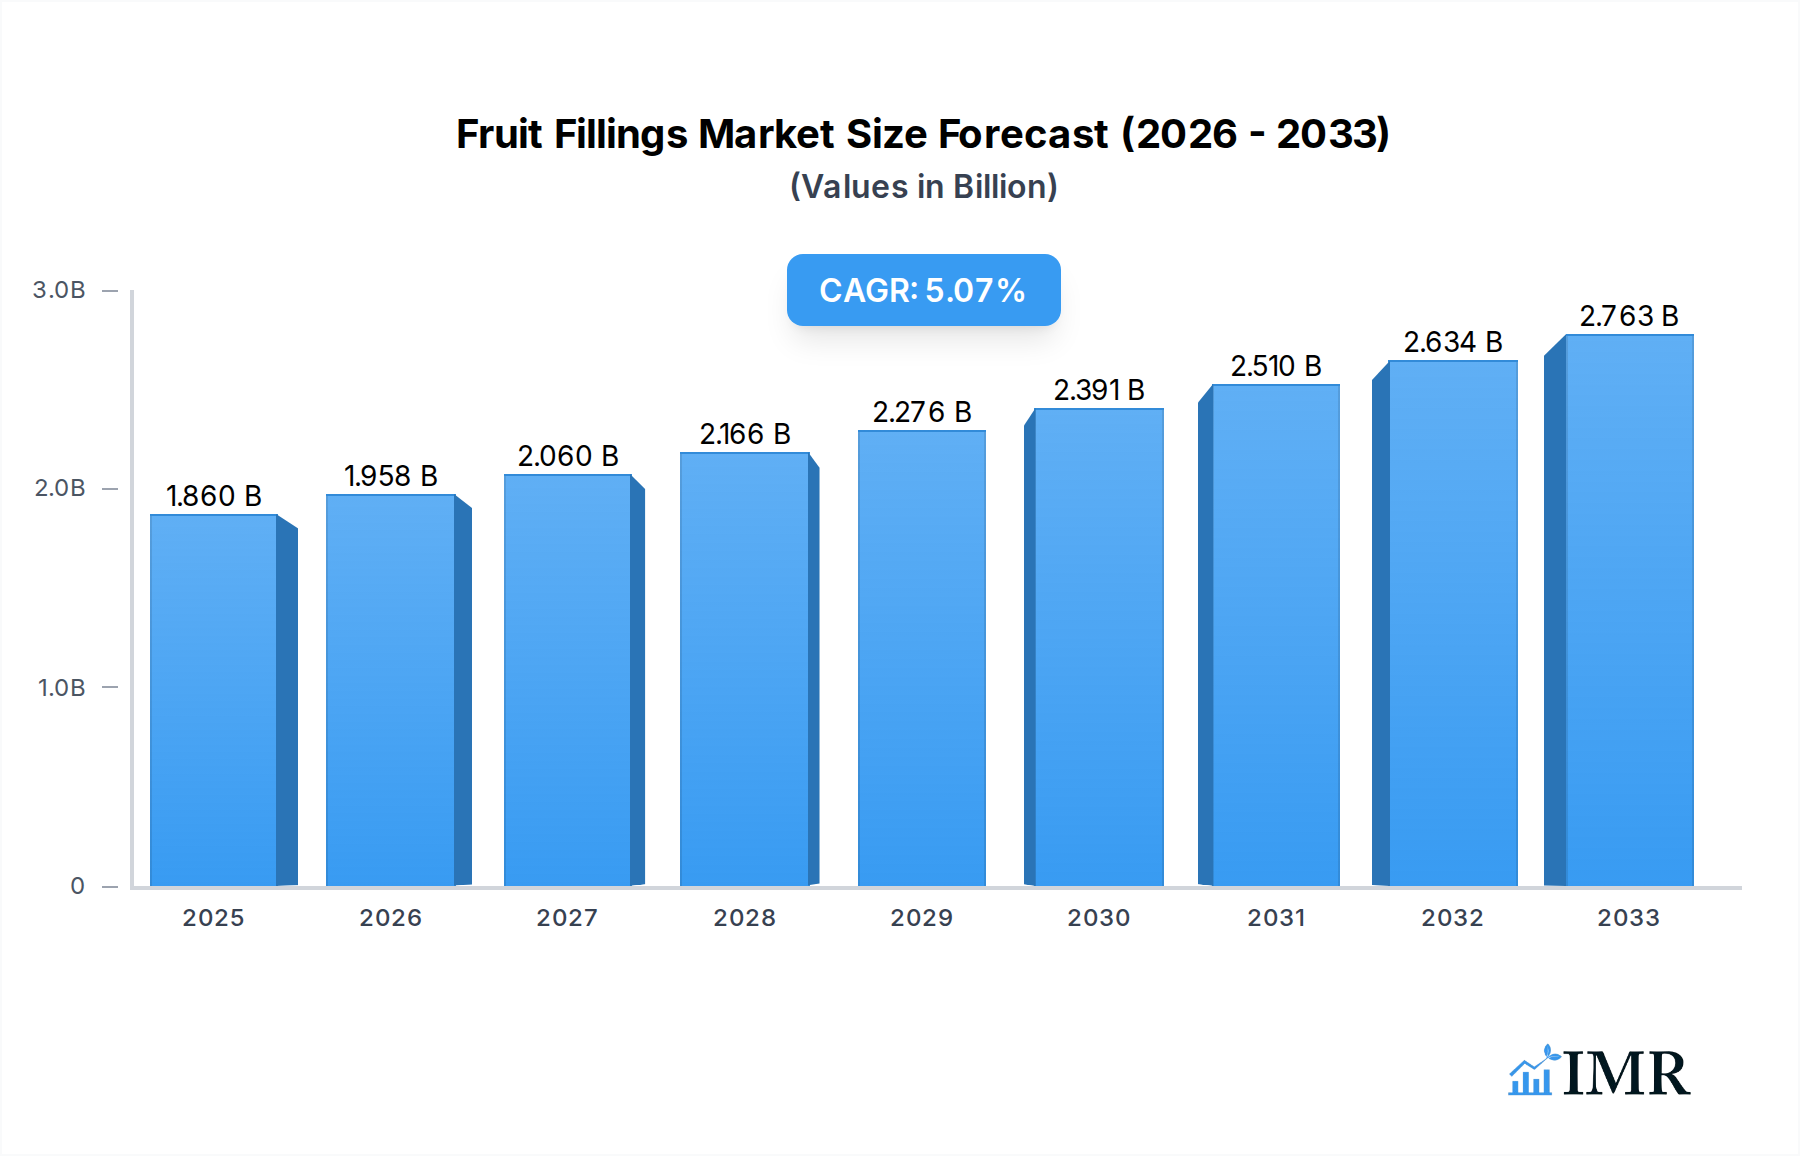
Fruit Fillings Market Size (In Billion)
The market segmentation reveals a dynamic landscape with diverse applications and fruit types catering to varied consumer tastes. The Commercial segment is expected to lead in terms of volume, driven by large-scale food manufacturers, while the Household segment demonstrates growing potential as consumers seek to enhance their home-baked goods. Key fruit types like Strawberry, Pineapple, and Apple dominate the market, reflecting their widespread appeal and versatility in various culinary creations. However, emerging trends showcase a growing interest in exotic and less common fruits, presenting opportunities for market diversification. Geographic expansion, particularly in the Asia Pacific and Rest of Europe regions, is anticipated due to increasing disposable incomes and a growing awareness of processed food products. Despite the positive outlook, challenges such as fluctuating raw material prices and stringent regulatory requirements for food additives could pose minor restraints to the market's unhindered growth.

Fruit Fillings Company Market Share
Report Description: Global Fruit Fillings Market Analysis 2019-2033
Unlock the potential of the global fruit fillings market with this comprehensive report. Delve into a detailed analysis of market dynamics, growth trajectories, and emerging opportunities within the commercial and household application segments, with a specific focus on popular fruit types including strawberry, pineapple, apple, peach, and blackberry. This report provides indispensable insights for industry professionals, manufacturers, distributors, and investors looking to navigate and capitalize on the evolving landscape of fruit fillings.
Fruit Fillings Market Dynamics & Structure
The global fruit fillings market exhibits a moderately concentrated structure, characterized by the strategic presence of key players like Baldwin Richardson Foods, Fruit Crown, Zentis, and Agrana, alongside emerging entities. Technological innovation is a significant driver, particularly in developing shelf-stable, natural, and reduced-sugar formulations to meet evolving consumer demands. Regulatory frameworks, primarily focused on food safety standards and ingredient labeling, are becoming increasingly stringent, influencing product development and market entry strategies. Competitive product substitutes, such as fresh fruit and other dessert toppings, exert pressure, necessitating continuous innovation in taste, texture, and convenience. End-user demographics are shifting, with a growing demand for premium, artisanal, and plant-based options, particularly from health-conscious millennials and Gen Z consumers. Mergers and acquisitions (M&A) are a recurring theme, with larger companies acquiring innovative startups or consolidating their market position. For instance, the historical period (2019-2024) saw approximately 15 significant M&A deals valued at over $1.5 billion collectively, aimed at expanding product portfolios and geographic reach. Innovation barriers include the high cost of research and development for novel preservation techniques and the challenge of sourcing consistent, high-quality fruit ingredients globally.
Fruit Fillings Growth Trends & Insights
The global fruit fillings market is poised for robust expansion, driven by a confluence of evolving consumer preferences, technological advancements, and a burgeoning food industry. The market size, estimated at $23.5 billion in the base year 2025, is projected to reach $35.8 billion by 2033, exhibiting a Compound Annual Growth Rate (CAGR) of 5.3% during the forecast period (2025–2033). This growth trajectory is underpinned by a steady increase in adoption rates across both commercial and household applications. In the commercial sector, the escalating demand for convenient and ready-to-use ingredients in baked goods, dairy products, and confectionery continues to fuel market penetration. This is further amplified by the rising popularity of artisanal bakeries and food service establishments seeking consistent quality and diverse flavor profiles.
Consumer behavior shifts are playing a pivotal role. There is a discernible trend towards healthier options, leading to increased demand for fruit fillings with natural ingredients, reduced sugar content, and enhanced nutritional profiles. This has spurred innovation in extraction and preservation technologies, enabling manufacturers to deliver cleaner labels and cater to specific dietary needs, such as vegan or gluten-free formulations. The "clean label" movement, where consumers prioritize products with recognizable and minimal ingredients, is significantly influencing product development. Furthermore, the convenience factor remains paramount, with consumers opting for products that offer ease of use and extended shelf life. This translates to a sustained demand for high-quality, pre-made fruit fillings that simplify home baking and commercial food preparation.
Technological disruptions, while not overtly revolutionary in this segment, are steadily improving product quality and efficiency. Advancements in processing techniques, such as aseptic processing and advanced drying methods, are contributing to better texture, flavor retention, and shelf stability of fruit fillings. The integration of data analytics and artificial intelligence in forecasting consumer trends and optimizing supply chains is also becoming increasingly prevalent, ensuring better product availability and reduced waste. The online retail channel is also witnessing significant growth, providing greater accessibility to a wider range of fruit fillings for both consumers and smaller businesses, further contributing to market expansion. The historical data from 2019–2024 shows a consistent year-on-year growth of around 4.8%, indicating a stable and expanding market.
Dominant Regions, Countries, or Segments in Fruit Fillings
The Commercial application segment currently dominates the global fruit fillings market, driven by its extensive use in the food service industry, bakeries, and large-scale food manufacturing operations. In the base year 2025, the commercial segment is estimated to hold a substantial market share of 68.2% of the total market value. This dominance is attributed to several key factors, including the sheer volume of products utilizing fruit fillings, such as pies, tarts, pastries, yogurts, and ice cream. The consistent demand for high-quality, ready-to-use ingredients in professional kitchens worldwide underpins this segment's leadership.
North America, particularly the United States, is the leading country within the fruit fillings market, accounting for an estimated 28% of the global market share in 2025. This strong presence is fueled by a mature food industry, a high consumer appetite for convenience foods and baked goods, and a well-established network of food manufacturers and distributors. The presence of major fruit-growing regions also contributes to a robust supply chain for fruit-based ingredients. Economic policies that support food processing and innovation, coupled with extensive retail infrastructure, further bolster its market dominance. The market share in North America is projected to grow at a CAGR of 5.1% from 2025 to 2033.
Among the fruit types, Strawberry fillings consistently hold the largest market share, estimated at 22.5% in 2025. This is due to the universal appeal of strawberries, their versatility in various culinary applications, and their year-round availability through global sourcing and advanced preservation techniques. The popularity of strawberry-flavored desserts and beverages, coupled with its perceived health benefits, further solidifies its position. Pineapple and Apple fillings follow closely, each capturing significant market shares due to their complementary use in baked goods and their widespread availability and cost-effectiveness. The growth potential for Peach and Blackberry fillings is also considerable, driven by increasing consumer interest in exotic and berry-based flavors. The overall market share for the "Others" category, encompassing less common but niche fruit fillings, is also growing as consumer palates diversify.
Fruit Fillings Product Landscape
The fruit fillings product landscape is characterized by a strong emphasis on innovation, driven by the demand for both indulgence and health. Manufacturers are actively developing fillings with enhanced natural fruit content, reduced sugar, and no artificial additives. Innovations include advanced texturizing agents for improved mouthfeel, extended shelf-life solutions without compromising flavor, and a wider array of exotic and seasonal fruit varieties. Unique selling propositions often revolve around artisanal quality, specific regional fruit sourcing, and allergen-free formulations. Technological advancements focus on improving flavor profiles through natural extracts and precise fruit processing to maintain a fresh, homemade taste.
Key Drivers, Barriers & Challenges in Fruit Fillings
The fruit fillings market is propelled by several key drivers. The escalating demand for convenient and ready-to-use food ingredients, particularly in the bakery and dairy sectors, is a primary growth catalyst. The rising global middle class and increased disposable incomes contribute to higher consumption of processed foods and desserts. Furthermore, the growing consumer preference for natural, healthy, and "clean label" products is pushing manufacturers to innovate with fruit-based ingredients and reduced sugar content. Technological advancements in fruit processing and preservation are enabling better quality and longer shelf life, expanding market reach.
However, the market faces significant barriers and challenges. Fluctuations in raw material prices due to climatic conditions, agricultural yields, and global supply chain disruptions can impact profitability and product availability. Stringent food safety regulations and labeling requirements across different regions add to compliance costs and complexity. Intense competition from both established players and emerging brands necessitates continuous product innovation and competitive pricing. The cost of developing and implementing new technologies for improved preservation and flavor profiles can also be a barrier for smaller manufacturers.
Emerging Opportunities in Fruit Fillings
Emerging opportunities lie in the development of specialized fruit fillings catering to niche markets. This includes fillings tailored for specific dietary needs like low-FODMAP, keto-friendly, or plant-based diets. The demand for functional fruit fillings, fortified with vitamins, antioxidants, or probiotics, presents another lucrative avenue. Expansion into emerging economies with a growing middle class and increasing adoption of Western dietary habits offers significant untapped market potential. Furthermore, exploring innovative applications beyond traditional desserts, such as savory dishes or beverages, could unlock new revenue streams. The development of concentrated or powdered fruit fillings for easier logistics and extended shelf life also presents an opportunity.
Growth Accelerators in the Fruit Fillings Industry
Several catalysts are accelerating growth in the fruit fillings industry. Strategic partnerships between fruit growers, ingredient manufacturers, and food product developers are fostering innovation and ensuring a stable supply chain. The increasing popularity of vegan and plant-based diets is a significant growth accelerator, driving demand for fruit fillings that are entirely derived from fruits and plant-based ingredients. Furthermore, the rise of e-commerce platforms and direct-to-consumer sales models is expanding market reach and providing greater accessibility to a wider range of specialized fruit fillings. Investments in research and development for novel flavor combinations and functional benefits are also key growth accelerators.
Key Players Shaping the Fruit Fillings Market
- Baldwin Richardson Foods
- Fruit Crown
- Zentis
- Schulze and Burch Biscuit
- Lyons
- Fruit Filling Inc
- Wawona
- Agrana
- Dawn Food Products
- Frexport (Altex Group)
- Famesa
- Sensient Flavors
- Alimentos Profusa
Notable Milestones in Fruit Fillings Sector
- 2022: Launch of a new line of no-added-sugar fruit fillings by Agrana, responding to increased consumer demand for healthier options.
- 2021: Acquisition of a specialty fruit preparation company by Baldwin Richardson Foods, expanding its product portfolio in premium fillings.
- 2020: Introduction of plant-based fruit fillings by Dawn Food Products, catering to the growing vegan market.
- 2019: Famesa develops innovative aseptic packaging technology for fruit fillings, extending shelf life and preserving freshness.
In-Depth Fruit Fillings Market Outlook
The future outlook for the fruit fillings market is highly optimistic, driven by sustained consumer demand for convenience, flavor, and healthier choices. Key growth accelerators include the relentless pursuit of "clean label" ingredients, the expansion of plant-based alternatives, and innovative applications in diverse food categories. Strategic partnerships, coupled with investments in advanced processing technologies, will further enhance product quality and market reach. The market is poised for continuous evolution, presenting significant opportunities for companies that can adapt to shifting consumer preferences and embrace sustainable sourcing and production practices. The anticipated market growth signifies a robust and dynamic industry landscape.
Fruit Fillings Segmentation
-
1. Application
- 1.1. Commercial
- 1.2. Household
- 1.3. Others
-
2. Type
- 2.1. Strawberry
- 2.2. Pineapple
- 2.3. Apple
- 2.4. Peach
- 2.5. Blackberry
- 2.6. Others
Fruit Fillings Segmentation By Geography
-
1. North America
- 1.1. United States
- 1.2. Canada
- 1.3. Mexico
-
2. South America
- 2.1. Brazil
- 2.2. Argentina
- 2.3. Rest of South America
-
3. Europe
- 3.1. United Kingdom
- 3.2. Germany
- 3.3. France
- 3.4. Italy
- 3.5. Spain
- 3.6. Russia
- 3.7. Benelux
- 3.8. Nordics
- 3.9. Rest of Europe
-
4. Middle East & Africa
- 4.1. Turkey
- 4.2. Israel
- 4.3. GCC
- 4.4. North Africa
- 4.5. South Africa
- 4.6. Rest of Middle East & Africa
-
5. Asia Pacific
- 5.1. China
- 5.2. India
- 5.3. Japan
- 5.4. South Korea
- 5.5. ASEAN
- 5.6. Oceania
- 5.7. Rest of Asia Pacific
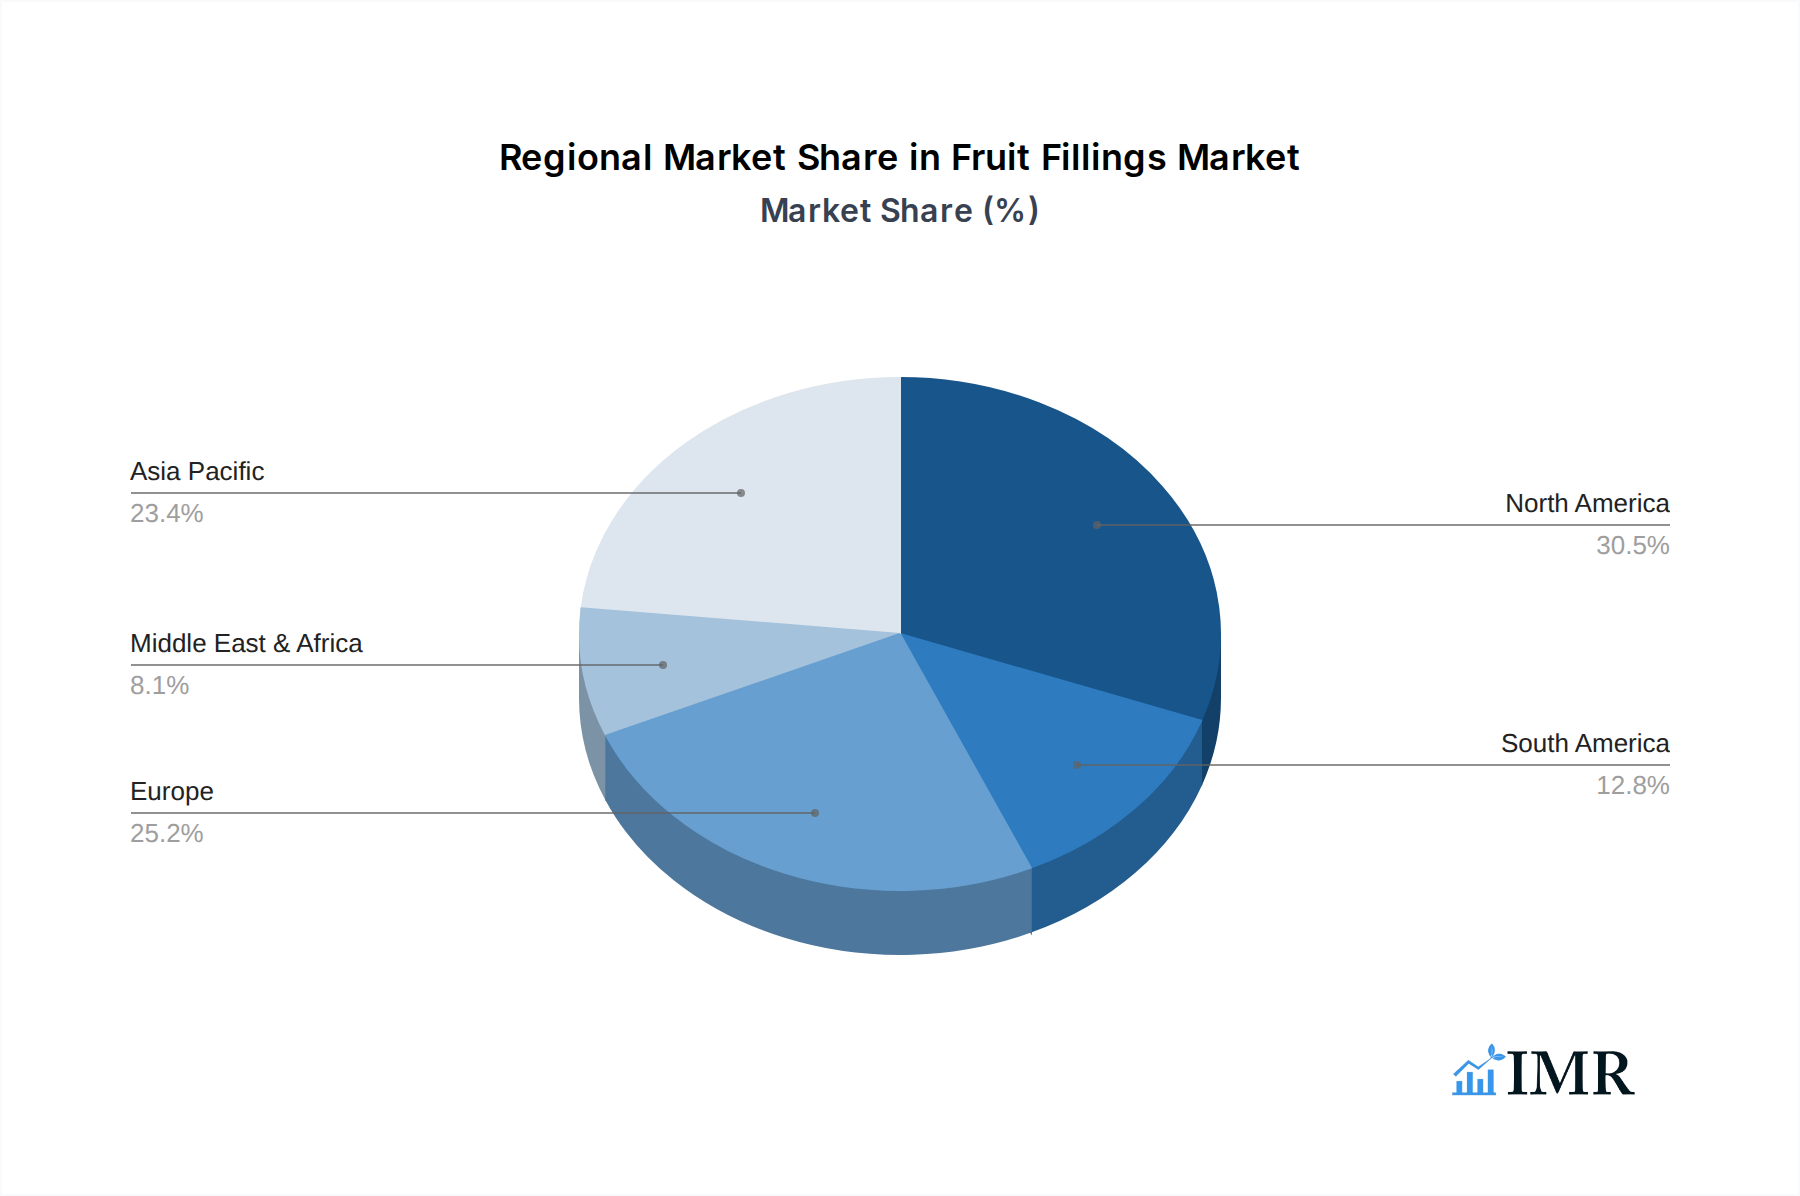
Fruit Fillings Regional Market Share
Geographic Coverage of Fruit Fillings
Fruit Fillings REPORT HIGHLIGHTS
| Aspects | Details |
|---|---|
| Study Period | 2020-2034 |
| Base Year | 2025 |
| Estimated Year | 2026 |
| Forecast Period | 2026-2034 |
| Historical Period | 2020-2025 |
| Growth Rate | CAGR of 5.29% from 2020-2034 |
| Segmentation |
|
Table of Contents
- 1. Introduction
- 1.1. Research Scope
- 1.2. Market Segmentation
- 1.3. Research Methodology
- 1.4. Definitions and Assumptions
- 2. Executive Summary
- 2.1. Introduction
- 3. Market Dynamics
- 3.1. Introduction
- 3.2. Market Drivers
- 3.3. Market Restrains
- 3.4. Market Trends
- 4. Market Factor Analysis
- 4.1. Porters Five Forces
- 4.2. Supply/Value Chain
- 4.3. PESTEL analysis
- 4.4. Market Entropy
- 4.5. Patent/Trademark Analysis
- 5. Global Fruit Fillings Analysis, Insights and Forecast, 2020-2032
- 5.1. Market Analysis, Insights and Forecast - by Application
- 5.1.1. Commercial
- 5.1.2. Household
- 5.1.3. Others
- 5.2. Market Analysis, Insights and Forecast - by Type
- 5.2.1. Strawberry
- 5.2.2. Pineapple
- 5.2.3. Apple
- 5.2.4. Peach
- 5.2.5. Blackberry
- 5.2.6. Others
- 5.3. Market Analysis, Insights and Forecast - by Region
- 5.3.1. North America
- 5.3.2. South America
- 5.3.3. Europe
- 5.3.4. Middle East & Africa
- 5.3.5. Asia Pacific
- 5.1. Market Analysis, Insights and Forecast - by Application
- 6. North America Fruit Fillings Analysis, Insights and Forecast, 2020-2032
- 6.1. Market Analysis, Insights and Forecast - by Application
- 6.1.1. Commercial
- 6.1.2. Household
- 6.1.3. Others
- 6.2. Market Analysis, Insights and Forecast - by Type
- 6.2.1. Strawberry
- 6.2.2. Pineapple
- 6.2.3. Apple
- 6.2.4. Peach
- 6.2.5. Blackberry
- 6.2.6. Others
- 6.1. Market Analysis, Insights and Forecast - by Application
- 7. South America Fruit Fillings Analysis, Insights and Forecast, 2020-2032
- 7.1. Market Analysis, Insights and Forecast - by Application
- 7.1.1. Commercial
- 7.1.2. Household
- 7.1.3. Others
- 7.2. Market Analysis, Insights and Forecast - by Type
- 7.2.1. Strawberry
- 7.2.2. Pineapple
- 7.2.3. Apple
- 7.2.4. Peach
- 7.2.5. Blackberry
- 7.2.6. Others
- 7.1. Market Analysis, Insights and Forecast - by Application
- 8. Europe Fruit Fillings Analysis, Insights and Forecast, 2020-2032
- 8.1. Market Analysis, Insights and Forecast - by Application
- 8.1.1. Commercial
- 8.1.2. Household
- 8.1.3. Others
- 8.2. Market Analysis, Insights and Forecast - by Type
- 8.2.1. Strawberry
- 8.2.2. Pineapple
- 8.2.3. Apple
- 8.2.4. Peach
- 8.2.5. Blackberry
- 8.2.6. Others
- 8.1. Market Analysis, Insights and Forecast - by Application
- 9. Middle East & Africa Fruit Fillings Analysis, Insights and Forecast, 2020-2032
- 9.1. Market Analysis, Insights and Forecast - by Application
- 9.1.1. Commercial
- 9.1.2. Household
- 9.1.3. Others
- 9.2. Market Analysis, Insights and Forecast - by Type
- 9.2.1. Strawberry
- 9.2.2. Pineapple
- 9.2.3. Apple
- 9.2.4. Peach
- 9.2.5. Blackberry
- 9.2.6. Others
- 9.1. Market Analysis, Insights and Forecast - by Application
- 10. Asia Pacific Fruit Fillings Analysis, Insights and Forecast, 2020-2032
- 10.1. Market Analysis, Insights and Forecast - by Application
- 10.1.1. Commercial
- 10.1.2. Household
- 10.1.3. Others
- 10.2. Market Analysis, Insights and Forecast - by Type
- 10.2.1. Strawberry
- 10.2.2. Pineapple
- 10.2.3. Apple
- 10.2.4. Peach
- 10.2.5. Blackberry
- 10.2.6. Others
- 10.1. Market Analysis, Insights and Forecast - by Application
- 11. Competitive Analysis
- 11.1. Global Market Share Analysis 2025
- 11.2. Company Profiles
- 11.2.1 Baldwin Richardson Foods
- 11.2.1.1. Overview
- 11.2.1.2. Products
- 11.2.1.3. SWOT Analysis
- 11.2.1.4. Recent Developments
- 11.2.1.5. Financials (Based on Availability)
- 11.2.2 Fruit Crown
- 11.2.2.1. Overview
- 11.2.2.2. Products
- 11.2.2.3. SWOT Analysis
- 11.2.2.4. Recent Developments
- 11.2.2.5. Financials (Based on Availability)
- 11.2.3 Zentis
- 11.2.3.1. Overview
- 11.2.3.2. Products
- 11.2.3.3. SWOT Analysis
- 11.2.3.4. Recent Developments
- 11.2.3.5. Financials (Based on Availability)
- 11.2.4 Schulze and Burch Biscuit
- 11.2.4.1. Overview
- 11.2.4.2. Products
- 11.2.4.3. SWOT Analysis
- 11.2.4.4. Recent Developments
- 11.2.4.5. Financials (Based on Availability)
- 11.2.5 Lyons
- 11.2.5.1. Overview
- 11.2.5.2. Products
- 11.2.5.3. SWOT Analysis
- 11.2.5.4. Recent Developments
- 11.2.5.5. Financials (Based on Availability)
- 11.2.6 Fruit Filling Inc
- 11.2.6.1. Overview
- 11.2.6.2. Products
- 11.2.6.3. SWOT Analysis
- 11.2.6.4. Recent Developments
- 11.2.6.5. Financials (Based on Availability)
- 11.2.7 Wawona
- 11.2.7.1. Overview
- 11.2.7.2. Products
- 11.2.7.3. SWOT Analysis
- 11.2.7.4. Recent Developments
- 11.2.7.5. Financials (Based on Availability)
- 11.2.8 Agrana
- 11.2.8.1. Overview
- 11.2.8.2. Products
- 11.2.8.3. SWOT Analysis
- 11.2.8.4. Recent Developments
- 11.2.8.5. Financials (Based on Availability)
- 11.2.9 Dawn Food Products
- 11.2.9.1. Overview
- 11.2.9.2. Products
- 11.2.9.3. SWOT Analysis
- 11.2.9.4. Recent Developments
- 11.2.9.5. Financials (Based on Availability)
- 11.2.10 Frexport (Altex Group)
- 11.2.10.1. Overview
- 11.2.10.2. Products
- 11.2.10.3. SWOT Analysis
- 11.2.10.4. Recent Developments
- 11.2.10.5. Financials (Based on Availability)
- 11.2.11 Famesa
- 11.2.11.1. Overview
- 11.2.11.2. Products
- 11.2.11.3. SWOT Analysis
- 11.2.11.4. Recent Developments
- 11.2.11.5. Financials (Based on Availability)
- 11.2.12 Sensient Flavors
- 11.2.12.1. Overview
- 11.2.12.2. Products
- 11.2.12.3. SWOT Analysis
- 11.2.12.4. Recent Developments
- 11.2.12.5. Financials (Based on Availability)
- 11.2.13 Alimentos Profusa
- 11.2.13.1. Overview
- 11.2.13.2. Products
- 11.2.13.3. SWOT Analysis
- 11.2.13.4. Recent Developments
- 11.2.13.5. Financials (Based on Availability)
- 11.2.1 Baldwin Richardson Foods
List of Figures
- Figure 1: Global Fruit Fillings Revenue Breakdown (undefined, %) by Region 2025 & 2033
- Figure 2: Global Fruit Fillings Volume Breakdown (K, %) by Region 2025 & 2033
- Figure 3: North America Fruit Fillings Revenue (undefined), by Application 2025 & 2033
- Figure 4: North America Fruit Fillings Volume (K), by Application 2025 & 2033
- Figure 5: North America Fruit Fillings Revenue Share (%), by Application 2025 & 2033
- Figure 6: North America Fruit Fillings Volume Share (%), by Application 2025 & 2033
- Figure 7: North America Fruit Fillings Revenue (undefined), by Type 2025 & 2033
- Figure 8: North America Fruit Fillings Volume (K), by Type 2025 & 2033
- Figure 9: North America Fruit Fillings Revenue Share (%), by Type 2025 & 2033
- Figure 10: North America Fruit Fillings Volume Share (%), by Type 2025 & 2033
- Figure 11: North America Fruit Fillings Revenue (undefined), by Country 2025 & 2033
- Figure 12: North America Fruit Fillings Volume (K), by Country 2025 & 2033
- Figure 13: North America Fruit Fillings Revenue Share (%), by Country 2025 & 2033
- Figure 14: North America Fruit Fillings Volume Share (%), by Country 2025 & 2033
- Figure 15: South America Fruit Fillings Revenue (undefined), by Application 2025 & 2033
- Figure 16: South America Fruit Fillings Volume (K), by Application 2025 & 2033
- Figure 17: South America Fruit Fillings Revenue Share (%), by Application 2025 & 2033
- Figure 18: South America Fruit Fillings Volume Share (%), by Application 2025 & 2033
- Figure 19: South America Fruit Fillings Revenue (undefined), by Type 2025 & 2033
- Figure 20: South America Fruit Fillings Volume (K), by Type 2025 & 2033
- Figure 21: South America Fruit Fillings Revenue Share (%), by Type 2025 & 2033
- Figure 22: South America Fruit Fillings Volume Share (%), by Type 2025 & 2033
- Figure 23: South America Fruit Fillings Revenue (undefined), by Country 2025 & 2033
- Figure 24: South America Fruit Fillings Volume (K), by Country 2025 & 2033
- Figure 25: South America Fruit Fillings Revenue Share (%), by Country 2025 & 2033
- Figure 26: South America Fruit Fillings Volume Share (%), by Country 2025 & 2033
- Figure 27: Europe Fruit Fillings Revenue (undefined), by Application 2025 & 2033
- Figure 28: Europe Fruit Fillings Volume (K), by Application 2025 & 2033
- Figure 29: Europe Fruit Fillings Revenue Share (%), by Application 2025 & 2033
- Figure 30: Europe Fruit Fillings Volume Share (%), by Application 2025 & 2033
- Figure 31: Europe Fruit Fillings Revenue (undefined), by Type 2025 & 2033
- Figure 32: Europe Fruit Fillings Volume (K), by Type 2025 & 2033
- Figure 33: Europe Fruit Fillings Revenue Share (%), by Type 2025 & 2033
- Figure 34: Europe Fruit Fillings Volume Share (%), by Type 2025 & 2033
- Figure 35: Europe Fruit Fillings Revenue (undefined), by Country 2025 & 2033
- Figure 36: Europe Fruit Fillings Volume (K), by Country 2025 & 2033
- Figure 37: Europe Fruit Fillings Revenue Share (%), by Country 2025 & 2033
- Figure 38: Europe Fruit Fillings Volume Share (%), by Country 2025 & 2033
- Figure 39: Middle East & Africa Fruit Fillings Revenue (undefined), by Application 2025 & 2033
- Figure 40: Middle East & Africa Fruit Fillings Volume (K), by Application 2025 & 2033
- Figure 41: Middle East & Africa Fruit Fillings Revenue Share (%), by Application 2025 & 2033
- Figure 42: Middle East & Africa Fruit Fillings Volume Share (%), by Application 2025 & 2033
- Figure 43: Middle East & Africa Fruit Fillings Revenue (undefined), by Type 2025 & 2033
- Figure 44: Middle East & Africa Fruit Fillings Volume (K), by Type 2025 & 2033
- Figure 45: Middle East & Africa Fruit Fillings Revenue Share (%), by Type 2025 & 2033
- Figure 46: Middle East & Africa Fruit Fillings Volume Share (%), by Type 2025 & 2033
- Figure 47: Middle East & Africa Fruit Fillings Revenue (undefined), by Country 2025 & 2033
- Figure 48: Middle East & Africa Fruit Fillings Volume (K), by Country 2025 & 2033
- Figure 49: Middle East & Africa Fruit Fillings Revenue Share (%), by Country 2025 & 2033
- Figure 50: Middle East & Africa Fruit Fillings Volume Share (%), by Country 2025 & 2033
- Figure 51: Asia Pacific Fruit Fillings Revenue (undefined), by Application 2025 & 2033
- Figure 52: Asia Pacific Fruit Fillings Volume (K), by Application 2025 & 2033
- Figure 53: Asia Pacific Fruit Fillings Revenue Share (%), by Application 2025 & 2033
- Figure 54: Asia Pacific Fruit Fillings Volume Share (%), by Application 2025 & 2033
- Figure 55: Asia Pacific Fruit Fillings Revenue (undefined), by Type 2025 & 2033
- Figure 56: Asia Pacific Fruit Fillings Volume (K), by Type 2025 & 2033
- Figure 57: Asia Pacific Fruit Fillings Revenue Share (%), by Type 2025 & 2033
- Figure 58: Asia Pacific Fruit Fillings Volume Share (%), by Type 2025 & 2033
- Figure 59: Asia Pacific Fruit Fillings Revenue (undefined), by Country 2025 & 2033
- Figure 60: Asia Pacific Fruit Fillings Volume (K), by Country 2025 & 2033
- Figure 61: Asia Pacific Fruit Fillings Revenue Share (%), by Country 2025 & 2033
- Figure 62: Asia Pacific Fruit Fillings Volume Share (%), by Country 2025 & 2033
List of Tables
- Table 1: Global Fruit Fillings Revenue undefined Forecast, by Application 2020 & 2033
- Table 2: Global Fruit Fillings Volume K Forecast, by Application 2020 & 2033
- Table 3: Global Fruit Fillings Revenue undefined Forecast, by Type 2020 & 2033
- Table 4: Global Fruit Fillings Volume K Forecast, by Type 2020 & 2033
- Table 5: Global Fruit Fillings Revenue undefined Forecast, by Region 2020 & 2033
- Table 6: Global Fruit Fillings Volume K Forecast, by Region 2020 & 2033
- Table 7: Global Fruit Fillings Revenue undefined Forecast, by Application 2020 & 2033
- Table 8: Global Fruit Fillings Volume K Forecast, by Application 2020 & 2033
- Table 9: Global Fruit Fillings Revenue undefined Forecast, by Type 2020 & 2033
- Table 10: Global Fruit Fillings Volume K Forecast, by Type 2020 & 2033
- Table 11: Global Fruit Fillings Revenue undefined Forecast, by Country 2020 & 2033
- Table 12: Global Fruit Fillings Volume K Forecast, by Country 2020 & 2033
- Table 13: United States Fruit Fillings Revenue (undefined) Forecast, by Application 2020 & 2033
- Table 14: United States Fruit Fillings Volume (K) Forecast, by Application 2020 & 2033
- Table 15: Canada Fruit Fillings Revenue (undefined) Forecast, by Application 2020 & 2033
- Table 16: Canada Fruit Fillings Volume (K) Forecast, by Application 2020 & 2033
- Table 17: Mexico Fruit Fillings Revenue (undefined) Forecast, by Application 2020 & 2033
- Table 18: Mexico Fruit Fillings Volume (K) Forecast, by Application 2020 & 2033
- Table 19: Global Fruit Fillings Revenue undefined Forecast, by Application 2020 & 2033
- Table 20: Global Fruit Fillings Volume K Forecast, by Application 2020 & 2033
- Table 21: Global Fruit Fillings Revenue undefined Forecast, by Type 2020 & 2033
- Table 22: Global Fruit Fillings Volume K Forecast, by Type 2020 & 2033
- Table 23: Global Fruit Fillings Revenue undefined Forecast, by Country 2020 & 2033
- Table 24: Global Fruit Fillings Volume K Forecast, by Country 2020 & 2033
- Table 25: Brazil Fruit Fillings Revenue (undefined) Forecast, by Application 2020 & 2033
- Table 26: Brazil Fruit Fillings Volume (K) Forecast, by Application 2020 & 2033
- Table 27: Argentina Fruit Fillings Revenue (undefined) Forecast, by Application 2020 & 2033
- Table 28: Argentina Fruit Fillings Volume (K) Forecast, by Application 2020 & 2033
- Table 29: Rest of South America Fruit Fillings Revenue (undefined) Forecast, by Application 2020 & 2033
- Table 30: Rest of South America Fruit Fillings Volume (K) Forecast, by Application 2020 & 2033
- Table 31: Global Fruit Fillings Revenue undefined Forecast, by Application 2020 & 2033
- Table 32: Global Fruit Fillings Volume K Forecast, by Application 2020 & 2033
- Table 33: Global Fruit Fillings Revenue undefined Forecast, by Type 2020 & 2033
- Table 34: Global Fruit Fillings Volume K Forecast, by Type 2020 & 2033
- Table 35: Global Fruit Fillings Revenue undefined Forecast, by Country 2020 & 2033
- Table 36: Global Fruit Fillings Volume K Forecast, by Country 2020 & 2033
- Table 37: United Kingdom Fruit Fillings Revenue (undefined) Forecast, by Application 2020 & 2033
- Table 38: United Kingdom Fruit Fillings Volume (K) Forecast, by Application 2020 & 2033
- Table 39: Germany Fruit Fillings Revenue (undefined) Forecast, by Application 2020 & 2033
- Table 40: Germany Fruit Fillings Volume (K) Forecast, by Application 2020 & 2033
- Table 41: France Fruit Fillings Revenue (undefined) Forecast, by Application 2020 & 2033
- Table 42: France Fruit Fillings Volume (K) Forecast, by Application 2020 & 2033
- Table 43: Italy Fruit Fillings Revenue (undefined) Forecast, by Application 2020 & 2033
- Table 44: Italy Fruit Fillings Volume (K) Forecast, by Application 2020 & 2033
- Table 45: Spain Fruit Fillings Revenue (undefined) Forecast, by Application 2020 & 2033
- Table 46: Spain Fruit Fillings Volume (K) Forecast, by Application 2020 & 2033
- Table 47: Russia Fruit Fillings Revenue (undefined) Forecast, by Application 2020 & 2033
- Table 48: Russia Fruit Fillings Volume (K) Forecast, by Application 2020 & 2033
- Table 49: Benelux Fruit Fillings Revenue (undefined) Forecast, by Application 2020 & 2033
- Table 50: Benelux Fruit Fillings Volume (K) Forecast, by Application 2020 & 2033
- Table 51: Nordics Fruit Fillings Revenue (undefined) Forecast, by Application 2020 & 2033
- Table 52: Nordics Fruit Fillings Volume (K) Forecast, by Application 2020 & 2033
- Table 53: Rest of Europe Fruit Fillings Revenue (undefined) Forecast, by Application 2020 & 2033
- Table 54: Rest of Europe Fruit Fillings Volume (K) Forecast, by Application 2020 & 2033
- Table 55: Global Fruit Fillings Revenue undefined Forecast, by Application 2020 & 2033
- Table 56: Global Fruit Fillings Volume K Forecast, by Application 2020 & 2033
- Table 57: Global Fruit Fillings Revenue undefined Forecast, by Type 2020 & 2033
- Table 58: Global Fruit Fillings Volume K Forecast, by Type 2020 & 2033
- Table 59: Global Fruit Fillings Revenue undefined Forecast, by Country 2020 & 2033
- Table 60: Global Fruit Fillings Volume K Forecast, by Country 2020 & 2033
- Table 61: Turkey Fruit Fillings Revenue (undefined) Forecast, by Application 2020 & 2033
- Table 62: Turkey Fruit Fillings Volume (K) Forecast, by Application 2020 & 2033
- Table 63: Israel Fruit Fillings Revenue (undefined) Forecast, by Application 2020 & 2033
- Table 64: Israel Fruit Fillings Volume (K) Forecast, by Application 2020 & 2033
- Table 65: GCC Fruit Fillings Revenue (undefined) Forecast, by Application 2020 & 2033
- Table 66: GCC Fruit Fillings Volume (K) Forecast, by Application 2020 & 2033
- Table 67: North Africa Fruit Fillings Revenue (undefined) Forecast, by Application 2020 & 2033
- Table 68: North Africa Fruit Fillings Volume (K) Forecast, by Application 2020 & 2033
- Table 69: South Africa Fruit Fillings Revenue (undefined) Forecast, by Application 2020 & 2033
- Table 70: South Africa Fruit Fillings Volume (K) Forecast, by Application 2020 & 2033
- Table 71: Rest of Middle East & Africa Fruit Fillings Revenue (undefined) Forecast, by Application 2020 & 2033
- Table 72: Rest of Middle East & Africa Fruit Fillings Volume (K) Forecast, by Application 2020 & 2033
- Table 73: Global Fruit Fillings Revenue undefined Forecast, by Application 2020 & 2033
- Table 74: Global Fruit Fillings Volume K Forecast, by Application 2020 & 2033
- Table 75: Global Fruit Fillings Revenue undefined Forecast, by Type 2020 & 2033
- Table 76: Global Fruit Fillings Volume K Forecast, by Type 2020 & 2033
- Table 77: Global Fruit Fillings Revenue undefined Forecast, by Country 2020 & 2033
- Table 78: Global Fruit Fillings Volume K Forecast, by Country 2020 & 2033
- Table 79: China Fruit Fillings Revenue (undefined) Forecast, by Application 2020 & 2033
- Table 80: China Fruit Fillings Volume (K) Forecast, by Application 2020 & 2033
- Table 81: India Fruit Fillings Revenue (undefined) Forecast, by Application 2020 & 2033
- Table 82: India Fruit Fillings Volume (K) Forecast, by Application 2020 & 2033
- Table 83: Japan Fruit Fillings Revenue (undefined) Forecast, by Application 2020 & 2033
- Table 84: Japan Fruit Fillings Volume (K) Forecast, by Application 2020 & 2033
- Table 85: South Korea Fruit Fillings Revenue (undefined) Forecast, by Application 2020 & 2033
- Table 86: South Korea Fruit Fillings Volume (K) Forecast, by Application 2020 & 2033
- Table 87: ASEAN Fruit Fillings Revenue (undefined) Forecast, by Application 2020 & 2033
- Table 88: ASEAN Fruit Fillings Volume (K) Forecast, by Application 2020 & 2033
- Table 89: Oceania Fruit Fillings Revenue (undefined) Forecast, by Application 2020 & 2033
- Table 90: Oceania Fruit Fillings Volume (K) Forecast, by Application 2020 & 2033
- Table 91: Rest of Asia Pacific Fruit Fillings Revenue (undefined) Forecast, by Application 2020 & 2033
- Table 92: Rest of Asia Pacific Fruit Fillings Volume (K) Forecast, by Application 2020 & 2033
Frequently Asked Questions
1. What is the projected Compound Annual Growth Rate (CAGR) of the Fruit Fillings?
The projected CAGR is approximately 5.29%.
2. Which companies are prominent players in the Fruit Fillings?
Key companies in the market include Baldwin Richardson Foods, Fruit Crown, Zentis, Schulze and Burch Biscuit, Lyons, Fruit Filling Inc, Wawona, Agrana, Dawn Food Products, Frexport (Altex Group), Famesa, Sensient Flavors, Alimentos Profusa.
3. What are the main segments of the Fruit Fillings?
The market segments include Application, Type.
4. Can you provide details about the market size?
The market size is estimated to be USD XXX N/A as of 2022.
5. What are some drivers contributing to market growth?
N/A
6. What are the notable trends driving market growth?
N/A
7. Are there any restraints impacting market growth?
N/A
8. Can you provide examples of recent developments in the market?
N/A
9. What pricing options are available for accessing the report?
Pricing options include single-user, multi-user, and enterprise licenses priced at USD 3950.00, USD 5925.00, and USD 7900.00 respectively.
10. Is the market size provided in terms of value or volume?
The market size is provided in terms of value, measured in N/A and volume, measured in K.
11. Are there any specific market keywords associated with the report?
Yes, the market keyword associated with the report is "Fruit Fillings," which aids in identifying and referencing the specific market segment covered.
12. How do I determine which pricing option suits my needs best?
The pricing options vary based on user requirements and access needs. Individual users may opt for single-user licenses, while businesses requiring broader access may choose multi-user or enterprise licenses for cost-effective access to the report.
13. Are there any additional resources or data provided in the Fruit Fillings report?
While the report offers comprehensive insights, it's advisable to review the specific contents or supplementary materials provided to ascertain if additional resources or data are available.
14. How can I stay updated on further developments or reports in the Fruit Fillings?
To stay informed about further developments, trends, and reports in the Fruit Fillings, consider subscribing to industry newsletters, following relevant companies and organizations, or regularly checking reputable industry news sources and publications.
Methodology
Step 1 - Identification of Relevant Samples Size from Population Database


Step 2 - Approaches for Defining Global Market Size (Value, Volume* & Price*)

Note*: In applicable scenarios
Step 3 - Data Sources
Primary Research
- Web Analytics
- Survey Reports
- Research Institute
- Latest Research Reports
- Opinion Leaders
Secondary Research
- Annual Reports
- White Paper
- Latest Press Release
- Industry Association
- Paid Database
- Investor Presentations

Step 4 - Data Triangulation
Involves using different sources of information in order to increase the validity of a study
These sources are likely to be stakeholders in a program - participants, other researchers, program staff, other community members, and so on.
Then we put all data in single framework & apply various statistical tools to find out the dynamic on the market.
During the analysis stage, feedback from the stakeholder groups would be compared to determine areas of agreement as well as areas of divergence