

Key Insights
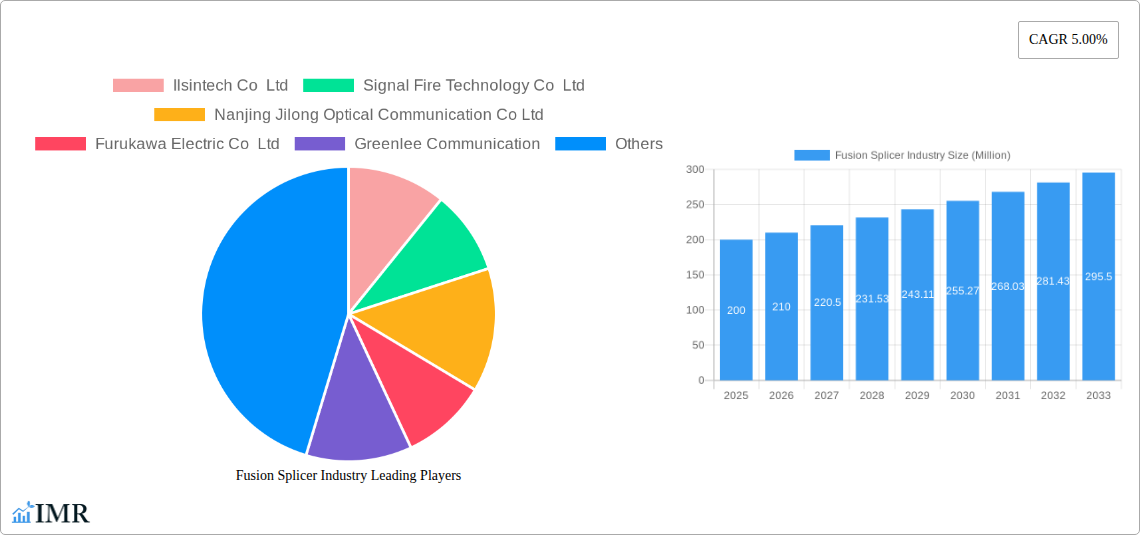
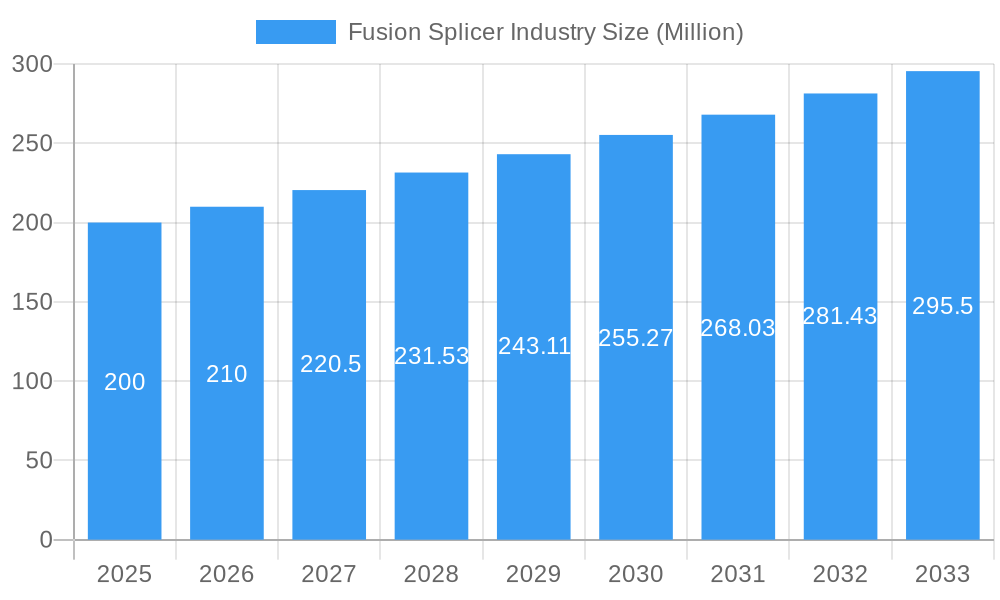
The global fusion splicer market, valued at approximately $XX million in 2025, is projected to experience robust growth, exhibiting a compound annual growth rate (CAGR) of 5.00% from 2025 to 2033. This growth is fueled by several key drivers. The expanding telecommunications infrastructure globally, particularly the rapid rollout of 5G networks and fiber-to-the-home (FTTH) initiatives, is significantly boosting demand for efficient and reliable fusion splicing equipment. Furthermore, the increasing adoption of fusion splicers in other applications, such as aerospace & defense, cable TV, and enterprise networks, contributes to market expansion. Technological advancements leading to improved splicing speed, precision, and ease of use are also driving market growth. However, the market faces certain restraints, including the high initial investment cost associated with purchasing sophisticated fusion splicers and the potential for skilled labor shortages in certain regions.
Fusion Splicer Industry Market Size (In Million)
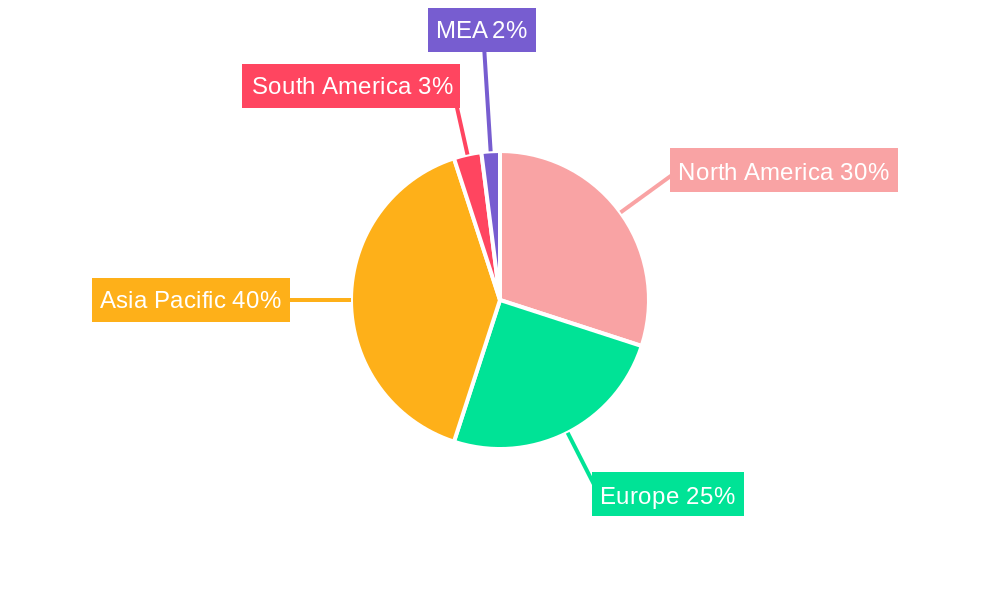
Market segmentation reveals a strong preference for core alignment fusion splicers, driven by their higher precision and suitability for various fiber types. The telecommunications sector remains the largest application segment, but consistent growth is anticipated across all application segments, reflecting the broad adoption of fiber optic technology across various industries. Key players in the market, including Ilsintech Co Ltd, Furukawa Electric Co Ltd, and Sumitomo Electric Industries Ltd, are focusing on innovation, strategic partnerships, and geographical expansion to maintain their market share and capitalize on the growth opportunities. The Asia-Pacific region, driven by strong infrastructure development in China and India, is expected to dominate the market, followed by North America and Europe. The forecast period of 2025-2033 promises considerable growth opportunities for established players and new entrants, particularly those offering cost-effective and technologically advanced fusion splicing solutions.
Fusion Splicer Industry Company Market Share
Fusion Splicer Industry: A Comprehensive Market Report (2019-2033)
This comprehensive report provides a detailed analysis of the global Fusion Splicer industry, encompassing market dynamics, growth trends, regional insights, and key player strategies. With a study period spanning 2019-2033, a base year of 2025, and a forecast period of 2025-2033, this report offers invaluable insights for industry professionals, investors, and strategic decision-makers. The report segments the market by alignment type (Core Alignment, Cladding Alignment) and application (Telecommunications, Aerospace & Defense, Premises & Enterprise, Cable TV, Other Applications), providing granular analysis of each segment's performance and future potential. The total market size is projected to reach xx Million by 2033.
Fusion Splicer Industry Market Dynamics & Structure
The Fusion Splicer market, valued at xx Million in 2025, exhibits a moderately concentrated landscape, with key players vying for market share through technological innovation and strategic acquisitions. Regulatory frameworks impacting fiber optic infrastructure deployment significantly influence market growth. The emergence of alternative splicing technologies presents a competitive challenge, while the expanding telecommunications sector, coupled with increasing demand for high-speed data transmission, fuels market expansion.
- Market Concentration: The top 5 players account for approximately xx% of the global market share in 2025.
- Technological Innovation: Ongoing advancements in fiber optic technology, including the development of smaller, faster, and more precise fusion splicers, are key drivers.
- Regulatory Landscape: Government initiatives promoting broadband infrastructure development positively impact market growth.
- Competitive Substitutes: Mechanical splicing methods pose a competitive threat, although fusion splicing remains the dominant technology.
- End-User Demographics: Growth is primarily driven by telecommunication companies, followed by the cable TV and enterprise sectors.
- M&A Activity: The past five years have witnessed xx M&A deals in the Fusion Splicer industry, indicating consolidation trends.
Fusion Splicer Industry Growth Trends & Insights
The Fusion Splicer market has experienced a Compound Annual Growth Rate (CAGR) of xx% during the historical period (2019-2024). This growth is attributed to several factors, including the increasing adoption of fiber optic networks for high-speed data transmission and the expansion of 5G networks. Technological advancements, such as the introduction of automated fusion splicers, are driving efficiency and reducing operational costs. Market penetration is projected to reach xx% by 2033, driven by increasing demand for high-bandwidth connectivity in residential and enterprise settings. Consumer behavior shifts toward higher data consumption further fuel this growth. Specific metrics, such as regional adoption rates and technological shifts, are detailed within the full report.
Dominant Regions, Countries, or Segments in Fusion Splicer Industry
The Telecommunications sector is the dominant application segment, accounting for approximately xx% of the market in 2025. Within alignment types, Core Alignment dominates due to higher precision requirements in high-bandwidth networks. Asia-Pacific, particularly China, is the leading regional market, driven by significant investments in fiber optic infrastructure development and expanding 5G networks. North America follows as a strong regional market due to the robust telecommunications infrastructure.
- Key Drivers in Asia-Pacific:
- Massive investments in 5G infrastructure.
- Government policies supporting broadband expansion.
- Rapid urbanization and growing internet penetration.
- Key Drivers in North America:
- Upgrades to existing fiber optic networks.
- Expansion of data centers.
- Growth in cloud computing and related services.
Fusion Splicer Industry Product Landscape
Fusion splicers are evolving towards greater automation, miniaturization, and improved precision. Key innovations include automated fiber alignment, advanced splicing algorithms, and improved user interfaces. This allows for faster and more efficient splicing operations, reducing labor costs and improving overall network deployment speed. Unique selling propositions focus on speed, precision, reliability, and ease of use.
Key Drivers, Barriers & Challenges in Fusion Splicer Industry
Key Drivers: Increased demand for high-bandwidth communication, widespread 5G deployment, rising investment in fiber optic infrastructure, and technological advancements in fusion splicing technology. The development of more compact and user-friendly devices is a significant driver.
Key Challenges: Supply chain disruptions impacting the availability of key components, intense competition from established players and emerging market entrants, and the potential for regulatory hurdles in certain regions. Price competition and technological obsolescence also present significant challenges.
Emerging Opportunities in Fusion Splicer Industry
Emerging opportunities lie in the expansion of fiber-to-the-home (FTTH) networks, growth in the data center sector, and the development of innovative applications in areas such as underwater fiber optic cables and sensor networks. Untapped markets in developing economies present significant growth potential.
Growth Accelerators in the Fusion Splicer Industry Industry
Technological breakthroughs, such as the development of more efficient and cost-effective fusion splicing technologies, are key growth catalysts. Strategic partnerships between manufacturers and network operators enhance market penetration, while expansion into new geographical markets and diversification into adjacent applications contribute to sustained growth.
Key Players Shaping the Fusion Splicer Industry Market
- Ilsintech Co Ltd
- Signal Fire Technology Co Ltd
- Nanjing Jilong Optical Communication Co Ltd
- Furukawa Electric Co Ltd
- Greenlee Communication
- INNO Instruments Inc
- China Electronics Technology Group Corporation
- Fujikura Ltd
- Fiberfox Inc
- Shenzhen Ruiyan Communication Equipment Co Ltd
- Skycome Express LLC
- Shanghai Xianghe Optical Fiber Communication Co Ltd
- GAO Tek & GAO Group Inc
- Darkhorsechina (Beijing) Telecom Tech Co Ltd
- Sumitomo Electric Industries Ltd
- Eloik Communication Equipment Technology Co Ltd
Notable Milestones in Fusion Splicer Industry Sector
- 2021: Launch of a new generation of automated fusion splicers by Fujikura.
- 2022: Acquisition of a smaller fusion splicer manufacturer by Sumitomo Electric.
- 2023: Introduction of a new cladding alignment fusion splicer with enhanced precision. (Further milestones will be detailed in the full report)
In-Depth Fusion Splicer Industry Market Outlook
The Fusion Splicer market is poised for continued growth driven by the ever-increasing demand for high-speed data and the expansion of fiber optic networks globally. Strategic opportunities exist for companies focused on innovation, technological advancements, and expansion into emerging markets. The long-term outlook remains positive, with significant growth potential in both developed and developing economies.
Fusion Splicer Industry Segmentation
-
1. Alignment Type
- 1.1. Core Alignment
- 1.2. Cladding Alignment
-
2. Application
- 2.1. Telecommunications
- 2.2. Aerospace & Defense
- 2.3. Premises & Enterprise
- 2.4. Cable TV
- 2.5. Other Applications
Fusion Splicer Industry Segmentation By Geography
- 1. North America
- 2. Europe
- 3. Asia Pacific
- 4. Rest of the World
Fusion Splicer Industry Regional Market Share
Geographic Coverage of Fusion Splicer Industry
Fusion Splicer Industry REPORT HIGHLIGHTS
| Aspects | Details |
|---|---|
| Study Period | 2020-2034 |
| Base Year | 2025 |
| Estimated Year | 2026 |
| Forecast Period | 2026-2034 |
| Historical Period | 2020-2025 |
| Growth Rate | CAGR of 4.56% from 2020-2034 |
| Segmentation |
|
Table of Contents
- 1. Introduction
- 1.1. Research Scope
- 1.2. Market Segmentation
- 1.3. Research Objective
- 1.4. Definitions and Assumptions
- 2. Executive Summary
- 2.1. Market Snapshot
- 3. Market Dynamics
- 3.1. Market Drivers
- 3.2. Market Restrains
- 3.3. Market Trends
- 3.4. Market Opportunities
- 4. Market Factor Analysis
- 4.1. Porters Five Forces
- 4.1.1. Bargaining Power of Suppliers
- 4.1.2. Bargaining Power of Buyers
- 4.1.3. Threat of New Entrants
- 4.1.4. Threat of Substitutes
- 4.1.5. Competitive Rivalry
- 4.2. PESTEL analysis
- 4.3. BCG Analysis
- 4.3.1. Stars (High Growth, High Market Share)
- 4.3.2. Cash Cows (Low Growth, High Market Share)
- 4.3.3. Question Mark (High Growth, Low Market Share)
- 4.3.4. Dogs (Low Growth, Low Market Share)
- 4.4. Ansoff Matrix Analysis
- 4.5. Supply Chain Analysis
- 4.6. Regulatory Landscape
- 4.7. Current Market Potential and Opportunity Assessment (TAM–SAM–SOM Framework)
- 4.8. IMR Analyst Note
- 4.1. Porters Five Forces
- 5. Market Analysis, Insights and Forecast 2021-2033
- 5.1. Market Analysis, Insights and Forecast - by Alignment Type
- 5.1.1. Core Alignment
- 5.1.2. Cladding Alignment
- 5.2. Market Analysis, Insights and Forecast - by Application
- 5.2.1. Telecommunications
- 5.2.2. Aerospace & Defense
- 5.2.3. Premises & Enterprise
- 5.2.4. Cable TV
- 5.2.5. Other Applications
- 5.3. Market Analysis, Insights and Forecast - by Region
- 5.3.1. North America
- 5.3.2. Europe
- 5.3.3. Asia Pacific
- 5.3.4. Rest of the World
- 5.1. Market Analysis, Insights and Forecast - by Alignment Type
- 6. Global Fusion Splicer Industry Analysis, Insights and Forecast, 2021-2033
- 6.1. Market Analysis, Insights and Forecast - by Alignment Type
- 6.1.1. Core Alignment
- 6.1.2. Cladding Alignment
- 6.2. Market Analysis, Insights and Forecast - by Application
- 6.2.1. Telecommunications
- 6.2.2. Aerospace & Defense
- 6.2.3. Premises & Enterprise
- 6.2.4. Cable TV
- 6.2.5. Other Applications
- 6.1. Market Analysis, Insights and Forecast - by Alignment Type
- 7. North America Fusion Splicer Industry Analysis, Insights and Forecast, 2020-2032
- 7.1. Market Analysis, Insights and Forecast - by Alignment Type
- 7.1.1. Core Alignment
- 7.1.2. Cladding Alignment
- 7.2. Market Analysis, Insights and Forecast - by Application
- 7.2.1. Telecommunications
- 7.2.2. Aerospace & Defense
- 7.2.3. Premises & Enterprise
- 7.2.4. Cable TV
- 7.2.5. Other Applications
- 7.1. Market Analysis, Insights and Forecast - by Alignment Type
- 8. Europe Fusion Splicer Industry Analysis, Insights and Forecast, 2020-2032
- 8.1. Market Analysis, Insights and Forecast - by Alignment Type
- 8.1.1. Core Alignment
- 8.1.2. Cladding Alignment
- 8.2. Market Analysis, Insights and Forecast - by Application
- 8.2.1. Telecommunications
- 8.2.2. Aerospace & Defense
- 8.2.3. Premises & Enterprise
- 8.2.4. Cable TV
- 8.2.5. Other Applications
- 8.1. Market Analysis, Insights and Forecast - by Alignment Type
- 9. Asia Pacific Fusion Splicer Industry Analysis, Insights and Forecast, 2020-2032
- 9.1. Market Analysis, Insights and Forecast - by Alignment Type
- 9.1.1. Core Alignment
- 9.1.2. Cladding Alignment
- 9.2. Market Analysis, Insights and Forecast - by Application
- 9.2.1. Telecommunications
- 9.2.2. Aerospace & Defense
- 9.2.3. Premises & Enterprise
- 9.2.4. Cable TV
- 9.2.5. Other Applications
- 9.1. Market Analysis, Insights and Forecast - by Alignment Type
- 10. Rest of the World Fusion Splicer Industry Analysis, Insights and Forecast, 2020-2032
- 10.1. Market Analysis, Insights and Forecast - by Alignment Type
- 10.1.1. Core Alignment
- 10.1.2. Cladding Alignment
- 10.2. Market Analysis, Insights and Forecast - by Application
- 10.2.1. Telecommunications
- 10.2.2. Aerospace & Defense
- 10.2.3. Premises & Enterprise
- 10.2.4. Cable TV
- 10.2.5. Other Applications
- 10.1. Market Analysis, Insights and Forecast - by Alignment Type
- 11. Competitive Analysis
- 11.1. Company Profiles
- 11.1.1 Ilsintech Co Ltd
- 11.1.1.1. Company Overview
- 11.1.1.2. Products
- 11.1.1.3. Company Financials
- 11.1.1.4. SWOT Analysis
- 11.1.2 Signal Fire Technology Co Ltd
- 11.1.2.1. Company Overview
- 11.1.2.2. Products
- 11.1.2.3. Company Financials
- 11.1.2.4. SWOT Analysis
- 11.1.3 Nanjing Jilong Optical Communication Co Ltd
- 11.1.3.1. Company Overview
- 11.1.3.2. Products
- 11.1.3.3. Company Financials
- 11.1.3.4. SWOT Analysis
- 11.1.4 Furukawa Electric Co Ltd
- 11.1.4.1. Company Overview
- 11.1.4.2. Products
- 11.1.4.3. Company Financials
- 11.1.4.4. SWOT Analysis
- 11.1.5 Greenlee Communication
- 11.1.5.1. Company Overview
- 11.1.5.2. Products
- 11.1.5.3. Company Financials
- 11.1.5.4. SWOT Analysis
- 11.1.6 INNO Instruments Inc
- 11.1.6.1. Company Overview
- 11.1.6.2. Products
- 11.1.6.3. Company Financials
- 11.1.6.4. SWOT Analysis
- 11.1.7 China Electronics Technology Group Corporation
- 11.1.7.1. Company Overview
- 11.1.7.2. Products
- 11.1.7.3. Company Financials
- 11.1.7.4. SWOT Analysis
- 11.1.8 Nanjing Jilong Optical Communication Co Ltd
- 11.1.8.1. Company Overview
- 11.1.8.2. Products
- 11.1.8.3. Company Financials
- 11.1.8.4. SWOT Analysis
- 11.1.9 Fujikura Ltd
- 11.1.9.1. Company Overview
- 11.1.9.2. Products
- 11.1.9.3. Company Financials
- 11.1.9.4. SWOT Analysis
- 11.1.10 Fiberfox Inc
- 11.1.10.1. Company Overview
- 11.1.10.2. Products
- 11.1.10.3. Company Financials
- 11.1.10.4. SWOT Analysis
- 11.1.11 Shenzhen Ruiyan Communication Equipment Co Ltd
- 11.1.11.1. Company Overview
- 11.1.11.2. Products
- 11.1.11.3. Company Financials
- 11.1.11.4. SWOT Analysis
- 11.1.12 Skycome Express LLC
- 11.1.12.1. Company Overview
- 11.1.12.2. Products
- 11.1.12.3. Company Financials
- 11.1.12.4. SWOT Analysis
- 11.1.13 Shanghai Xianghe Optical Fiber Communication Co Ltd
- 11.1.13.1. Company Overview
- 11.1.13.2. Products
- 11.1.13.3. Company Financials
- 11.1.13.4. SWOT Analysis
- 11.1.14 GAO Tek & GAO Group Inc
- 11.1.14.1. Company Overview
- 11.1.14.2. Products
- 11.1.14.3. Company Financials
- 11.1.14.4. SWOT Analysis
- 11.1.15 Darkhorsechina (Beijing) Telecom Tech Co Ltd
- 11.1.15.1. Company Overview
- 11.1.15.2. Products
- 11.1.15.3. Company Financials
- 11.1.15.4. SWOT Analysis
- 11.1.16 Sumitomo Electric Industries Ltd
- 11.1.16.1. Company Overview
- 11.1.16.2. Products
- 11.1.16.3. Company Financials
- 11.1.16.4. SWOT Analysis
- 11.1.17 Eloik Communication Equipment Technology Co Ltd
- 11.1.17.1. Company Overview
- 11.1.17.2. Products
- 11.1.17.3. Company Financials
- 11.1.17.4. SWOT Analysis
- 11.1.1 Ilsintech Co Ltd
- 11.2. Market Entropy
- 11.2.1 Company's Key Areas Served
- 11.2.2 Recent Developments
- 11.3. Company Market Share Analysis 2025
- 11.3.1 Top 5 Companies Market Share Analysis
- 11.3.2 Top 3 Companies Market Share Analysis
- 11.4. List of Potential Customers
- 12. Research Methodology
List of Figures
- Figure 1: Global Fusion Splicer Industry Revenue Breakdown (million, %) by Region 2025 & 2033
- Figure 2: North America Fusion Splicer Industry Revenue (million), by Alignment Type 2025 & 2033
- Figure 3: North America Fusion Splicer Industry Revenue Share (%), by Alignment Type 2025 & 2033
- Figure 4: North America Fusion Splicer Industry Revenue (million), by Application 2025 & 2033
- Figure 5: North America Fusion Splicer Industry Revenue Share (%), by Application 2025 & 2033
- Figure 6: North America Fusion Splicer Industry Revenue (million), by Country 2025 & 2033
- Figure 7: North America Fusion Splicer Industry Revenue Share (%), by Country 2025 & 2033
- Figure 8: Europe Fusion Splicer Industry Revenue (million), by Alignment Type 2025 & 2033
- Figure 9: Europe Fusion Splicer Industry Revenue Share (%), by Alignment Type 2025 & 2033
- Figure 10: Europe Fusion Splicer Industry Revenue (million), by Application 2025 & 2033
- Figure 11: Europe Fusion Splicer Industry Revenue Share (%), by Application 2025 & 2033
- Figure 12: Europe Fusion Splicer Industry Revenue (million), by Country 2025 & 2033
- Figure 13: Europe Fusion Splicer Industry Revenue Share (%), by Country 2025 & 2033
- Figure 14: Asia Pacific Fusion Splicer Industry Revenue (million), by Alignment Type 2025 & 2033
- Figure 15: Asia Pacific Fusion Splicer Industry Revenue Share (%), by Alignment Type 2025 & 2033
- Figure 16: Asia Pacific Fusion Splicer Industry Revenue (million), by Application 2025 & 2033
- Figure 17: Asia Pacific Fusion Splicer Industry Revenue Share (%), by Application 2025 & 2033
- Figure 18: Asia Pacific Fusion Splicer Industry Revenue (million), by Country 2025 & 2033
- Figure 19: Asia Pacific Fusion Splicer Industry Revenue Share (%), by Country 2025 & 2033
- Figure 20: Rest of the World Fusion Splicer Industry Revenue (million), by Alignment Type 2025 & 2033
- Figure 21: Rest of the World Fusion Splicer Industry Revenue Share (%), by Alignment Type 2025 & 2033
- Figure 22: Rest of the World Fusion Splicer Industry Revenue (million), by Application 2025 & 2033
- Figure 23: Rest of the World Fusion Splicer Industry Revenue Share (%), by Application 2025 & 2033
- Figure 24: Rest of the World Fusion Splicer Industry Revenue (million), by Country 2025 & 2033
- Figure 25: Rest of the World Fusion Splicer Industry Revenue Share (%), by Country 2025 & 2033
List of Tables
- Table 1: Global Fusion Splicer Industry Revenue million Forecast, by Alignment Type 2020 & 2033
- Table 2: Global Fusion Splicer Industry Revenue million Forecast, by Application 2020 & 2033
- Table 3: Global Fusion Splicer Industry Revenue million Forecast, by Region 2020 & 2033
- Table 4: Global Fusion Splicer Industry Revenue million Forecast, by Alignment Type 2020 & 2033
- Table 5: Global Fusion Splicer Industry Revenue million Forecast, by Application 2020 & 2033
- Table 6: Global Fusion Splicer Industry Revenue million Forecast, by Country 2020 & 2033
- Table 7: Global Fusion Splicer Industry Revenue million Forecast, by Alignment Type 2020 & 2033
- Table 8: Global Fusion Splicer Industry Revenue million Forecast, by Application 2020 & 2033
- Table 9: Global Fusion Splicer Industry Revenue million Forecast, by Country 2020 & 2033
- Table 10: Global Fusion Splicer Industry Revenue million Forecast, by Alignment Type 2020 & 2033
- Table 11: Global Fusion Splicer Industry Revenue million Forecast, by Application 2020 & 2033
- Table 12: Global Fusion Splicer Industry Revenue million Forecast, by Country 2020 & 2033
- Table 13: Global Fusion Splicer Industry Revenue million Forecast, by Alignment Type 2020 & 2033
- Table 14: Global Fusion Splicer Industry Revenue million Forecast, by Application 2020 & 2033
- Table 15: Global Fusion Splicer Industry Revenue million Forecast, by Country 2020 & 2033
Frequently Asked Questions
1. What is the projected Compound Annual Growth Rate (CAGR) of the Fusion Splicer Industry?
The projected CAGR is approximately 4.56%.
2. Which companies are prominent players in the Fusion Splicer Industry?
Key companies in the market include Ilsintech Co Ltd, Signal Fire Technology Co Ltd, Nanjing Jilong Optical Communication Co Ltd, Furukawa Electric Co Ltd, Greenlee Communication, INNO Instruments Inc, China Electronics Technology Group Corporation, Nanjing Jilong Optical Communication Co Ltd, Fujikura Ltd, Fiberfox Inc, Shenzhen Ruiyan Communication Equipment Co Ltd, Skycome Express LLC, Shanghai Xianghe Optical Fiber Communication Co Ltd, GAO Tek & GAO Group Inc, Darkhorsechina (Beijing) Telecom Tech Co Ltd, Sumitomo Electric Industries Ltd, Eloik Communication Equipment Technology Co Ltd.
3. What are the main segments of the Fusion Splicer Industry?
The market segments include Alignment Type, Application.
4. Can you provide details about the market size?
The market size is estimated to be USD 876.3 million as of 2022.
5. What are some drivers contributing to market growth?
; Augmented Demand for Increased Network Bandwidth; Growth in Government Funding for Fiber Optic Networks.
6. What are the notable trends driving market growth?
Telecom and Enterprise Application to Continue Dominating the Market.
7. Are there any restraints impacting market growth?
; Huge Cost of Equipment; Lack of Technical Knowledge.
8. Can you provide examples of recent developments in the market?
N/A
9. What pricing options are available for accessing the report?
Pricing options include single-user, multi-user, and enterprise licenses priced at USD 4750, USD 5250, and USD 8750 respectively.
10. Is the market size provided in terms of value or volume?
The market size is provided in terms of value, measured in million.
11. Are there any specific market keywords associated with the report?
Yes, the market keyword associated with the report is "Fusion Splicer Industry," which aids in identifying and referencing the specific market segment covered.
12. How do I determine which pricing option suits my needs best?
The pricing options vary based on user requirements and access needs. Individual users may opt for single-user licenses, while businesses requiring broader access may choose multi-user or enterprise licenses for cost-effective access to the report.
13. Are there any additional resources or data provided in the Fusion Splicer Industry report?
While the report offers comprehensive insights, it's advisable to review the specific contents or supplementary materials provided to ascertain if additional resources or data are available.
14. How can I stay updated on further developments or reports in the Fusion Splicer Industry?
To stay informed about further developments, trends, and reports in the Fusion Splicer Industry, consider subscribing to industry newsletters, following relevant companies and organizations, or regularly checking reputable industry news sources and publications.
Methodology
Step 1 - Identification of Relevant Samples Size from Population Database


Step 2 - Approaches for Defining Global Market Size (Value, Volume* & Price*)

Note*: In applicable scenarios
Step 3 - Data Sources
Primary Research
- Web Analytics
- Survey Reports
- Research Institute
- Latest Research Reports
- Opinion Leaders
Secondary Research
- Annual Reports
- White Paper
- Latest Press Release
- Industry Association
- Paid Database
- Investor Presentations

Step 4 - Data Triangulation
Involves using different sources of information in order to increase the validity of a study
These sources are likely to be stakeholders in a program - participants, other researchers, program staff, other community members, and so on.
Then we put all data in single framework & apply various statistical tools to find out the dynamic on the market.
During the analysis stage, feedback from the stakeholder groups would be compared to determine areas of agreement as well as areas of divergence