

Key Insights
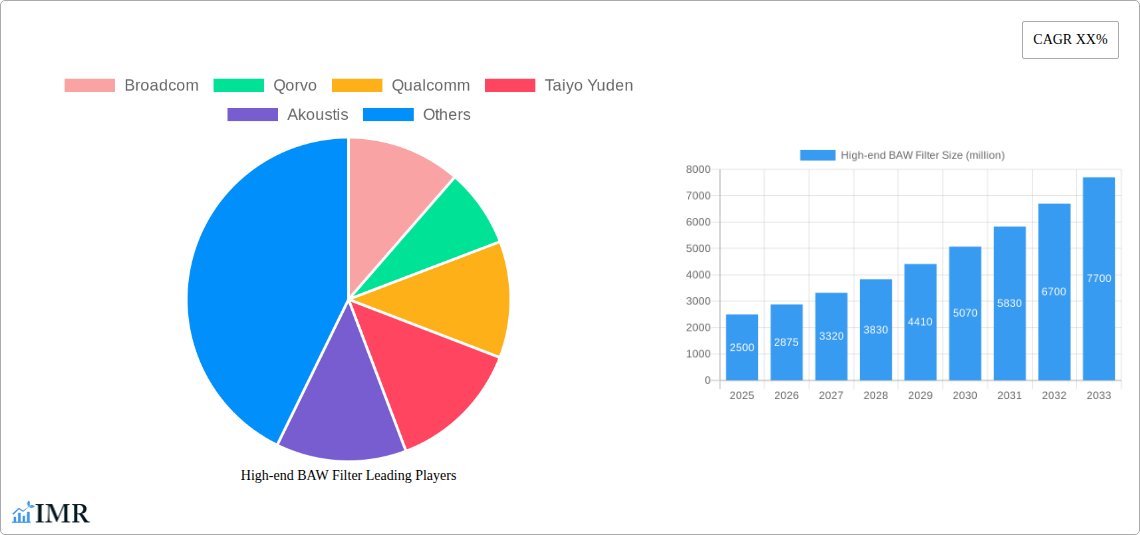
The advanced Bulk Acoustic Wave (BAW) filter market is poised for substantial expansion, propelled by the escalating adoption of 5G and cutting-edge wireless technologies. BAW filters offer superior performance, including enhanced linearity and power handling at higher frequencies, making them indispensable for next-generation smartphones, base stations, and other high-frequency communication devices. The market is projected to reach $8.2 billion by 2025, with an estimated Compound Annual Growth Rate (CAGR) of 6.74% from 2025 to 2033. Continuous innovation in BAW filter design and manufacturing is driving smaller form factors, improved efficiency, and cost reductions. Leading companies like Broadcom, Qorvo, and Qualcomm are investing heavily in research and development to maintain their market leadership. The market is segmented by application (e.g., smartphones, infrastructure, wearables), frequency range, and geography. The Asia-Pacific region, particularly China, is anticipated to be a key growth driver due to its thriving consumer electronics sector and rapid 5G infrastructure deployment. Despite manufacturing complexities and potential supply chain vulnerabilities, the market's outlook remains highly optimistic, fueled by the persistent demand for increased bandwidth and enhanced connectivity across diverse applications.
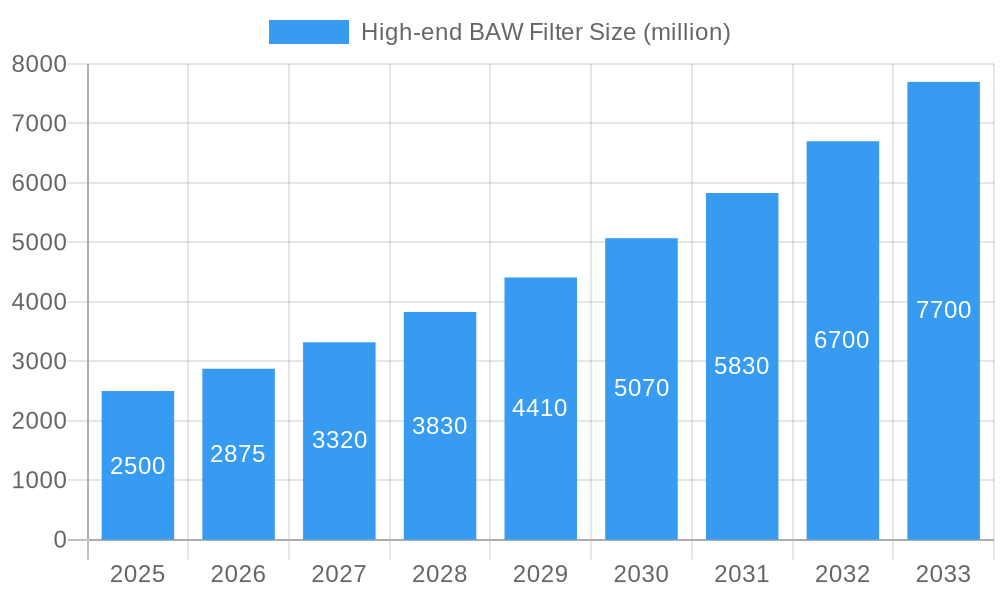
High-end BAW Filter Market Size (In Billion)
The competitive environment features both established industry leaders and innovative emerging players. Major companies such as Broadcom, Qorvo, Qualcomm, and Skyworks dominate through their robust manufacturing capabilities and strong customer ties. Smaller entities like Akoustis and numerous Chinese manufacturers (ROFS Microsystem, Epic Mems, Suzhou Huntersun, Ningbo Semiconductor) are actively challenging established players by focusing on innovation and localized production, leveraging advancements in materials science and manufacturing to improve filter performance and lower costs. Market consolidation is anticipated, enabling companies to achieve economies of scale and broaden their product offerings. Geographic expansion and strategic alliances will be critical in defining future market dynamics, further stimulating growth and innovation.
High-end BAW Filter Company Market Share
High-End BAW Filter Market Report: 2019-2033
This comprehensive report provides an in-depth analysis of the high-end Bulk Acoustic Wave (BAW) filter market, encompassing market dynamics, growth trends, regional segmentation, product landscape, key players, and future outlook. The report covers the period from 2019 to 2033, with 2025 serving as the base and estimated year. This detailed analysis caters to industry professionals, investors, and researchers seeking a comprehensive understanding of this rapidly evolving market segment within the broader RF filter market. The report leverages extensive data analysis and expert insights to provide actionable intelligence.
High-end BAW Filter Market Dynamics & Structure
This section analyzes the high-end BAW filter market's competitive landscape, technological advancements, regulatory influences, and market trends. The study period (2019-2024) reveals a progressively consolidating market with key players like Broadcom, Qorvo, and Qualcomm holding significant market share. The forecast period (2025-2033) anticipates continued consolidation driven by M&A activity.
- Market Concentration: The high-end BAW filter market exhibits moderate concentration, with the top 5 players controlling approximately xx% of the market in 2025. This is expected to increase to xx% by 2033.
- Technological Innovation: Continuous innovation in BAW filter design, materials, and manufacturing processes is a key driver. Miniaturization, improved performance (higher frequencies, lower insertion loss), and enhanced temperature stability are ongoing focal points.
- Regulatory Frameworks: Government regulations concerning radio frequency emissions and spectrum allocation significantly influence the market. Compliance costs and standards variations across regions pose challenges.
- Competitive Substitutes: Surface Acoustic Wave (SAW) filters remain a major competitor, although BAW filters offer advantages in higher frequency applications and demanding environments.
- End-User Demographics: The primary end-users are in the mobile communication, wireless infrastructure, and automotive sectors. Growth in 5G and IoT applications fuels market demand.
- M&A Trends: The past five years have witnessed xx M&A deals in the high-end BAW filter sector, primarily focused on acquiring specialized technology and expanding market reach. This trend is anticipated to continue, leading to further market consolidation. Innovation barriers, such as high R&D costs and complex manufacturing processes, contribute to this trend.
High-end BAW Filter Growth Trends & Insights
The high-end BAW filter market experienced robust growth during the historical period (2019-2024), with a CAGR of xx%. This growth trajectory is projected to continue in the forecast period (2025-2033), albeit at a slightly moderated pace, with an anticipated CAGR of xx%. The increasing adoption of 5G technology, the expansion of IoT devices, and the growing demand for high-performance RF filters across various applications are the primary catalysts for this growth. The market size is estimated at $xx billion in 2025 and is projected to reach $xx billion by 2033. Market penetration in key segments like smartphones and base stations is expected to rise significantly during the forecast period. Technological disruptions, such as the introduction of new materials and fabrication techniques, are constantly shaping the landscape, leading to improved filter performance and reduced costs. Consumer demand for high-quality, reliable connectivity in mobile devices and various other electronic applications is a significant factor contributing to the high-end BAW filter market's expansion.
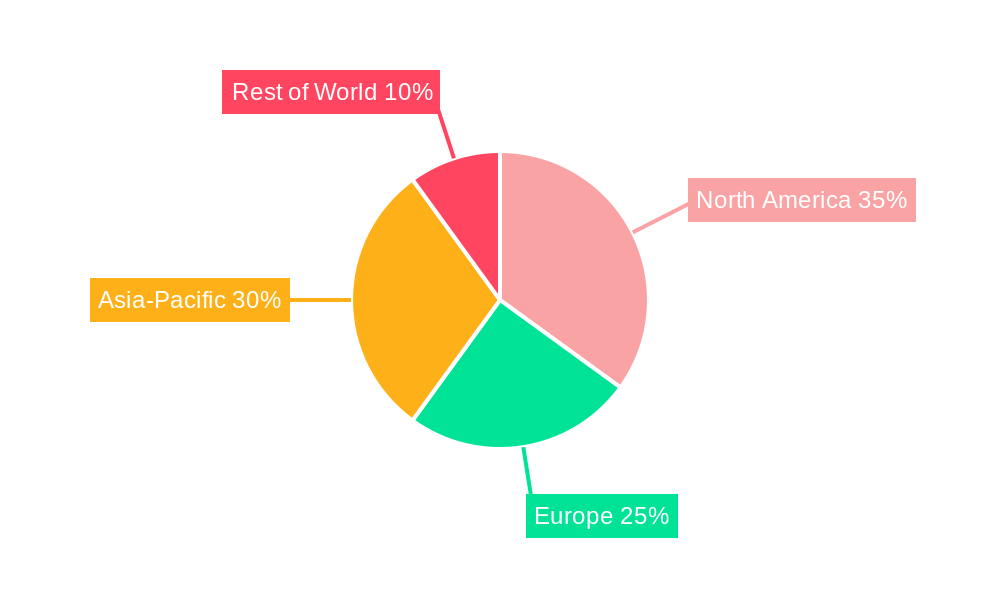
Dominant Regions, Countries, or Segments in High-end BAW Filter
North America currently holds the largest market share in the high-end BAW filter market, driven by strong demand from the telecommunications and automotive industries. Asia-Pacific is expected to experience the highest growth rate during the forecast period, fueled by the rapid expansion of the 5G infrastructure and the increasing penetration of smartphones and IoT devices in developing economies.
- North America: Strong presence of key players, advanced technological infrastructure, and high demand from the telecommunications and defense sectors.
- Asia-Pacific: Rapid growth in 5G infrastructure development and increasing adoption of smartphones and IoT devices.
- Europe: Steady growth driven by advancements in the automotive and industrial automation sectors.
Market share dominance is largely driven by the concentration of major manufacturers, strong local demand in the North American market, and the rapid growth trajectory of the Asia-Pacific region's 5G and IoT deployment initiatives.
High-end BAW Filter Product Landscape
High-end BAW filters are characterized by their high frequency capabilities, low insertion loss, and excellent temperature stability, making them ideal for demanding applications such as 5G mobile devices, wireless infrastructure, and automotive radar systems. Recent product innovations include advancements in materials science, leading to smaller form factors and improved performance metrics. Unique selling propositions often center on superior out-of-band rejection, improved power handling, and enhanced reliability under challenging operating conditions.
Key Drivers, Barriers & Challenges in High-end BAW Filter
Key Drivers:
- The proliferation of 5G technology and the expanding IoT ecosystem are driving strong demand for high-performance RF filters.
- Advancements in BAW filter design and manufacturing processes continuously improve performance and reduce costs.
- Increasing demand from the automotive industry for advanced driver-assistance systems (ADAS) and connected car features.
Key Challenges and Restraints:
- High manufacturing costs remain a significant barrier, especially for smaller manufacturers.
- Competition from alternative technologies, such as SAW filters, continues to exist.
- Supply chain disruptions and the availability of specialized materials can impact production and market availability. These disruptions have historically resulted in xx% price fluctuations and xx% production shortfalls.
Emerging Opportunities in High-end BAW Filter
- Expansion into new applications such as satellite communications and high-frequency radar systems presents significant growth potential.
- Development of BAW filters for mmWave frequencies is crucial for supporting the continued evolution of 5G and beyond-5G technologies.
- Innovations in packaging and integration techniques can lead to cost reductions and improved device performance.
Growth Accelerators in the High-end BAW Filter Industry
Technological breakthroughs in materials science and manufacturing processes are key growth accelerators. Strategic partnerships between filter manufacturers and device makers are crucial for optimizing product development and integration. Expanding into new markets and exploring innovative applications will play a vital role in driving long-term growth. Expansion into the wearables market and development of highly miniaturized BAW filters for this sector represents a significant opportunity.
Notable Milestones in High-end BAW Filter Sector
- 2020: Broadcom announced a new high-frequency BAW filter for 5G applications.
- 2021: Qorvo launched a series of BAW filters optimized for mmWave frequencies.
- 2022: A significant merger between two smaller BAW filter manufacturers expanded market presence.
- 2023: Development of new materials allowed for improved power handling capabilities in BAW filters.
(Further milestones need to be added based on actual market data)
In-Depth High-end BAW Filter Market Outlook
The high-end BAW filter market is poised for continued growth, driven by technological innovation, expanding application areas, and the increasing demand for high-performance RF solutions. Strategic partnerships and investments in R&D will be essential for maintaining a competitive edge. The focus on miniaturization, improved performance, and cost reduction will shape future market dynamics. The integration of BAW filters into next-generation communication technologies and the continued evolution of the IoT ecosystem offer substantial opportunities for long-term expansion.
High-end BAW Filter Segmentation
-
1. Application
- 1.1. Smart Phone
- 1.2. Wi-Fi
- 1.3. Tablet PC
- 1.4. Other
-
2. Types
- 2.1. FBAR BAW Filters
- 2.2. SMR BAW Filters
High-end BAW Filter Segmentation By Geography
-
1. North America
- 1.1. United States
- 1.2. Canada
- 1.3. Mexico
-
2. South America
- 2.1. Brazil
- 2.2. Argentina
- 2.3. Rest of South America
-
3. Europe
- 3.1. United Kingdom
- 3.2. Germany
- 3.3. France
- 3.4. Italy
- 3.5. Spain
- 3.6. Russia
- 3.7. Benelux
- 3.8. Nordics
- 3.9. Rest of Europe
-
4. Middle East & Africa
- 4.1. Turkey
- 4.2. Israel
- 4.3. GCC
- 4.4. North Africa
- 4.5. South Africa
- 4.6. Rest of Middle East & Africa
-
5. Asia Pacific
- 5.1. China
- 5.2. India
- 5.3. Japan
- 5.4. South Korea
- 5.5. ASEAN
- 5.6. Oceania
- 5.7. Rest of Asia Pacific
High-end BAW Filter Regional Market Share
Geographic Coverage of High-end BAW Filter
High-end BAW Filter REPORT HIGHLIGHTS
| Aspects | Details |
|---|---|
| Study Period | 2020-2034 |
| Base Year | 2025 |
| Estimated Year | 2026 |
| Forecast Period | 2026-2034 |
| Historical Period | 2020-2025 |
| Growth Rate | CAGR of 6.74% from 2020-2034 |
| Segmentation |
|
Table of Contents
- 1. Introduction
- 1.1. Research Scope
- 1.2. Market Segmentation
- 1.3. Research Objective
- 1.4. Definitions and Assumptions
- 2. Executive Summary
- 2.1. Market Snapshot
- 3. Market Dynamics
- 3.1. Market Drivers
- 3.2. Market Restrains
- 3.3. Market Trends
- 3.4. Market Opportunities
- 4. Market Factor Analysis
- 4.1. Porters Five Forces
- 4.1.1. Bargaining Power of Suppliers
- 4.1.2. Bargaining Power of Buyers
- 4.1.3. Threat of New Entrants
- 4.1.4. Threat of Substitutes
- 4.1.5. Competitive Rivalry
- 4.2. PESTEL analysis
- 4.3. BCG Analysis
- 4.3.1. Stars (High Growth, High Market Share)
- 4.3.2. Cash Cows (Low Growth, High Market Share)
- 4.3.3. Question Mark (High Growth, Low Market Share)
- 4.3.4. Dogs (Low Growth, Low Market Share)
- 4.4. Ansoff Matrix Analysis
- 4.5. Supply Chain Analysis
- 4.6. Regulatory Landscape
- 4.7. Current Market Potential and Opportunity Assessment (TAM–SAM–SOM Framework)
- 4.8. IMR Analyst Note
- 4.1. Porters Five Forces
- 5. Market Analysis, Insights and Forecast 2021-2033
- 5.1. Market Analysis, Insights and Forecast - by Application
- 5.1.1. Smart Phone
- 5.1.2. Wi-Fi
- 5.1.3. Tablet PC
- 5.1.4. Other
- 5.2. Market Analysis, Insights and Forecast - by Types
- 5.2.1. FBAR BAW Filters
- 5.2.2. SMR BAW Filters
- 5.3. Market Analysis, Insights and Forecast - by Region
- 5.3.1. North America
- 5.3.2. South America
- 5.3.3. Europe
- 5.3.4. Middle East & Africa
- 5.3.5. Asia Pacific
- 5.1. Market Analysis, Insights and Forecast - by Application
- 6. Global High-end BAW Filter Analysis, Insights and Forecast, 2021-2033
- 6.1. Market Analysis, Insights and Forecast - by Application
- 6.1.1. Smart Phone
- 6.1.2. Wi-Fi
- 6.1.3. Tablet PC
- 6.1.4. Other
- 6.2. Market Analysis, Insights and Forecast - by Types
- 6.2.1. FBAR BAW Filters
- 6.2.2. SMR BAW Filters
- 6.1. Market Analysis, Insights and Forecast - by Application
- 7. North America High-end BAW Filter Analysis, Insights and Forecast, 2020-2032
- 7.1. Market Analysis, Insights and Forecast - by Application
- 7.1.1. Smart Phone
- 7.1.2. Wi-Fi
- 7.1.3. Tablet PC
- 7.1.4. Other
- 7.2. Market Analysis, Insights and Forecast - by Types
- 7.2.1. FBAR BAW Filters
- 7.2.2. SMR BAW Filters
- 7.1. Market Analysis, Insights and Forecast - by Application
- 8. South America High-end BAW Filter Analysis, Insights and Forecast, 2020-2032
- 8.1. Market Analysis, Insights and Forecast - by Application
- 8.1.1. Smart Phone
- 8.1.2. Wi-Fi
- 8.1.3. Tablet PC
- 8.1.4. Other
- 8.2. Market Analysis, Insights and Forecast - by Types
- 8.2.1. FBAR BAW Filters
- 8.2.2. SMR BAW Filters
- 8.1. Market Analysis, Insights and Forecast - by Application
- 9. Europe High-end BAW Filter Analysis, Insights and Forecast, 2020-2032
- 9.1. Market Analysis, Insights and Forecast - by Application
- 9.1.1. Smart Phone
- 9.1.2. Wi-Fi
- 9.1.3. Tablet PC
- 9.1.4. Other
- 9.2. Market Analysis, Insights and Forecast - by Types
- 9.2.1. FBAR BAW Filters
- 9.2.2. SMR BAW Filters
- 9.1. Market Analysis, Insights and Forecast - by Application
- 10. Middle East & Africa High-end BAW Filter Analysis, Insights and Forecast, 2020-2032
- 10.1. Market Analysis, Insights and Forecast - by Application
- 10.1.1. Smart Phone
- 10.1.2. Wi-Fi
- 10.1.3. Tablet PC
- 10.1.4. Other
- 10.2. Market Analysis, Insights and Forecast - by Types
- 10.2.1. FBAR BAW Filters
- 10.2.2. SMR BAW Filters
- 10.1. Market Analysis, Insights and Forecast - by Application
- 11. Asia Pacific High-end BAW Filter Analysis, Insights and Forecast, 2020-2032
- 11.1. Market Analysis, Insights and Forecast - by Application
- 11.1.1. Smart Phone
- 11.1.2. Wi-Fi
- 11.1.3. Tablet PC
- 11.1.4. Other
- 11.2. Market Analysis, Insights and Forecast - by Types
- 11.2.1. FBAR BAW Filters
- 11.2.2. SMR BAW Filters
- 11.1. Market Analysis, Insights and Forecast - by Application
- 12. Competitive Analysis
- 12.1. Company Profiles
- 12.1.1 Broadcom
- 12.1.1.1. Company Overview
- 12.1.1.2. Products
- 12.1.1.3. Company Financials
- 12.1.1.4. SWOT Analysis
- 12.1.2 Qorvo
- 12.1.2.1. Company Overview
- 12.1.2.2. Products
- 12.1.2.3. Company Financials
- 12.1.2.4. SWOT Analysis
- 12.1.3 Qualcomm
- 12.1.3.1. Company Overview
- 12.1.3.2. Products
- 12.1.3.3. Company Financials
- 12.1.3.4. SWOT Analysis
- 12.1.4 Taiyo Yuden
- 12.1.4.1. Company Overview
- 12.1.4.2. Products
- 12.1.4.3. Company Financials
- 12.1.4.4. SWOT Analysis
- 12.1.5 Akoustis
- 12.1.5.1. Company Overview
- 12.1.5.2. Products
- 12.1.5.3. Company Financials
- 12.1.5.4. SWOT Analysis
- 12.1.6 Skyworks
- 12.1.6.1. Company Overview
- 12.1.6.2. Products
- 12.1.6.3. Company Financials
- 12.1.6.4. SWOT Analysis
- 12.1.7 ROFS Microsystem (Tianjin)Co.
- 12.1.7.1. Company Overview
- 12.1.7.2. Products
- 12.1.7.3. Company Financials
- 12.1.7.4. SWOT Analysis
- 12.1.8 Ltd.
- 12.1.8.1. Company Overview
- 12.1.8.2. Products
- 12.1.8.3. Company Financials
- 12.1.8.4. SWOT Analysis
- 12.1.9 Epic Mems (Xiamen) Co.
- 12.1.9.1. Company Overview
- 12.1.9.2. Products
- 12.1.9.3. Company Financials
- 12.1.9.4. SWOT Analysis
- 12.1.10 Ltd
- 12.1.10.1. Company Overview
- 12.1.10.2. Products
- 12.1.10.3. Company Financials
- 12.1.10.4. SWOT Analysis
- 12.1.11 Suzhou Huntersun Electronics Co.
- 12.1.11.1. Company Overview
- 12.1.11.2. Products
- 12.1.11.3. Company Financials
- 12.1.11.4. SWOT Analysis
- 12.1.12 Ltd.
- 12.1.12.1. Company Overview
- 12.1.12.2. Products
- 12.1.12.3. Company Financials
- 12.1.12.4. SWOT Analysis
- 12.1.13 Ningbo Semiconductor International Corporation
- 12.1.13.1. Company Overview
- 12.1.13.2. Products
- 12.1.13.3. Company Financials
- 12.1.13.4. SWOT Analysis
- 12.1.1 Broadcom
- 12.2. Market Entropy
- 12.2.1 Company's Key Areas Served
- 12.2.2 Recent Developments
- 12.3. Company Market Share Analysis 2025
- 12.3.1 Top 5 Companies Market Share Analysis
- 12.3.2 Top 3 Companies Market Share Analysis
- 12.4. List of Potential Customers
- 13. Research Methodology
List of Figures
- Figure 1: Global High-end BAW Filter Revenue Breakdown (billion, %) by Region 2025 & 2033
- Figure 2: Global High-end BAW Filter Volume Breakdown (K, %) by Region 2025 & 2033
- Figure 3: North America High-end BAW Filter Revenue (billion), by Application 2025 & 2033
- Figure 4: North America High-end BAW Filter Volume (K), by Application 2025 & 2033
- Figure 5: North America High-end BAW Filter Revenue Share (%), by Application 2025 & 2033
- Figure 6: North America High-end BAW Filter Volume Share (%), by Application 2025 & 2033
- Figure 7: North America High-end BAW Filter Revenue (billion), by Types 2025 & 2033
- Figure 8: North America High-end BAW Filter Volume (K), by Types 2025 & 2033
- Figure 9: North America High-end BAW Filter Revenue Share (%), by Types 2025 & 2033
- Figure 10: North America High-end BAW Filter Volume Share (%), by Types 2025 & 2033
- Figure 11: North America High-end BAW Filter Revenue (billion), by Country 2025 & 2033
- Figure 12: North America High-end BAW Filter Volume (K), by Country 2025 & 2033
- Figure 13: North America High-end BAW Filter Revenue Share (%), by Country 2025 & 2033
- Figure 14: North America High-end BAW Filter Volume Share (%), by Country 2025 & 2033
- Figure 15: South America High-end BAW Filter Revenue (billion), by Application 2025 & 2033
- Figure 16: South America High-end BAW Filter Volume (K), by Application 2025 & 2033
- Figure 17: South America High-end BAW Filter Revenue Share (%), by Application 2025 & 2033
- Figure 18: South America High-end BAW Filter Volume Share (%), by Application 2025 & 2033
- Figure 19: South America High-end BAW Filter Revenue (billion), by Types 2025 & 2033
- Figure 20: South America High-end BAW Filter Volume (K), by Types 2025 & 2033
- Figure 21: South America High-end BAW Filter Revenue Share (%), by Types 2025 & 2033
- Figure 22: South America High-end BAW Filter Volume Share (%), by Types 2025 & 2033
- Figure 23: South America High-end BAW Filter Revenue (billion), by Country 2025 & 2033
- Figure 24: South America High-end BAW Filter Volume (K), by Country 2025 & 2033
- Figure 25: South America High-end BAW Filter Revenue Share (%), by Country 2025 & 2033
- Figure 26: South America High-end BAW Filter Volume Share (%), by Country 2025 & 2033
- Figure 27: Europe High-end BAW Filter Revenue (billion), by Application 2025 & 2033
- Figure 28: Europe High-end BAW Filter Volume (K), by Application 2025 & 2033
- Figure 29: Europe High-end BAW Filter Revenue Share (%), by Application 2025 & 2033
- Figure 30: Europe High-end BAW Filter Volume Share (%), by Application 2025 & 2033
- Figure 31: Europe High-end BAW Filter Revenue (billion), by Types 2025 & 2033
- Figure 32: Europe High-end BAW Filter Volume (K), by Types 2025 & 2033
- Figure 33: Europe High-end BAW Filter Revenue Share (%), by Types 2025 & 2033
- Figure 34: Europe High-end BAW Filter Volume Share (%), by Types 2025 & 2033
- Figure 35: Europe High-end BAW Filter Revenue (billion), by Country 2025 & 2033
- Figure 36: Europe High-end BAW Filter Volume (K), by Country 2025 & 2033
- Figure 37: Europe High-end BAW Filter Revenue Share (%), by Country 2025 & 2033
- Figure 38: Europe High-end BAW Filter Volume Share (%), by Country 2025 & 2033
- Figure 39: Middle East & Africa High-end BAW Filter Revenue (billion), by Application 2025 & 2033
- Figure 40: Middle East & Africa High-end BAW Filter Volume (K), by Application 2025 & 2033
- Figure 41: Middle East & Africa High-end BAW Filter Revenue Share (%), by Application 2025 & 2033
- Figure 42: Middle East & Africa High-end BAW Filter Volume Share (%), by Application 2025 & 2033
- Figure 43: Middle East & Africa High-end BAW Filter Revenue (billion), by Types 2025 & 2033
- Figure 44: Middle East & Africa High-end BAW Filter Volume (K), by Types 2025 & 2033
- Figure 45: Middle East & Africa High-end BAW Filter Revenue Share (%), by Types 2025 & 2033
- Figure 46: Middle East & Africa High-end BAW Filter Volume Share (%), by Types 2025 & 2033
- Figure 47: Middle East & Africa High-end BAW Filter Revenue (billion), by Country 2025 & 2033
- Figure 48: Middle East & Africa High-end BAW Filter Volume (K), by Country 2025 & 2033
- Figure 49: Middle East & Africa High-end BAW Filter Revenue Share (%), by Country 2025 & 2033
- Figure 50: Middle East & Africa High-end BAW Filter Volume Share (%), by Country 2025 & 2033
- Figure 51: Asia Pacific High-end BAW Filter Revenue (billion), by Application 2025 & 2033
- Figure 52: Asia Pacific High-end BAW Filter Volume (K), by Application 2025 & 2033
- Figure 53: Asia Pacific High-end BAW Filter Revenue Share (%), by Application 2025 & 2033
- Figure 54: Asia Pacific High-end BAW Filter Volume Share (%), by Application 2025 & 2033
- Figure 55: Asia Pacific High-end BAW Filter Revenue (billion), by Types 2025 & 2033
- Figure 56: Asia Pacific High-end BAW Filter Volume (K), by Types 2025 & 2033
- Figure 57: Asia Pacific High-end BAW Filter Revenue Share (%), by Types 2025 & 2033
- Figure 58: Asia Pacific High-end BAW Filter Volume Share (%), by Types 2025 & 2033
- Figure 59: Asia Pacific High-end BAW Filter Revenue (billion), by Country 2025 & 2033
- Figure 60: Asia Pacific High-end BAW Filter Volume (K), by Country 2025 & 2033
- Figure 61: Asia Pacific High-end BAW Filter Revenue Share (%), by Country 2025 & 2033
- Figure 62: Asia Pacific High-end BAW Filter Volume Share (%), by Country 2025 & 2033
List of Tables
- Table 1: Global High-end BAW Filter Revenue billion Forecast, by Application 2020 & 2033
- Table 2: Global High-end BAW Filter Volume K Forecast, by Application 2020 & 2033
- Table 3: Global High-end BAW Filter Revenue billion Forecast, by Types 2020 & 2033
- Table 4: Global High-end BAW Filter Volume K Forecast, by Types 2020 & 2033
- Table 5: Global High-end BAW Filter Revenue billion Forecast, by Region 2020 & 2033
- Table 6: Global High-end BAW Filter Volume K Forecast, by Region 2020 & 2033
- Table 7: Global High-end BAW Filter Revenue billion Forecast, by Application 2020 & 2033
- Table 8: Global High-end BAW Filter Volume K Forecast, by Application 2020 & 2033
- Table 9: Global High-end BAW Filter Revenue billion Forecast, by Types 2020 & 2033
- Table 10: Global High-end BAW Filter Volume K Forecast, by Types 2020 & 2033
- Table 11: Global High-end BAW Filter Revenue billion Forecast, by Country 2020 & 2033
- Table 12: Global High-end BAW Filter Volume K Forecast, by Country 2020 & 2033
- Table 13: United States High-end BAW Filter Revenue (billion) Forecast, by Application 2020 & 2033
- Table 14: United States High-end BAW Filter Volume (K) Forecast, by Application 2020 & 2033
- Table 15: Canada High-end BAW Filter Revenue (billion) Forecast, by Application 2020 & 2033
- Table 16: Canada High-end BAW Filter Volume (K) Forecast, by Application 2020 & 2033
- Table 17: Mexico High-end BAW Filter Revenue (billion) Forecast, by Application 2020 & 2033
- Table 18: Mexico High-end BAW Filter Volume (K) Forecast, by Application 2020 & 2033
- Table 19: Global High-end BAW Filter Revenue billion Forecast, by Application 2020 & 2033
- Table 20: Global High-end BAW Filter Volume K Forecast, by Application 2020 & 2033
- Table 21: Global High-end BAW Filter Revenue billion Forecast, by Types 2020 & 2033
- Table 22: Global High-end BAW Filter Volume K Forecast, by Types 2020 & 2033
- Table 23: Global High-end BAW Filter Revenue billion Forecast, by Country 2020 & 2033
- Table 24: Global High-end BAW Filter Volume K Forecast, by Country 2020 & 2033
- Table 25: Brazil High-end BAW Filter Revenue (billion) Forecast, by Application 2020 & 2033
- Table 26: Brazil High-end BAW Filter Volume (K) Forecast, by Application 2020 & 2033
- Table 27: Argentina High-end BAW Filter Revenue (billion) Forecast, by Application 2020 & 2033
- Table 28: Argentina High-end BAW Filter Volume (K) Forecast, by Application 2020 & 2033
- Table 29: Rest of South America High-end BAW Filter Revenue (billion) Forecast, by Application 2020 & 2033
- Table 30: Rest of South America High-end BAW Filter Volume (K) Forecast, by Application 2020 & 2033
- Table 31: Global High-end BAW Filter Revenue billion Forecast, by Application 2020 & 2033
- Table 32: Global High-end BAW Filter Volume K Forecast, by Application 2020 & 2033
- Table 33: Global High-end BAW Filter Revenue billion Forecast, by Types 2020 & 2033
- Table 34: Global High-end BAW Filter Volume K Forecast, by Types 2020 & 2033
- Table 35: Global High-end BAW Filter Revenue billion Forecast, by Country 2020 & 2033
- Table 36: Global High-end BAW Filter Volume K Forecast, by Country 2020 & 2033
- Table 37: United Kingdom High-end BAW Filter Revenue (billion) Forecast, by Application 2020 & 2033
- Table 38: United Kingdom High-end BAW Filter Volume (K) Forecast, by Application 2020 & 2033
- Table 39: Germany High-end BAW Filter Revenue (billion) Forecast, by Application 2020 & 2033
- Table 40: Germany High-end BAW Filter Volume (K) Forecast, by Application 2020 & 2033
- Table 41: France High-end BAW Filter Revenue (billion) Forecast, by Application 2020 & 2033
- Table 42: France High-end BAW Filter Volume (K) Forecast, by Application 2020 & 2033
- Table 43: Italy High-end BAW Filter Revenue (billion) Forecast, by Application 2020 & 2033
- Table 44: Italy High-end BAW Filter Volume (K) Forecast, by Application 2020 & 2033
- Table 45: Spain High-end BAW Filter Revenue (billion) Forecast, by Application 2020 & 2033
- Table 46: Spain High-end BAW Filter Volume (K) Forecast, by Application 2020 & 2033
- Table 47: Russia High-end BAW Filter Revenue (billion) Forecast, by Application 2020 & 2033
- Table 48: Russia High-end BAW Filter Volume (K) Forecast, by Application 2020 & 2033
- Table 49: Benelux High-end BAW Filter Revenue (billion) Forecast, by Application 2020 & 2033
- Table 50: Benelux High-end BAW Filter Volume (K) Forecast, by Application 2020 & 2033
- Table 51: Nordics High-end BAW Filter Revenue (billion) Forecast, by Application 2020 & 2033
- Table 52: Nordics High-end BAW Filter Volume (K) Forecast, by Application 2020 & 2033
- Table 53: Rest of Europe High-end BAW Filter Revenue (billion) Forecast, by Application 2020 & 2033
- Table 54: Rest of Europe High-end BAW Filter Volume (K) Forecast, by Application 2020 & 2033
- Table 55: Global High-end BAW Filter Revenue billion Forecast, by Application 2020 & 2033
- Table 56: Global High-end BAW Filter Volume K Forecast, by Application 2020 & 2033
- Table 57: Global High-end BAW Filter Revenue billion Forecast, by Types 2020 & 2033
- Table 58: Global High-end BAW Filter Volume K Forecast, by Types 2020 & 2033
- Table 59: Global High-end BAW Filter Revenue billion Forecast, by Country 2020 & 2033
- Table 60: Global High-end BAW Filter Volume K Forecast, by Country 2020 & 2033
- Table 61: Turkey High-end BAW Filter Revenue (billion) Forecast, by Application 2020 & 2033
- Table 62: Turkey High-end BAW Filter Volume (K) Forecast, by Application 2020 & 2033
- Table 63: Israel High-end BAW Filter Revenue (billion) Forecast, by Application 2020 & 2033
- Table 64: Israel High-end BAW Filter Volume (K) Forecast, by Application 2020 & 2033
- Table 65: GCC High-end BAW Filter Revenue (billion) Forecast, by Application 2020 & 2033
- Table 66: GCC High-end BAW Filter Volume (K) Forecast, by Application 2020 & 2033
- Table 67: North Africa High-end BAW Filter Revenue (billion) Forecast, by Application 2020 & 2033
- Table 68: North Africa High-end BAW Filter Volume (K) Forecast, by Application 2020 & 2033
- Table 69: South Africa High-end BAW Filter Revenue (billion) Forecast, by Application 2020 & 2033
- Table 70: South Africa High-end BAW Filter Volume (K) Forecast, by Application 2020 & 2033
- Table 71: Rest of Middle East & Africa High-end BAW Filter Revenue (billion) Forecast, by Application 2020 & 2033
- Table 72: Rest of Middle East & Africa High-end BAW Filter Volume (K) Forecast, by Application 2020 & 2033
- Table 73: Global High-end BAW Filter Revenue billion Forecast, by Application 2020 & 2033
- Table 74: Global High-end BAW Filter Volume K Forecast, by Application 2020 & 2033
- Table 75: Global High-end BAW Filter Revenue billion Forecast, by Types 2020 & 2033
- Table 76: Global High-end BAW Filter Volume K Forecast, by Types 2020 & 2033
- Table 77: Global High-end BAW Filter Revenue billion Forecast, by Country 2020 & 2033
- Table 78: Global High-end BAW Filter Volume K Forecast, by Country 2020 & 2033
- Table 79: China High-end BAW Filter Revenue (billion) Forecast, by Application 2020 & 2033
- Table 80: China High-end BAW Filter Volume (K) Forecast, by Application 2020 & 2033
- Table 81: India High-end BAW Filter Revenue (billion) Forecast, by Application 2020 & 2033
- Table 82: India High-end BAW Filter Volume (K) Forecast, by Application 2020 & 2033
- Table 83: Japan High-end BAW Filter Revenue (billion) Forecast, by Application 2020 & 2033
- Table 84: Japan High-end BAW Filter Volume (K) Forecast, by Application 2020 & 2033
- Table 85: South Korea High-end BAW Filter Revenue (billion) Forecast, by Application 2020 & 2033
- Table 86: South Korea High-end BAW Filter Volume (K) Forecast, by Application 2020 & 2033
- Table 87: ASEAN High-end BAW Filter Revenue (billion) Forecast, by Application 2020 & 2033
- Table 88: ASEAN High-end BAW Filter Volume (K) Forecast, by Application 2020 & 2033
- Table 89: Oceania High-end BAW Filter Revenue (billion) Forecast, by Application 2020 & 2033
- Table 90: Oceania High-end BAW Filter Volume (K) Forecast, by Application 2020 & 2033
- Table 91: Rest of Asia Pacific High-end BAW Filter Revenue (billion) Forecast, by Application 2020 & 2033
- Table 92: Rest of Asia Pacific High-end BAW Filter Volume (K) Forecast, by Application 2020 & 2033
Frequently Asked Questions
1. What is the projected Compound Annual Growth Rate (CAGR) of the High-end BAW Filter?
The projected CAGR is approximately 6.74%.
2. Which companies are prominent players in the High-end BAW Filter?
Key companies in the market include Broadcom, Qorvo, Qualcomm, Taiyo Yuden, Akoustis, Skyworks, ROFS Microsystem (Tianjin)Co., Ltd., Epic Mems (Xiamen) Co., Ltd, Suzhou Huntersun Electronics Co., Ltd., Ningbo Semiconductor International Corporation.
3. What are the main segments of the High-end BAW Filter?
The market segments include Application, Types.
4. Can you provide details about the market size?
The market size is estimated to be USD 8.2 billion as of 2022.
5. What are some drivers contributing to market growth?
N/A
6. What are the notable trends driving market growth?
N/A
7. Are there any restraints impacting market growth?
N/A
8. Can you provide examples of recent developments in the market?
N/A
9. What pricing options are available for accessing the report?
Pricing options include single-user, multi-user, and enterprise licenses priced at USD 3950.00, USD 5925.00, and USD 7900.00 respectively.
10. Is the market size provided in terms of value or volume?
The market size is provided in terms of value, measured in billion and volume, measured in K.
11. Are there any specific market keywords associated with the report?
Yes, the market keyword associated with the report is "High-end BAW Filter," which aids in identifying and referencing the specific market segment covered.
12. How do I determine which pricing option suits my needs best?
The pricing options vary based on user requirements and access needs. Individual users may opt for single-user licenses, while businesses requiring broader access may choose multi-user or enterprise licenses for cost-effective access to the report.
13. Are there any additional resources or data provided in the High-end BAW Filter report?
While the report offers comprehensive insights, it's advisable to review the specific contents or supplementary materials provided to ascertain if additional resources or data are available.
14. How can I stay updated on further developments or reports in the High-end BAW Filter?
To stay informed about further developments, trends, and reports in the High-end BAW Filter, consider subscribing to industry newsletters, following relevant companies and organizations, or regularly checking reputable industry news sources and publications.
Methodology
Step 1 - Identification of Relevant Samples Size from Population Database


Step 2 - Approaches for Defining Global Market Size (Value, Volume* & Price*)

Note*: In applicable scenarios
Step 3 - Data Sources
Primary Research
- Web Analytics
- Survey Reports
- Research Institute
- Latest Research Reports
- Opinion Leaders
Secondary Research
- Annual Reports
- White Paper
- Latest Press Release
- Industry Association
- Paid Database
- Investor Presentations

Step 4 - Data Triangulation
Involves using different sources of information in order to increase the validity of a study
These sources are likely to be stakeholders in a program - participants, other researchers, program staff, other community members, and so on.
Then we put all data in single framework & apply various statistical tools to find out the dynamic on the market.
During the analysis stage, feedback from the stakeholder groups would be compared to determine areas of agreement as well as areas of divergence