

Key Insights
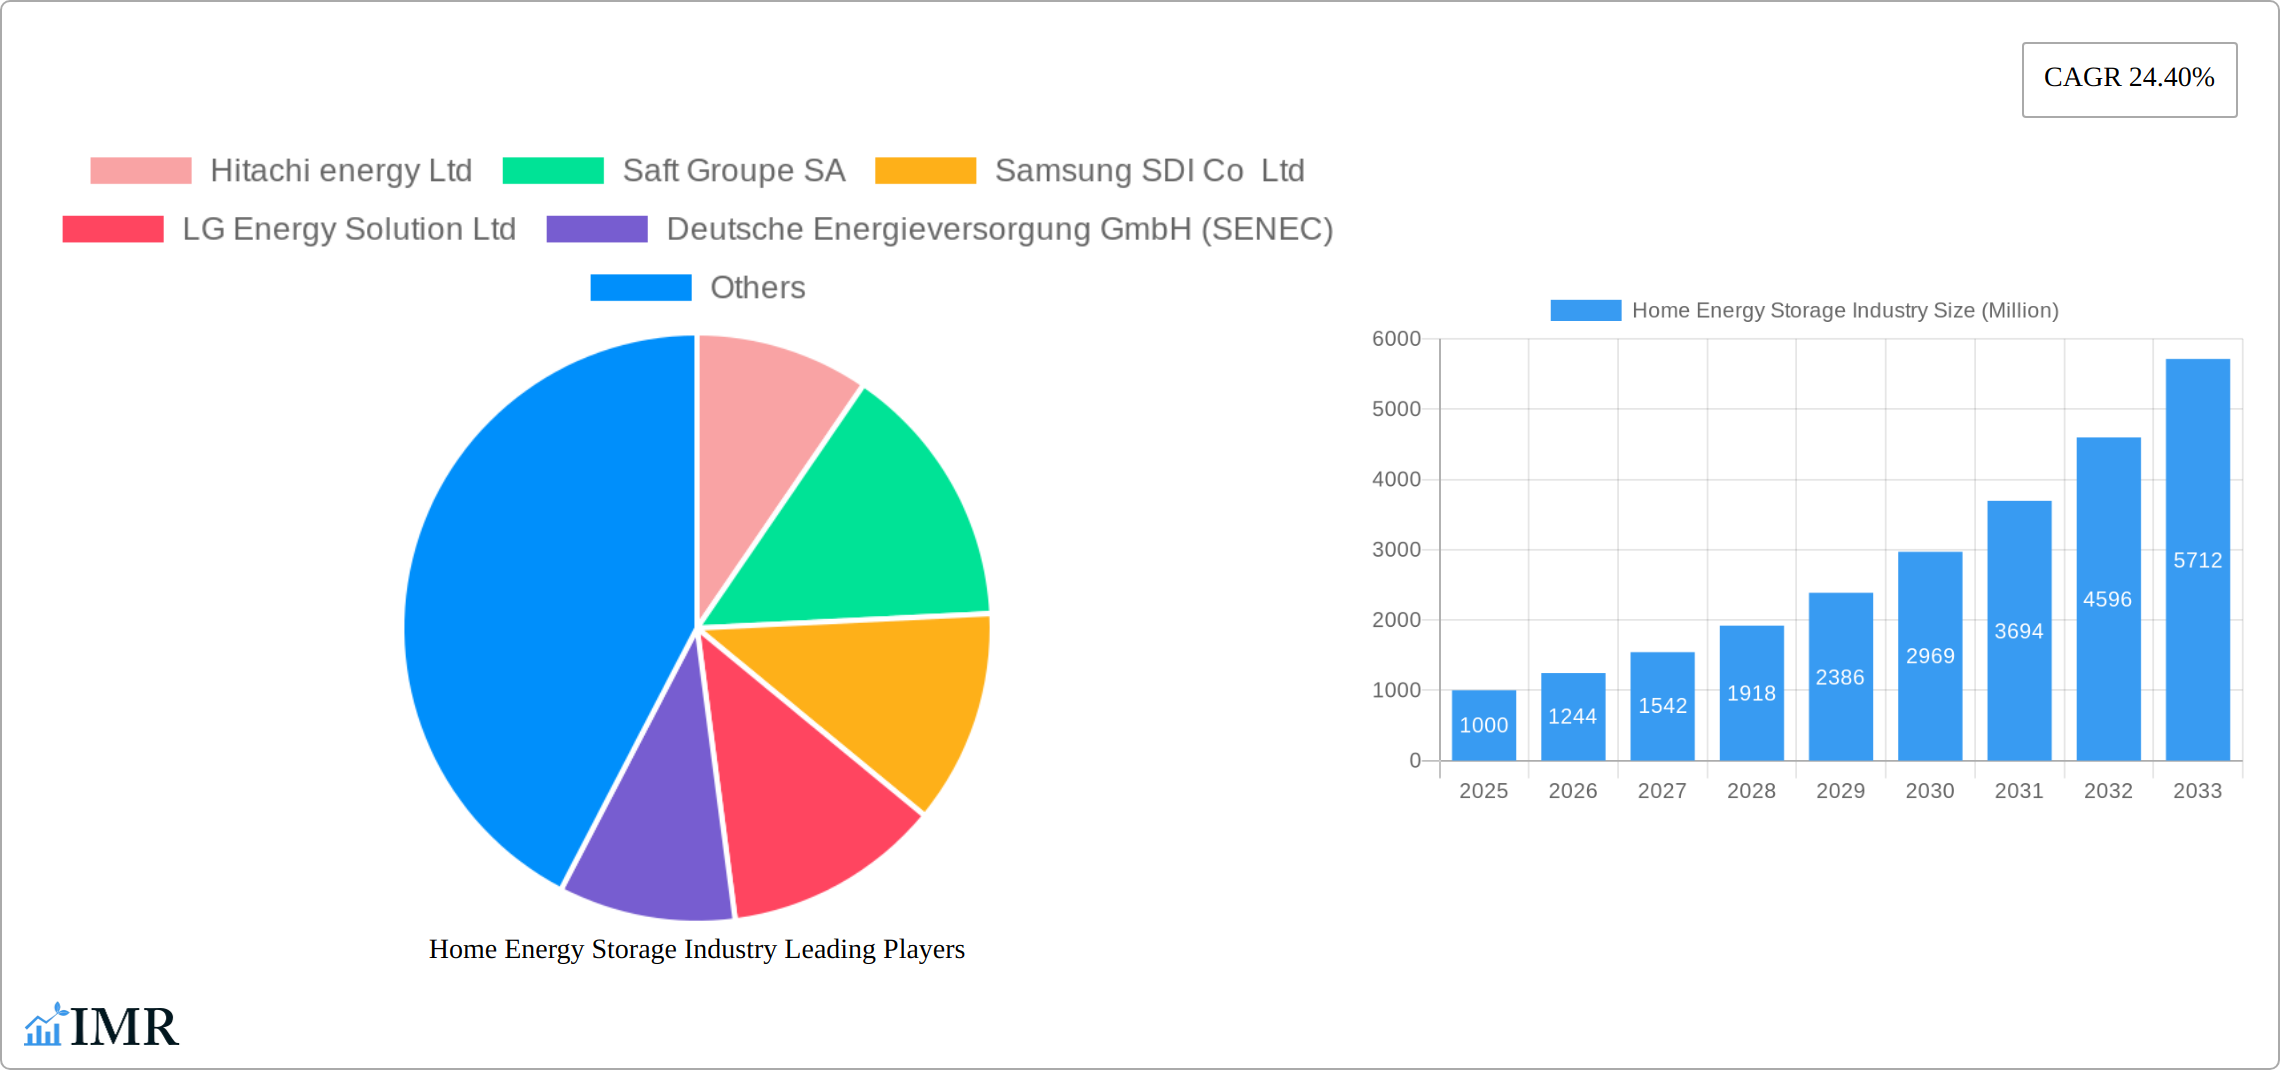
The Home Energy Storage (HES) market is experiencing robust expansion, propelled by escalating electricity costs, heightened concerns regarding grid stability, and the widespread adoption of renewable energy sources such as solar power. The market, valued at $61.5 billion in 2024, is projected to grow at a Compound Annual Growth Rate (CAGR) of 18.3% from 2024 to 2033. This accelerated growth is attributed to key drivers including advancements in battery technology, particularly lithium-ion, which are enhancing efficiency, durability, and affordability. Favorable government initiatives and incentives promoting renewable energy integration and energy autonomy are further stimulating market penetration. The synergy with smart home technologies, enabling remote control, optimized energy management, and grid service participation, also elevates the appeal of HES solutions.
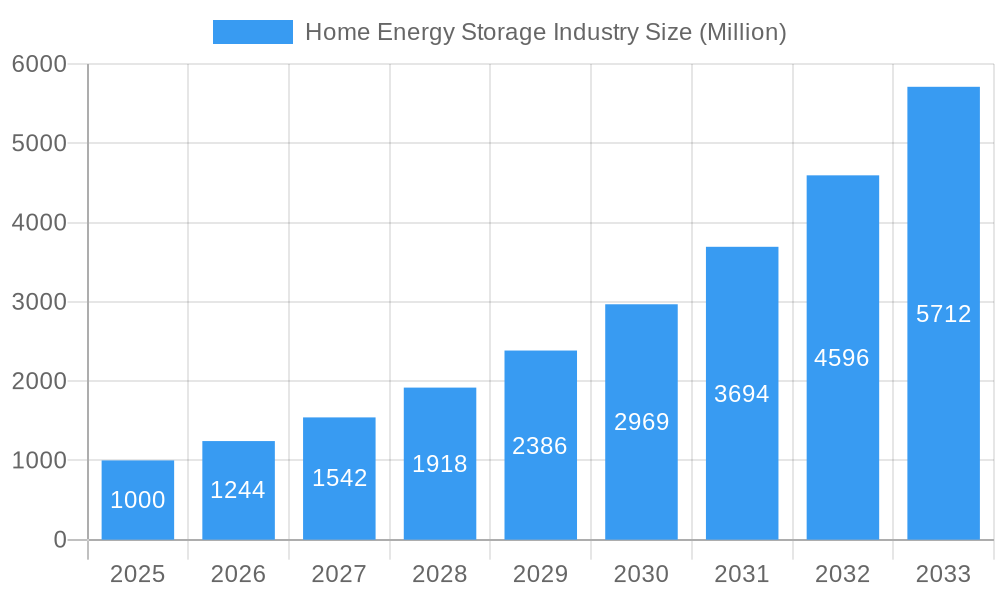
Home Energy Storage Industry Market Size (In Billion)
Notwithstanding the promising trajectory, the HES market confronts specific obstacles. Substantial upfront investment costs continue to be a deterrent for numerous consumers. Paramount considerations surrounding battery safety and end-of-life management are critical for cultivating consumer trust. Intensifying competition among established entities and nascent market entrants is driving price competition and innovation. Geographic disparities in market expansion are anticipated, with North America and Europe leading due to mature infrastructure and strong policy frameworks, while the Asia-Pacific region is poised for significant growth, driven by its expansive and rapidly developing economies. Strategic success in this dynamic sector will hinge on a focus on cost optimization, continuous technological innovation, and the provision of comprehensive service and support offerings.
Home Energy Storage Industry Company Market Share
Home Energy Storage Industry Market Report: 2019-2033
This comprehensive report provides an in-depth analysis of the global Home Energy Storage (HES) industry, encompassing market dynamics, growth trends, key players, and future outlook. The report covers the period 2019-2033, with a focus on the 2025-2033 forecast period. This crucial analysis serves industry professionals, investors, and strategists seeking to understand and capitalize on the burgeoning HES market. We delve into parent markets (renewable energy sector) and child markets (residential, commercial, and grid-scale energy storage).
Home Energy Storage Industry Market Dynamics & Structure
The Home Energy Storage market is experiencing significant growth driven by increasing electricity prices, expanding renewable energy adoption, and government incentives promoting energy independence. Market concentration is moderate, with several key players competing intensely. Technological innovation, particularly in lithium-ion battery technology, is a major driver, while regulatory frameworks and evolving grid integration standards influence market dynamics. The substitution of traditional backup power sources by HES systems is accelerating. End-user demographics are shifting towards environmentally conscious consumers and businesses seeking cost savings and resilience. M&A activity is relatively high, reflecting the industry's consolidation and expansion strategies.
- Market Concentration: Moderate, with top 10 players holding xx% market share in 2024.
- Technological Innovation: Focus on improving energy density, lifespan, and safety of lithium-ion batteries, along with exploring alternative technologies like solid-state batteries.
- Regulatory Frameworks: Government policies supporting renewable energy integration and energy storage deployment are key catalysts.
- Competitive Product Substitutes: Traditional backup generators, diesel generators.
- End-User Demographics: Growing adoption among homeowners seeking energy independence and grid resilience, as well as businesses looking to reduce energy costs and improve operational reliability.
- M&A Trends: Increasing number of mergers and acquisitions, particularly among battery manufacturers and energy storage system integrators. xx M&A deals were recorded between 2019 and 2024.
Home Energy Storage Industry Growth Trends & Insights
The global home energy storage (HES) market is experiencing explosive growth, fueled by a confluence of factors: the increasing need for reliable power backup in the face of grid instability, escalating electricity costs, and supportive government policies incentivizing renewable energy adoption. Market projections indicate substantial expansion, reaching an estimated xx million units by 2025 and xx million units by 2033, representing a Compound Annual Growth Rate (CAGR) of xx% during the forecast period (2025-2033). This growth trajectory is further accelerated by advancements in battery technology, particularly the development of high-capacity, long-life lithium-ion batteries, which offer superior performance and increased longevity compared to previous generations. The shift towards sustainable energy solutions and a growing desire for energy independence among consumers are key drivers of this market expansion, with projected market penetration reaching xx% by 2033. This rapid adoption is most pronounced in regions with robust renewable energy integration policies and higher electricity prices.
Dominant Regions, Countries, or Segments in Home Energy Storage Industry
North America and Europe currently dominate the HES market, driven by favorable government regulations, high electricity costs, and significant renewable energy integration. Within the technology landscape, Lithium-ion batteries hold a commanding market share (xx% in 2024), owing to their superior energy density, longer lifespan, and overall better performance compared to lead-acid alternatives.
Key Drivers (Lithium-ion):
- Unparalleled energy density and extended cycle life, maximizing energy storage and system longevity.
- Government subsidies and tax credits significantly reducing upfront costs and incentivizing adoption.
- Rising electricity prices and unreliable grid infrastructure fueling the demand for reliable backup power.
- Growing environmental awareness and commitment to sustainable living practices.
Dominance Factors:
- Continuous technological advancements resulting in improved efficiency, increased capacity, and reduced costs.
- Strong government support for renewable energy integration and widespread policy frameworks.
- High market penetration in developed economies and growing acceptance in emerging markets.
Growth Potential: Emerging economies present significant growth opportunities, driven by rising energy demand and government initiatives promoting renewable energy. While lead-acid batteries retain a niche market (xx%), primarily in cost-sensitive applications, other emerging technologies are poised to disrupt the market in the coming years.
Home Energy Storage Industry Product Landscape
The Home Energy Storage market offers a diverse range of products, from small-scale residential systems to large-scale commercial and grid-scale solutions. Product innovations focus on improving energy density, extending battery lifespan, enhancing safety features, and integrating advanced functionalities like smart monitoring and grid services. Key performance indicators (KPIs) include energy capacity (kWh), power output (kW), cycle life, and round-trip efficiency. Unique selling propositions include advanced features, such as seamless integration with solar PV systems, intelligent energy management, and remote monitoring capabilities. Technological advancements include the development of solid-state batteries and improved battery management systems.
Key Drivers, Barriers & Challenges in Home Energy Storage Industry
Key Drivers:
- Increasing electricity prices and grid unreliability are driving demand for backup power solutions.
- Government incentives and policies promoting renewable energy integration are accelerating market growth.
- Technological advancements in battery technology are improving performance and reducing costs.
- Growing consumer awareness of environmental sustainability and energy independence is influencing purchasing decisions.
Challenges & Restraints:
- High upfront costs of HES systems remain a barrier for some consumers.
- Supply chain disruptions can impact the availability of key components.
- Regulatory hurdles and safety standards can hinder market penetration.
- Intense competition among established players and new entrants is creating a challenging environment.
Emerging Opportunities in Home Energy Storage Industry
- Untapped Markets: Rapidly expanding electricity demands in developing nations present vast untapped market potential.
- Innovative Applications: Integration with Electric Vehicles (EVs) for Vehicle-to-Grid (V2G) applications, allowing bidirectional energy flow and grid stabilization.
- Evolving Consumer Preferences: Growing demand for smart, integrated energy management systems offering enhanced control, monitoring, and optimization of energy usage.
- Microgrid Integration: HES systems are playing an increasingly vital role in the development of resilient microgrids, enhancing community energy independence and reliability.
Growth Accelerators in the Home Energy Storage Industry
Several factors are poised to drive long-term growth in the HES industry. These include continued technological advancements leading to higher energy density and lower costs, strategic partnerships between energy storage companies and renewable energy providers, expansion into new markets globally, and the increasing adoption of smart grids that leverage energy storage capabilities.
Key Players Shaping the Home Energy Storage Industry Market
- Hitachi energy Ltd
- Saft Groupe SA
- Samsung SDI Co Ltd
- LG Energy Solution Ltd
- Deutsche Energieversorgung GmbH (SENEC)
- Sunverge Energy LLC
- Tesla Inc
- Sonnen GmbH
- Panasonic Corporation
Notable Milestones in Home Energy Storage Industry Sector
- May 2022: Mango Power's launch of the Mango Power M Series, a versatile home energy storage system compatible with solar PV, showcased advancements in residential system capabilities (10-20 kWh battery capacity and 8-14 kW output).
- June 2022: Toyota's entry into the HES market with its O-Uchi Kyuden System, leveraging its EV battery technology (5.5 kWh output / 8.7 kWh capacity), signaled a significant expansion of the market by a major automotive player.
- [Add other recent significant milestones here, e.g., new product launches, mergers & acquisitions, policy changes]
In-Depth Home Energy Storage Industry Market Outlook
The future of the home energy storage industry remains exceptionally promising, characterized by sustained growth driven by technological innovation, supportive government policies, and heightened consumer awareness of renewable energy and energy independence. Strategic opportunities abound for companies to develop innovative products, expand into emerging markets, and build strategic partnerships to fully capitalize on the long-term growth potential within this dynamic sector. The convergence of technological advancements and a growing global commitment to environmental sustainability positions the market for significant expansion in the years to come.
Home Energy Storage Industry Segmentation
-
1. Technology Type
- 1.1. Lithium-ion Batteries
- 1.2. Lead-acid Batteries
- 1.3. Other Technology Types
Home Energy Storage Industry Segmentation By Geography
- 1. North America
- 2. Asia Pacific
- 3. Europe
- 4. Middle East and Africa
- 5. South America
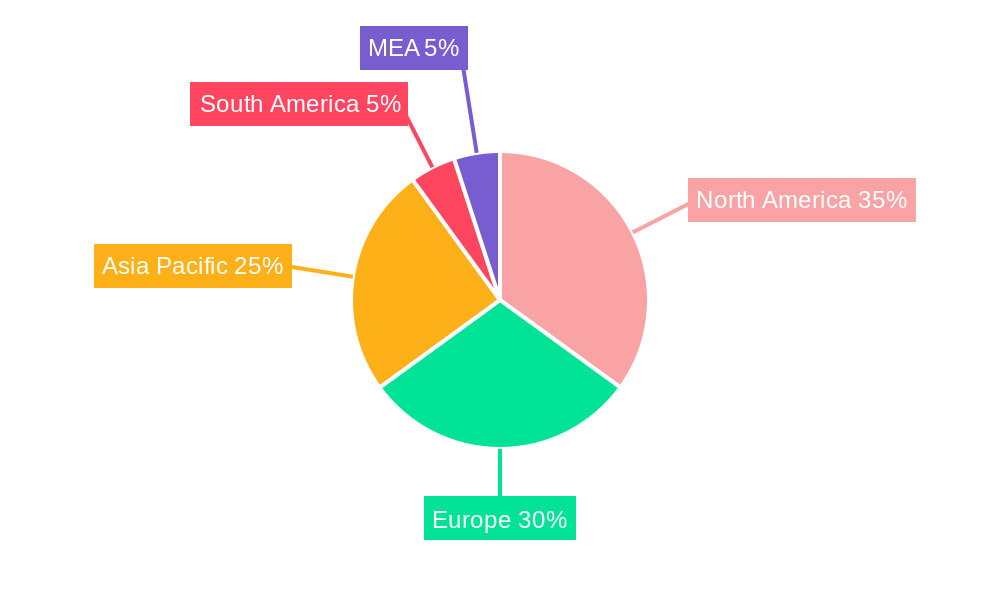
Home Energy Storage Industry Regional Market Share
Geographic Coverage of Home Energy Storage Industry
Home Energy Storage Industry REPORT HIGHLIGHTS
| Aspects | Details |
|---|---|
| Study Period | 2020-2034 |
| Base Year | 2025 |
| Estimated Year | 2026 |
| Forecast Period | 2026-2034 |
| Historical Period | 2020-2025 |
| Growth Rate | CAGR of 18.3% from 2020-2034 |
| Segmentation |
|
Table of Contents
- 1. Introduction
- 1.1. Research Scope
- 1.2. Market Segmentation
- 1.3. Research Objective
- 1.4. Definitions and Assumptions
- 2. Executive Summary
- 2.1. Market Snapshot
- 3. Market Dynamics
- 3.1. Market Drivers
- 3.2. Market Restrains
- 3.3. Market Trends
- 3.4. Market Opportunities
- 4. Market Factor Analysis
- 4.1. Porters Five Forces
- 4.1.1. Bargaining Power of Suppliers
- 4.1.2. Bargaining Power of Buyers
- 4.1.3. Threat of New Entrants
- 4.1.4. Threat of Substitutes
- 4.1.5. Competitive Rivalry
- 4.2. PESTEL analysis
- 4.3. BCG Analysis
- 4.3.1. Stars (High Growth, High Market Share)
- 4.3.2. Cash Cows (Low Growth, High Market Share)
- 4.3.3. Question Mark (High Growth, Low Market Share)
- 4.3.4. Dogs (Low Growth, Low Market Share)
- 4.4. Ansoff Matrix Analysis
- 4.5. Supply Chain Analysis
- 4.6. Regulatory Landscape
- 4.7. Current Market Potential and Opportunity Assessment (TAM–SAM–SOM Framework)
- 4.8. IMR Analyst Note
- 4.1. Porters Five Forces
- 5. Market Analysis, Insights and Forecast 2021-2033
- 5.1. Market Analysis, Insights and Forecast - by Technology Type
- 5.1.1. Lithium-ion Batteries
- 5.1.2. Lead-acid Batteries
- 5.1.3. Other Technology Types
- 5.2. Market Analysis, Insights and Forecast - by Region
- 5.2.1. North America
- 5.2.2. Asia Pacific
- 5.2.3. Europe
- 5.2.4. Middle East and Africa
- 5.2.5. South America
- 5.1. Market Analysis, Insights and Forecast - by Technology Type
- 6. Global Home Energy Storage Industry Analysis, Insights and Forecast, 2021-2033
- 6.1. Market Analysis, Insights and Forecast - by Technology Type
- 6.1.1. Lithium-ion Batteries
- 6.1.2. Lead-acid Batteries
- 6.1.3. Other Technology Types
- 6.1. Market Analysis, Insights and Forecast - by Technology Type
- 7. North America Home Energy Storage Industry Analysis, Insights and Forecast, 2020-2032
- 7.1. Market Analysis, Insights and Forecast - by Technology Type
- 7.1.1. Lithium-ion Batteries
- 7.1.2. Lead-acid Batteries
- 7.1.3. Other Technology Types
- 7.1. Market Analysis, Insights and Forecast - by Technology Type
- 8. Asia Pacific Home Energy Storage Industry Analysis, Insights and Forecast, 2020-2032
- 8.1. Market Analysis, Insights and Forecast - by Technology Type
- 8.1.1. Lithium-ion Batteries
- 8.1.2. Lead-acid Batteries
- 8.1.3. Other Technology Types
- 8.1. Market Analysis, Insights and Forecast - by Technology Type
- 9. Europe Home Energy Storage Industry Analysis, Insights and Forecast, 2020-2032
- 9.1. Market Analysis, Insights and Forecast - by Technology Type
- 9.1.1. Lithium-ion Batteries
- 9.1.2. Lead-acid Batteries
- 9.1.3. Other Technology Types
- 9.1. Market Analysis, Insights and Forecast - by Technology Type
- 10. Middle East and Africa Home Energy Storage Industry Analysis, Insights and Forecast, 2020-2032
- 10.1. Market Analysis, Insights and Forecast - by Technology Type
- 10.1.1. Lithium-ion Batteries
- 10.1.2. Lead-acid Batteries
- 10.1.3. Other Technology Types
- 10.1. Market Analysis, Insights and Forecast - by Technology Type
- 11. South America Home Energy Storage Industry Analysis, Insights and Forecast, 2020-2032
- 11.1. Market Analysis, Insights and Forecast - by Technology Type
- 11.1.1. Lithium-ion Batteries
- 11.1.2. Lead-acid Batteries
- 11.1.3. Other Technology Types
- 11.1. Market Analysis, Insights and Forecast - by Technology Type
- 12. Competitive Analysis
- 12.1. Company Profiles
- 12.1.1 Hitachi energy Ltd
- 12.1.1.1. Company Overview
- 12.1.1.2. Products
- 12.1.1.3. Company Financials
- 12.1.1.4. SWOT Analysis
- 12.1.2 Saft Groupe SA
- 12.1.2.1. Company Overview
- 12.1.2.2. Products
- 12.1.2.3. Company Financials
- 12.1.2.4. SWOT Analysis
- 12.1.3 Samsung SDI Co Ltd
- 12.1.3.1. Company Overview
- 12.1.3.2. Products
- 12.1.3.3. Company Financials
- 12.1.3.4. SWOT Analysis
- 12.1.4 LG Energy Solution Ltd
- 12.1.4.1. Company Overview
- 12.1.4.2. Products
- 12.1.4.3. Company Financials
- 12.1.4.4. SWOT Analysis
- 12.1.5 Deutsche Energieversorgung GmbH (SENEC)
- 12.1.5.1. Company Overview
- 12.1.5.2. Products
- 12.1.5.3. Company Financials
- 12.1.5.4. SWOT Analysis
- 12.1.6 Sunverge Energy LLC
- 12.1.6.1. Company Overview
- 12.1.6.2. Products
- 12.1.6.3. Company Financials
- 12.1.6.4. SWOT Analysis
- 12.1.7 Tesla Inc
- 12.1.7.1. Company Overview
- 12.1.7.2. Products
- 12.1.7.3. Company Financials
- 12.1.7.4. SWOT Analysis
- 12.1.8 Sonnen GmbH
- 12.1.8.1. Company Overview
- 12.1.8.2. Products
- 12.1.8.3. Company Financials
- 12.1.8.4. SWOT Analysis
- 12.1.9 Panasonic Corporation
- 12.1.9.1. Company Overview
- 12.1.9.2. Products
- 12.1.9.3. Company Financials
- 12.1.9.4. SWOT Analysis
- 12.1.1 Hitachi energy Ltd
- 12.2. Market Entropy
- 12.2.1 Company's Key Areas Served
- 12.2.2 Recent Developments
- 12.3. Company Market Share Analysis 2025
- 12.3.1 Top 5 Companies Market Share Analysis
- 12.3.2 Top 3 Companies Market Share Analysis
- 12.4. List of Potential Customers
- 13. Research Methodology
List of Figures
- Figure 1: Global Home Energy Storage Industry Revenue Breakdown (billion, %) by Region 2025 & 2033
- Figure 2: Global Home Energy Storage Industry Volume Breakdown (K Unit, %) by Region 2025 & 2033
- Figure 3: North America Home Energy Storage Industry Revenue (billion), by Technology Type 2025 & 2033
- Figure 4: North America Home Energy Storage Industry Volume (K Unit), by Technology Type 2025 & 2033
- Figure 5: North America Home Energy Storage Industry Revenue Share (%), by Technology Type 2025 & 2033
- Figure 6: North America Home Energy Storage Industry Volume Share (%), by Technology Type 2025 & 2033
- Figure 7: North America Home Energy Storage Industry Revenue (billion), by Country 2025 & 2033
- Figure 8: North America Home Energy Storage Industry Volume (K Unit), by Country 2025 & 2033
- Figure 9: North America Home Energy Storage Industry Revenue Share (%), by Country 2025 & 2033
- Figure 10: North America Home Energy Storage Industry Volume Share (%), by Country 2025 & 2033
- Figure 11: Asia Pacific Home Energy Storage Industry Revenue (billion), by Technology Type 2025 & 2033
- Figure 12: Asia Pacific Home Energy Storage Industry Volume (K Unit), by Technology Type 2025 & 2033
- Figure 13: Asia Pacific Home Energy Storage Industry Revenue Share (%), by Technology Type 2025 & 2033
- Figure 14: Asia Pacific Home Energy Storage Industry Volume Share (%), by Technology Type 2025 & 2033
- Figure 15: Asia Pacific Home Energy Storage Industry Revenue (billion), by Country 2025 & 2033
- Figure 16: Asia Pacific Home Energy Storage Industry Volume (K Unit), by Country 2025 & 2033
- Figure 17: Asia Pacific Home Energy Storage Industry Revenue Share (%), by Country 2025 & 2033
- Figure 18: Asia Pacific Home Energy Storage Industry Volume Share (%), by Country 2025 & 2033
- Figure 19: Europe Home Energy Storage Industry Revenue (billion), by Technology Type 2025 & 2033
- Figure 20: Europe Home Energy Storage Industry Volume (K Unit), by Technology Type 2025 & 2033
- Figure 21: Europe Home Energy Storage Industry Revenue Share (%), by Technology Type 2025 & 2033
- Figure 22: Europe Home Energy Storage Industry Volume Share (%), by Technology Type 2025 & 2033
- Figure 23: Europe Home Energy Storage Industry Revenue (billion), by Country 2025 & 2033
- Figure 24: Europe Home Energy Storage Industry Volume (K Unit), by Country 2025 & 2033
- Figure 25: Europe Home Energy Storage Industry Revenue Share (%), by Country 2025 & 2033
- Figure 26: Europe Home Energy Storage Industry Volume Share (%), by Country 2025 & 2033
- Figure 27: Middle East and Africa Home Energy Storage Industry Revenue (billion), by Technology Type 2025 & 2033
- Figure 28: Middle East and Africa Home Energy Storage Industry Volume (K Unit), by Technology Type 2025 & 2033
- Figure 29: Middle East and Africa Home Energy Storage Industry Revenue Share (%), by Technology Type 2025 & 2033
- Figure 30: Middle East and Africa Home Energy Storage Industry Volume Share (%), by Technology Type 2025 & 2033
- Figure 31: Middle East and Africa Home Energy Storage Industry Revenue (billion), by Country 2025 & 2033
- Figure 32: Middle East and Africa Home Energy Storage Industry Volume (K Unit), by Country 2025 & 2033
- Figure 33: Middle East and Africa Home Energy Storage Industry Revenue Share (%), by Country 2025 & 2033
- Figure 34: Middle East and Africa Home Energy Storage Industry Volume Share (%), by Country 2025 & 2033
- Figure 35: South America Home Energy Storage Industry Revenue (billion), by Technology Type 2025 & 2033
- Figure 36: South America Home Energy Storage Industry Volume (K Unit), by Technology Type 2025 & 2033
- Figure 37: South America Home Energy Storage Industry Revenue Share (%), by Technology Type 2025 & 2033
- Figure 38: South America Home Energy Storage Industry Volume Share (%), by Technology Type 2025 & 2033
- Figure 39: South America Home Energy Storage Industry Revenue (billion), by Country 2025 & 2033
- Figure 40: South America Home Energy Storage Industry Volume (K Unit), by Country 2025 & 2033
- Figure 41: South America Home Energy Storage Industry Revenue Share (%), by Country 2025 & 2033
- Figure 42: South America Home Energy Storage Industry Volume Share (%), by Country 2025 & 2033
List of Tables
- Table 1: Global Home Energy Storage Industry Revenue billion Forecast, by Technology Type 2020 & 2033
- Table 2: Global Home Energy Storage Industry Volume K Unit Forecast, by Technology Type 2020 & 2033
- Table 3: Global Home Energy Storage Industry Revenue billion Forecast, by Region 2020 & 2033
- Table 4: Global Home Energy Storage Industry Volume K Unit Forecast, by Region 2020 & 2033
- Table 5: Global Home Energy Storage Industry Revenue billion Forecast, by Technology Type 2020 & 2033
- Table 6: Global Home Energy Storage Industry Volume K Unit Forecast, by Technology Type 2020 & 2033
- Table 7: Global Home Energy Storage Industry Revenue billion Forecast, by Country 2020 & 2033
- Table 8: Global Home Energy Storage Industry Volume K Unit Forecast, by Country 2020 & 2033
- Table 9: Global Home Energy Storage Industry Revenue billion Forecast, by Technology Type 2020 & 2033
- Table 10: Global Home Energy Storage Industry Volume K Unit Forecast, by Technology Type 2020 & 2033
- Table 11: Global Home Energy Storage Industry Revenue billion Forecast, by Country 2020 & 2033
- Table 12: Global Home Energy Storage Industry Volume K Unit Forecast, by Country 2020 & 2033
- Table 13: Global Home Energy Storage Industry Revenue billion Forecast, by Technology Type 2020 & 2033
- Table 14: Global Home Energy Storage Industry Volume K Unit Forecast, by Technology Type 2020 & 2033
- Table 15: Global Home Energy Storage Industry Revenue billion Forecast, by Country 2020 & 2033
- Table 16: Global Home Energy Storage Industry Volume K Unit Forecast, by Country 2020 & 2033
- Table 17: Global Home Energy Storage Industry Revenue billion Forecast, by Technology Type 2020 & 2033
- Table 18: Global Home Energy Storage Industry Volume K Unit Forecast, by Technology Type 2020 & 2033
- Table 19: Global Home Energy Storage Industry Revenue billion Forecast, by Country 2020 & 2033
- Table 20: Global Home Energy Storage Industry Volume K Unit Forecast, by Country 2020 & 2033
- Table 21: Global Home Energy Storage Industry Revenue billion Forecast, by Technology Type 2020 & 2033
- Table 22: Global Home Energy Storage Industry Volume K Unit Forecast, by Technology Type 2020 & 2033
- Table 23: Global Home Energy Storage Industry Revenue billion Forecast, by Country 2020 & 2033
- Table 24: Global Home Energy Storage Industry Volume K Unit Forecast, by Country 2020 & 2033
Frequently Asked Questions
1. What is the projected Compound Annual Growth Rate (CAGR) of the Home Energy Storage Industry?
The projected CAGR is approximately 18.3%.
2. Which companies are prominent players in the Home Energy Storage Industry?
Key companies in the market include Hitachi energy Ltd, Saft Groupe SA, Samsung SDI Co Ltd, LG Energy Solution Ltd, Deutsche Energieversorgung GmbH (SENEC), Sunverge Energy LLC, Tesla Inc, Sonnen GmbH, Panasonic Corporation.
3. What are the main segments of the Home Energy Storage Industry?
The market segments include Technology Type.
4. Can you provide details about the market size?
The market size is estimated to be USD 61.5 billion as of 2022.
5. What are some drivers contributing to market growth?
4.; Increasing Investments in Offshore Oil and Gas Projects.
6. What are the notable trends driving market growth?
Lithium-Ion Battery Technology to Dominate the Market.
7. Are there any restraints impacting market growth?
4.; Increasing Penetration of Renewable Energy.
8. Can you provide examples of recent developments in the market?
In May 2022, Mango Power launched Mango Power M Series at the Intersolar Munich 2022. The system can be used with a solar PV, with a 10-20 kWh battery for daily and emergency use. The system supports single and triple-phase connections with 8-14 kW output capability. The system can be used in various applications, including a built-in inverter, backup gateway, and EV charger. The company launched different versions for the United States and Europe markets.
9. What pricing options are available for accessing the report?
Pricing options include single-user, multi-user, and enterprise licenses priced at USD 4750, USD 5250, and USD 8750 respectively.
10. Is the market size provided in terms of value or volume?
The market size is provided in terms of value, measured in billion and volume, measured in K Unit.
11. Are there any specific market keywords associated with the report?
Yes, the market keyword associated with the report is "Home Energy Storage Industry," which aids in identifying and referencing the specific market segment covered.
12. How do I determine which pricing option suits my needs best?
The pricing options vary based on user requirements and access needs. Individual users may opt for single-user licenses, while businesses requiring broader access may choose multi-user or enterprise licenses for cost-effective access to the report.
13. Are there any additional resources or data provided in the Home Energy Storage Industry report?
While the report offers comprehensive insights, it's advisable to review the specific contents or supplementary materials provided to ascertain if additional resources or data are available.
14. How can I stay updated on further developments or reports in the Home Energy Storage Industry?
To stay informed about further developments, trends, and reports in the Home Energy Storage Industry, consider subscribing to industry newsletters, following relevant companies and organizations, or regularly checking reputable industry news sources and publications.
Methodology
Step 1 - Identification of Relevant Samples Size from Population Database


Step 2 - Approaches for Defining Global Market Size (Value, Volume* & Price*)

Note*: In applicable scenarios
Step 3 - Data Sources
Primary Research
- Web Analytics
- Survey Reports
- Research Institute
- Latest Research Reports
- Opinion Leaders
Secondary Research
- Annual Reports
- White Paper
- Latest Press Release
- Industry Association
- Paid Database
- Investor Presentations

Step 4 - Data Triangulation
Involves using different sources of information in order to increase the validity of a study
These sources are likely to be stakeholders in a program - participants, other researchers, program staff, other community members, and so on.
Then we put all data in single framework & apply various statistical tools to find out the dynamic on the market.
During the analysis stage, feedback from the stakeholder groups would be compared to determine areas of agreement as well as areas of divergence