

Key Insights
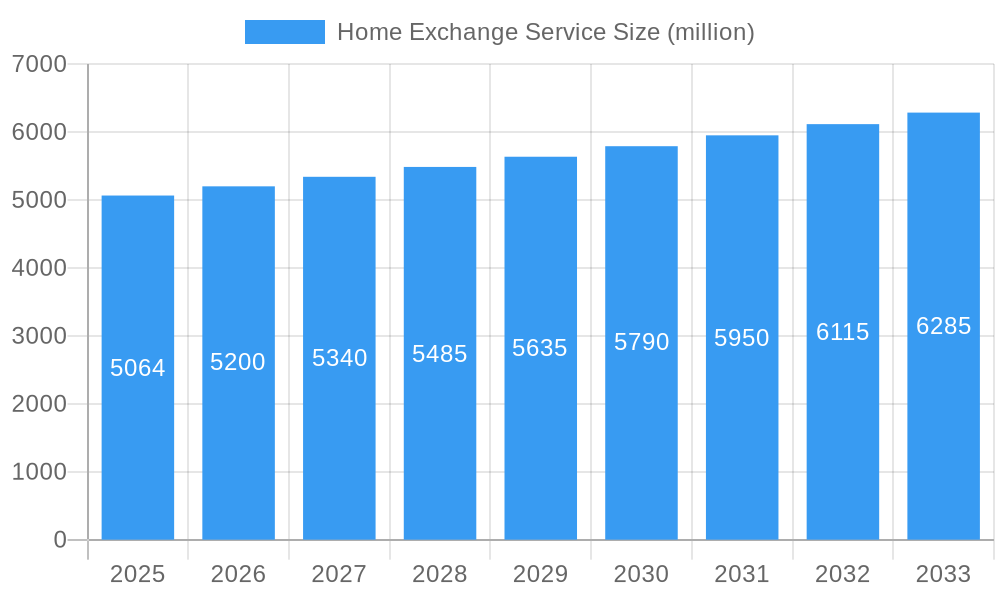
The home exchange service market, valued at $5,064 million in 2025, is projected to experience steady growth, driven by increasing affordability concerns amongst travelers, a rising desire for authentic cultural immersion, and the growing popularity of sustainable and experiential travel. The 2.6% Compound Annual Growth Rate (CAGR) indicates a consistent expansion, albeit a moderate one, suggesting a market that is maturing but still holds significant potential. Key drivers include the cost-effectiveness of home exchanges compared to traditional hotel accommodations, the opportunity to experience local life firsthand, and the growing environmental consciousness of travelers seeking less carbon-intensive travel options. The rise of online platforms facilitating these exchanges, coupled with improved technology and user-friendly interfaces, further contributes to market growth. While challenges such as insurance concerns, language barriers, and the need for trust and verification between exchangers exist, these are increasingly being addressed through platform innovations and robust security measures. The market's segmentation likely includes variations based on property type (apartments, houses, villas), location (urban vs. rural), and target demographics (families, couples, solo travelers), each presenting unique opportunities for growth. The presence of established players like Airbnb, alongside niche platforms catering to specific interests (e.g., WWOOF for agricultural experiences), suggests a market with diverse offerings catering to a wide spectrum of traveler preferences.
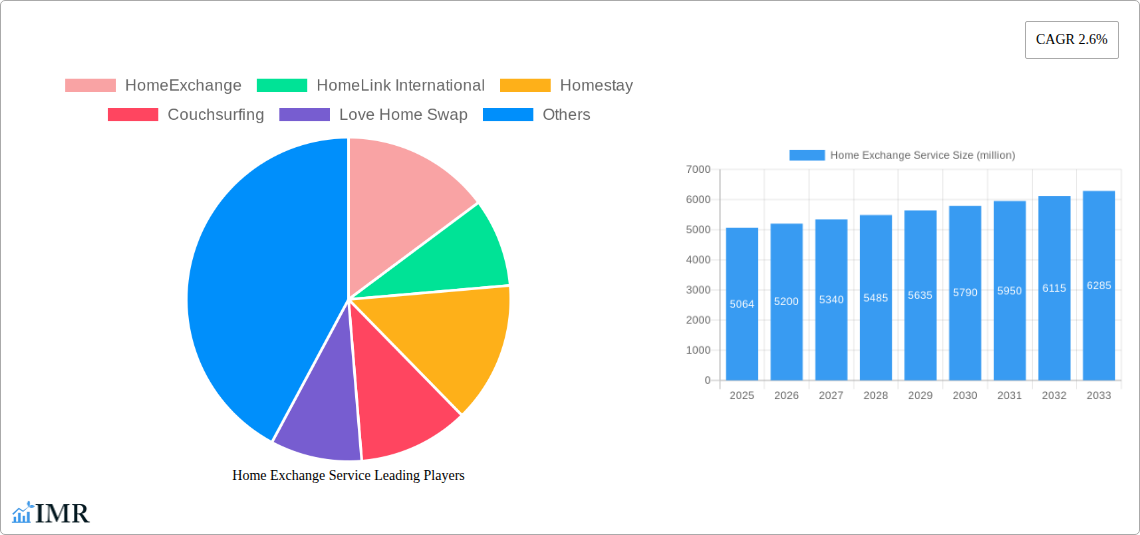
Home Exchange Service Market Size (In Billion)
The competitive landscape is characterized by both established players with global reach and smaller, specialized platforms. The presence of both large companies (Airbnb) and smaller, more specialized operators (HomeExchange, Love Home Swap) illustrates the market's capacity to support businesses of different scales and focus. Future growth is likely to be shaped by technological advancements, improved risk mitigation strategies, and the increasing integration of home exchange options into broader travel planning platforms. The continued expansion of the sharing economy and the growing awareness of sustainable travel choices will likely contribute to the steady expansion of this market throughout the forecast period (2025-2033). Further market segmentation analysis and regional breakdowns would provide more granular insights into specific growth pockets and opportunities within the global home exchange service market.
Home Exchange Service Company Market Share
Home Exchange Service Market Report: 2019-2033
This comprehensive report provides a detailed analysis of the global home exchange service market, encompassing historical data (2019-2024), the base year (2025), and a forecast period (2025-2033). The study examines market dynamics, growth trends, key players, and emerging opportunities within this rapidly evolving sector. This report is invaluable for industry professionals, investors, and anyone seeking to understand the intricacies of the home exchange market, including its parent market (travel and hospitality) and child markets (vacation rentals, cultural exchange).
Home Exchange Service Market Dynamics & Structure
The home exchange service market, valued at $xx million in 2025, exhibits a moderately fragmented structure. While major players like Airbnb and HomeExchange hold significant market share, numerous smaller platforms cater to niche segments. Technological innovation, particularly in areas like platform accessibility and security features, significantly influences market growth. Regulatory frameworks concerning data privacy and property regulations vary across regions, creating both opportunities and challenges. Competitive substitutes include traditional hotel accommodations and short-term rental platforms like Airbnb (though Airbnb offers a different model). End-user demographics are expanding beyond traditional tourists, encompassing remote workers and those seeking longer-term stays. Mergers and acquisitions (M&A) activity remains moderate; however, larger platforms occasionally acquire smaller players to expand their reach and service offerings.
- Market Concentration: Moderately Fragmented (xx% market share held by top 5 players in 2025).
- Technological Drivers: Improved mobile app experiences, enhanced security measures, AI-powered recommendations.
- Regulatory Frameworks: Vary significantly across countries impacting data privacy and property listing regulations.
- Competitive Substitutes: Traditional hotels, short-term rental platforms (e.g., Airbnb), traditional vacation rentals.
- End-User Demographics: Increasingly diverse, including families, couples, solo travelers, remote workers, and those seeking extended stays.
- M&A Trends: Moderate activity, with larger platforms occasionally acquiring smaller niche players (xx M&A deals in 2019-2024).
Home Exchange Service Growth Trends & Insights
The home exchange service market is experiencing robust growth, driven by increasing affordability, a desire for unique travel experiences, and the rising popularity of remote work. The market size exhibited a CAGR of xx% during the historical period (2019-2024), reaching $xx million in 2025. Market penetration remains relatively low compared to traditional accommodation options but shows significant potential for growth, with adoption rates increasing among younger demographics and digitally savvy travelers. Technological advancements such as improved mobile applications and enhanced platform security continue to drive adoption. Shifts in consumer behavior, such as a preference for authentic travel experiences and cost-effective alternatives, further boost market demand. The forecast period (2025-2033) predicts a CAGR of xx%, propelling the market value to $xx million by 2033. This growth is fueled by expanding platform features, global reach, and a continued shift towards experience-based travel.
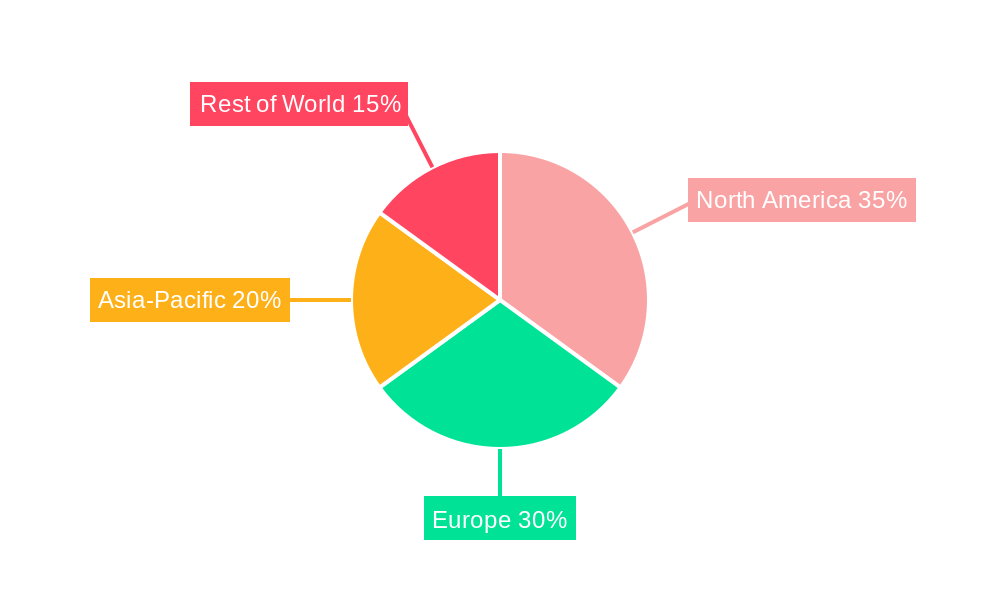
Dominant Regions, Countries, or Segments in Home Exchange Service
North America and Europe currently dominate the home exchange service market, driven by higher disposable incomes, robust tourism sectors, and well-established digital infrastructure. However, Asia-Pacific is experiencing rapid growth, fueled by rising middle-class incomes and increasing internet penetration. The segment of longer-term stays (30+ days) is also showing significant growth, appealing to remote workers and those seeking extended vacations.
- Key Drivers (North America & Europe): High disposable income, established tourism infrastructure, high internet penetration.
- Key Drivers (Asia-Pacific): Rising middle class, increased internet and smartphone penetration, growing interest in unique travel experiences.
- Dominance Factors: Strong established player presence, well-developed tourism infrastructure, high consumer spending on travel, favourable regulatory environments.
- Growth Potential: Asia-Pacific region holds the most significant growth potential due to increasing middle-class disposable incomes and rising tourism. Longer-term stay segments show significant growth potential globally.
Home Exchange Service Product Landscape
Home exchange platforms are continuously evolving, integrating features such as enhanced search filters, secure payment gateways, and improved communication tools. Unique selling propositions often focus on personalized experiences, direct homeowner interaction, and cost-effectiveness compared to traditional accommodation options. Technological advancements in areas such as AI-powered recommendations and virtual tours are enhancing user experience and facilitating seamless home exchanges. The integration of social features enables users to connect, review homes, and build community, further enriching the overall experience.
Key Drivers, Barriers & Challenges in Home Exchange Service
Key Drivers:
- Increasing affordability of travel.
- Growing preference for authentic and unique travel experiences.
- Rise of remote work and digital nomadism.
- Enhanced platform features and user experience.
Challenges and Restraints:
- Security concerns related to property access and damage.
- Trust and communication challenges between homeowners.
- Regulatory uncertainty and varying property regulations across different countries.
- Dependence on user participation and trust within a peer-to-peer model.
- Competition from established short-term rental platforms.
Emerging Opportunities in Home Exchange Service
- Expansion into emerging markets with growing tourism sectors.
- Development of specialized niche platforms (e.g., for pet owners, families, or specific interest groups).
- Integration of sustainable tourism practices into platform offerings.
- Development of innovative insurance and protection solutions for homeowners and travelers.
Growth Accelerators in the Home Exchange Service Industry
Strategic partnerships with travel agencies and tourism boards can significantly accelerate market penetration. Technological breakthroughs such as improved AI-powered search algorithms and virtual reality home tours enhance user experience and drive adoption. Expansion into new geographical markets with high tourism potential, particularly in emerging economies, presents significant growth opportunities.
Key Players Shaping the Home Exchange Service Market
- HomeExchange
- HomeLink International
- Homestay
- Couchsurfing
- Love Home Swap
- Bedycasa
- Airbnb
- Culture Go Go
- Wwoof
- Homestayin
- Casa Particular Cuba
- Knok
- CasaHop
- Intervac
- International Vacation Home Exchange (IVHE)
Notable Milestones in Home Exchange Service Sector
- 2020: Launch of several mobile-first platforms.
- 2021: Increased focus on security features and enhanced user verification processes.
- 2022: Integration of AI-powered recommendation systems and virtual tours.
- 2023: Growing adoption of insurance products to cover potential losses for homeowners.
- 2024: Increased partnerships with travel agencies and tourism boards.
In-Depth Home Exchange Service Market Outlook
The home exchange service market is poised for continued strong growth, driven by evolving consumer preferences, technological advancements, and increasing accessibility. Strategic partnerships, expansion into new markets, and the development of innovative features will be key to unlocking the market's full potential. The market’s future growth will be contingent on addressing security concerns, enhancing user trust, and navigating the regulatory landscape. The continued adoption of technology and strategic marketing will be key to achieving this growth.
Home Exchange Service Segmentation
-
1. Application
- 1.1. Under Age 44
- 1.2. Aged 45–64
- 1.3. Aged 65+
-
2. Types
- 2.1. Simultaneous Exchange
- 2.2. Non-simultaneous Exchange
- 2.3. Hospitality Exchange
- 2.4. Others
Home Exchange Service Segmentation By Geography
-
1. North America
- 1.1. United States
- 1.2. Canada
- 1.3. Mexico
-
2. South America
- 2.1. Brazil
- 2.2. Argentina
- 2.3. Rest of South America
-
3. Europe
- 3.1. United Kingdom
- 3.2. Germany
- 3.3. France
- 3.4. Italy
- 3.5. Spain
- 3.6. Russia
- 3.7. Benelux
- 3.8. Nordics
- 3.9. Rest of Europe
-
4. Middle East & Africa
- 4.1. Turkey
- 4.2. Israel
- 4.3. GCC
- 4.4. North Africa
- 4.5. South Africa
- 4.6. Rest of Middle East & Africa
-
5. Asia Pacific
- 5.1. China
- 5.2. India
- 5.3. Japan
- 5.4. South Korea
- 5.5. ASEAN
- 5.6. Oceania
- 5.7. Rest of Asia Pacific
Home Exchange Service Regional Market Share
Geographic Coverage of Home Exchange Service
Home Exchange Service REPORT HIGHLIGHTS
| Aspects | Details |
|---|---|
| Study Period | 2020-2034 |
| Base Year | 2025 |
| Estimated Year | 2026 |
| Forecast Period | 2026-2034 |
| Historical Period | 2020-2025 |
| Growth Rate | CAGR of 2.6% from 2020-2034 |
| Segmentation |
|
Table of Contents
- 1. Introduction
- 1.1. Research Scope
- 1.2. Market Segmentation
- 1.3. Research Objective
- 1.4. Definitions and Assumptions
- 2. Executive Summary
- 2.1. Market Snapshot
- 3. Market Dynamics
- 3.1. Market Drivers
- 3.2. Market Restrains
- 3.3. Market Trends
- 3.4. Market Opportunities
- 4. Market Factor Analysis
- 4.1. Porters Five Forces
- 4.1.1. Bargaining Power of Suppliers
- 4.1.2. Bargaining Power of Buyers
- 4.1.3. Threat of New Entrants
- 4.1.4. Threat of Substitutes
- 4.1.5. Competitive Rivalry
- 4.2. PESTEL analysis
- 4.3. BCG Analysis
- 4.3.1. Stars (High Growth, High Market Share)
- 4.3.2. Cash Cows (Low Growth, High Market Share)
- 4.3.3. Question Mark (High Growth, Low Market Share)
- 4.3.4. Dogs (Low Growth, Low Market Share)
- 4.4. Ansoff Matrix Analysis
- 4.5. Supply Chain Analysis
- 4.6. Regulatory Landscape
- 4.7. Current Market Potential and Opportunity Assessment (TAM–SAM–SOM Framework)
- 4.8. IMR Analyst Note
- 4.1. Porters Five Forces
- 5. Market Analysis, Insights and Forecast 2021-2033
- 5.1. Market Analysis, Insights and Forecast - by Application
- 5.1.1. Under Age 44
- 5.1.2. Aged 45–64
- 5.1.3. Aged 65+
- 5.2. Market Analysis, Insights and Forecast - by Types
- 5.2.1. Simultaneous Exchange
- 5.2.2. Non-simultaneous Exchange
- 5.2.3. Hospitality Exchange
- 5.2.4. Others
- 5.3. Market Analysis, Insights and Forecast - by Region
- 5.3.1. North America
- 5.3.2. South America
- 5.3.3. Europe
- 5.3.4. Middle East & Africa
- 5.3.5. Asia Pacific
- 5.1. Market Analysis, Insights and Forecast - by Application
- 6. Global Home Exchange Service Analysis, Insights and Forecast, 2021-2033
- 6.1. Market Analysis, Insights and Forecast - by Application
- 6.1.1. Under Age 44
- 6.1.2. Aged 45–64
- 6.1.3. Aged 65+
- 6.2. Market Analysis, Insights and Forecast - by Types
- 6.2.1. Simultaneous Exchange
- 6.2.2. Non-simultaneous Exchange
- 6.2.3. Hospitality Exchange
- 6.2.4. Others
- 6.1. Market Analysis, Insights and Forecast - by Application
- 7. North America Home Exchange Service Analysis, Insights and Forecast, 2020-2032
- 7.1. Market Analysis, Insights and Forecast - by Application
- 7.1.1. Under Age 44
- 7.1.2. Aged 45–64
- 7.1.3. Aged 65+
- 7.2. Market Analysis, Insights and Forecast - by Types
- 7.2.1. Simultaneous Exchange
- 7.2.2. Non-simultaneous Exchange
- 7.2.3. Hospitality Exchange
- 7.2.4. Others
- 7.1. Market Analysis, Insights and Forecast - by Application
- 8. South America Home Exchange Service Analysis, Insights and Forecast, 2020-2032
- 8.1. Market Analysis, Insights and Forecast - by Application
- 8.1.1. Under Age 44
- 8.1.2. Aged 45–64
- 8.1.3. Aged 65+
- 8.2. Market Analysis, Insights and Forecast - by Types
- 8.2.1. Simultaneous Exchange
- 8.2.2. Non-simultaneous Exchange
- 8.2.3. Hospitality Exchange
- 8.2.4. Others
- 8.1. Market Analysis, Insights and Forecast - by Application
- 9. Europe Home Exchange Service Analysis, Insights and Forecast, 2020-2032
- 9.1. Market Analysis, Insights and Forecast - by Application
- 9.1.1. Under Age 44
- 9.1.2. Aged 45–64
- 9.1.3. Aged 65+
- 9.2. Market Analysis, Insights and Forecast - by Types
- 9.2.1. Simultaneous Exchange
- 9.2.2. Non-simultaneous Exchange
- 9.2.3. Hospitality Exchange
- 9.2.4. Others
- 9.1. Market Analysis, Insights and Forecast - by Application
- 10. Middle East & Africa Home Exchange Service Analysis, Insights and Forecast, 2020-2032
- 10.1. Market Analysis, Insights and Forecast - by Application
- 10.1.1. Under Age 44
- 10.1.2. Aged 45–64
- 10.1.3. Aged 65+
- 10.2. Market Analysis, Insights and Forecast - by Types
- 10.2.1. Simultaneous Exchange
- 10.2.2. Non-simultaneous Exchange
- 10.2.3. Hospitality Exchange
- 10.2.4. Others
- 10.1. Market Analysis, Insights and Forecast - by Application
- 11. Asia Pacific Home Exchange Service Analysis, Insights and Forecast, 2020-2032
- 11.1. Market Analysis, Insights and Forecast - by Application
- 11.1.1. Under Age 44
- 11.1.2. Aged 45–64
- 11.1.3. Aged 65+
- 11.2. Market Analysis, Insights and Forecast - by Types
- 11.2.1. Simultaneous Exchange
- 11.2.2. Non-simultaneous Exchange
- 11.2.3. Hospitality Exchange
- 11.2.4. Others
- 11.1. Market Analysis, Insights and Forecast - by Application
- 12. Competitive Analysis
- 12.1. Company Profiles
- 12.1.1 HomeExchange
- 12.1.1.1. Company Overview
- 12.1.1.2. Products
- 12.1.1.3. Company Financials
- 12.1.1.4. SWOT Analysis
- 12.1.2 HomeLink International
- 12.1.2.1. Company Overview
- 12.1.2.2. Products
- 12.1.2.3. Company Financials
- 12.1.2.4. SWOT Analysis
- 12.1.3 Homestay
- 12.1.3.1. Company Overview
- 12.1.3.2. Products
- 12.1.3.3. Company Financials
- 12.1.3.4. SWOT Analysis
- 12.1.4 Couchsurfing
- 12.1.4.1. Company Overview
- 12.1.4.2. Products
- 12.1.4.3. Company Financials
- 12.1.4.4. SWOT Analysis
- 12.1.5 Love Home Swap
- 12.1.5.1. Company Overview
- 12.1.5.2. Products
- 12.1.5.3. Company Financials
- 12.1.5.4. SWOT Analysis
- 12.1.6 Bedycasa
- 12.1.6.1. Company Overview
- 12.1.6.2. Products
- 12.1.6.3. Company Financials
- 12.1.6.4. SWOT Analysis
- 12.1.7 Airbnb
- 12.1.7.1. Company Overview
- 12.1.7.2. Products
- 12.1.7.3. Company Financials
- 12.1.7.4. SWOT Analysis
- 12.1.8 Culture Go Go
- 12.1.8.1. Company Overview
- 12.1.8.2. Products
- 12.1.8.3. Company Financials
- 12.1.8.4. SWOT Analysis
- 12.1.9 Wwoof
- 12.1.9.1. Company Overview
- 12.1.9.2. Products
- 12.1.9.3. Company Financials
- 12.1.9.4. SWOT Analysis
- 12.1.10 Homestayin
- 12.1.10.1. Company Overview
- 12.1.10.2. Products
- 12.1.10.3. Company Financials
- 12.1.10.4. SWOT Analysis
- 12.1.11 Casa Particular Cuba
- 12.1.11.1. Company Overview
- 12.1.11.2. Products
- 12.1.11.3. Company Financials
- 12.1.11.4. SWOT Analysis
- 12.1.12 Knok
- 12.1.12.1. Company Overview
- 12.1.12.2. Products
- 12.1.12.3. Company Financials
- 12.1.12.4. SWOT Analysis
- 12.1.13 CasaHop
- 12.1.13.1. Company Overview
- 12.1.13.2. Products
- 12.1.13.3. Company Financials
- 12.1.13.4. SWOT Analysis
- 12.1.14 Intervac
- 12.1.14.1. Company Overview
- 12.1.14.2. Products
- 12.1.14.3. Company Financials
- 12.1.14.4. SWOT Analysis
- 12.1.15 International Vacation Home Exchange (IVHE)
- 12.1.15.1. Company Overview
- 12.1.15.2. Products
- 12.1.15.3. Company Financials
- 12.1.15.4. SWOT Analysis
- 12.1.1 HomeExchange
- 12.2. Market Entropy
- 12.2.1 Company's Key Areas Served
- 12.2.2 Recent Developments
- 12.3. Company Market Share Analysis 2025
- 12.3.1 Top 5 Companies Market Share Analysis
- 12.3.2 Top 3 Companies Market Share Analysis
- 12.4. List of Potential Customers
- 13. Research Methodology
List of Figures
- Figure 1: Global Home Exchange Service Revenue Breakdown (million, %) by Region 2025 & 2033
- Figure 2: North America Home Exchange Service Revenue (million), by Application 2025 & 2033
- Figure 3: North America Home Exchange Service Revenue Share (%), by Application 2025 & 2033
- Figure 4: North America Home Exchange Service Revenue (million), by Types 2025 & 2033
- Figure 5: North America Home Exchange Service Revenue Share (%), by Types 2025 & 2033
- Figure 6: North America Home Exchange Service Revenue (million), by Country 2025 & 2033
- Figure 7: North America Home Exchange Service Revenue Share (%), by Country 2025 & 2033
- Figure 8: South America Home Exchange Service Revenue (million), by Application 2025 & 2033
- Figure 9: South America Home Exchange Service Revenue Share (%), by Application 2025 & 2033
- Figure 10: South America Home Exchange Service Revenue (million), by Types 2025 & 2033
- Figure 11: South America Home Exchange Service Revenue Share (%), by Types 2025 & 2033
- Figure 12: South America Home Exchange Service Revenue (million), by Country 2025 & 2033
- Figure 13: South America Home Exchange Service Revenue Share (%), by Country 2025 & 2033
- Figure 14: Europe Home Exchange Service Revenue (million), by Application 2025 & 2033
- Figure 15: Europe Home Exchange Service Revenue Share (%), by Application 2025 & 2033
- Figure 16: Europe Home Exchange Service Revenue (million), by Types 2025 & 2033
- Figure 17: Europe Home Exchange Service Revenue Share (%), by Types 2025 & 2033
- Figure 18: Europe Home Exchange Service Revenue (million), by Country 2025 & 2033
- Figure 19: Europe Home Exchange Service Revenue Share (%), by Country 2025 & 2033
- Figure 20: Middle East & Africa Home Exchange Service Revenue (million), by Application 2025 & 2033
- Figure 21: Middle East & Africa Home Exchange Service Revenue Share (%), by Application 2025 & 2033
- Figure 22: Middle East & Africa Home Exchange Service Revenue (million), by Types 2025 & 2033
- Figure 23: Middle East & Africa Home Exchange Service Revenue Share (%), by Types 2025 & 2033
- Figure 24: Middle East & Africa Home Exchange Service Revenue (million), by Country 2025 & 2033
- Figure 25: Middle East & Africa Home Exchange Service Revenue Share (%), by Country 2025 & 2033
- Figure 26: Asia Pacific Home Exchange Service Revenue (million), by Application 2025 & 2033
- Figure 27: Asia Pacific Home Exchange Service Revenue Share (%), by Application 2025 & 2033
- Figure 28: Asia Pacific Home Exchange Service Revenue (million), by Types 2025 & 2033
- Figure 29: Asia Pacific Home Exchange Service Revenue Share (%), by Types 2025 & 2033
- Figure 30: Asia Pacific Home Exchange Service Revenue (million), by Country 2025 & 2033
- Figure 31: Asia Pacific Home Exchange Service Revenue Share (%), by Country 2025 & 2033
List of Tables
- Table 1: Global Home Exchange Service Revenue million Forecast, by Application 2020 & 2033
- Table 2: Global Home Exchange Service Revenue million Forecast, by Types 2020 & 2033
- Table 3: Global Home Exchange Service Revenue million Forecast, by Region 2020 & 2033
- Table 4: Global Home Exchange Service Revenue million Forecast, by Application 2020 & 2033
- Table 5: Global Home Exchange Service Revenue million Forecast, by Types 2020 & 2033
- Table 6: Global Home Exchange Service Revenue million Forecast, by Country 2020 & 2033
- Table 7: United States Home Exchange Service Revenue (million) Forecast, by Application 2020 & 2033
- Table 8: Canada Home Exchange Service Revenue (million) Forecast, by Application 2020 & 2033
- Table 9: Mexico Home Exchange Service Revenue (million) Forecast, by Application 2020 & 2033
- Table 10: Global Home Exchange Service Revenue million Forecast, by Application 2020 & 2033
- Table 11: Global Home Exchange Service Revenue million Forecast, by Types 2020 & 2033
- Table 12: Global Home Exchange Service Revenue million Forecast, by Country 2020 & 2033
- Table 13: Brazil Home Exchange Service Revenue (million) Forecast, by Application 2020 & 2033
- Table 14: Argentina Home Exchange Service Revenue (million) Forecast, by Application 2020 & 2033
- Table 15: Rest of South America Home Exchange Service Revenue (million) Forecast, by Application 2020 & 2033
- Table 16: Global Home Exchange Service Revenue million Forecast, by Application 2020 & 2033
- Table 17: Global Home Exchange Service Revenue million Forecast, by Types 2020 & 2033
- Table 18: Global Home Exchange Service Revenue million Forecast, by Country 2020 & 2033
- Table 19: United Kingdom Home Exchange Service Revenue (million) Forecast, by Application 2020 & 2033
- Table 20: Germany Home Exchange Service Revenue (million) Forecast, by Application 2020 & 2033
- Table 21: France Home Exchange Service Revenue (million) Forecast, by Application 2020 & 2033
- Table 22: Italy Home Exchange Service Revenue (million) Forecast, by Application 2020 & 2033
- Table 23: Spain Home Exchange Service Revenue (million) Forecast, by Application 2020 & 2033
- Table 24: Russia Home Exchange Service Revenue (million) Forecast, by Application 2020 & 2033
- Table 25: Benelux Home Exchange Service Revenue (million) Forecast, by Application 2020 & 2033
- Table 26: Nordics Home Exchange Service Revenue (million) Forecast, by Application 2020 & 2033
- Table 27: Rest of Europe Home Exchange Service Revenue (million) Forecast, by Application 2020 & 2033
- Table 28: Global Home Exchange Service Revenue million Forecast, by Application 2020 & 2033
- Table 29: Global Home Exchange Service Revenue million Forecast, by Types 2020 & 2033
- Table 30: Global Home Exchange Service Revenue million Forecast, by Country 2020 & 2033
- Table 31: Turkey Home Exchange Service Revenue (million) Forecast, by Application 2020 & 2033
- Table 32: Israel Home Exchange Service Revenue (million) Forecast, by Application 2020 & 2033
- Table 33: GCC Home Exchange Service Revenue (million) Forecast, by Application 2020 & 2033
- Table 34: North Africa Home Exchange Service Revenue (million) Forecast, by Application 2020 & 2033
- Table 35: South Africa Home Exchange Service Revenue (million) Forecast, by Application 2020 & 2033
- Table 36: Rest of Middle East & Africa Home Exchange Service Revenue (million) Forecast, by Application 2020 & 2033
- Table 37: Global Home Exchange Service Revenue million Forecast, by Application 2020 & 2033
- Table 38: Global Home Exchange Service Revenue million Forecast, by Types 2020 & 2033
- Table 39: Global Home Exchange Service Revenue million Forecast, by Country 2020 & 2033
- Table 40: China Home Exchange Service Revenue (million) Forecast, by Application 2020 & 2033
- Table 41: India Home Exchange Service Revenue (million) Forecast, by Application 2020 & 2033
- Table 42: Japan Home Exchange Service Revenue (million) Forecast, by Application 2020 & 2033
- Table 43: South Korea Home Exchange Service Revenue (million) Forecast, by Application 2020 & 2033
- Table 44: ASEAN Home Exchange Service Revenue (million) Forecast, by Application 2020 & 2033
- Table 45: Oceania Home Exchange Service Revenue (million) Forecast, by Application 2020 & 2033
- Table 46: Rest of Asia Pacific Home Exchange Service Revenue (million) Forecast, by Application 2020 & 2033
Frequently Asked Questions
1. What is the projected Compound Annual Growth Rate (CAGR) of the Home Exchange Service?
The projected CAGR is approximately 2.6%.
2. Which companies are prominent players in the Home Exchange Service?
Key companies in the market include HomeExchange, HomeLink International, Homestay, Couchsurfing, Love Home Swap, Bedycasa, Airbnb, Culture Go Go, Wwoof, Homestayin, Casa Particular Cuba, Knok, CasaHop, Intervac, International Vacation Home Exchange (IVHE).
3. What are the main segments of the Home Exchange Service?
The market segments include Application, Types.
4. Can you provide details about the market size?
The market size is estimated to be USD 5064 million as of 2022.
5. What are some drivers contributing to market growth?
N/A
6. What are the notable trends driving market growth?
N/A
7. Are there any restraints impacting market growth?
N/A
8. Can you provide examples of recent developments in the market?
N/A
9. What pricing options are available for accessing the report?
Pricing options include single-user, multi-user, and enterprise licenses priced at USD 4900.00, USD 7350.00, and USD 9800.00 respectively.
10. Is the market size provided in terms of value or volume?
The market size is provided in terms of value, measured in million.
11. Are there any specific market keywords associated with the report?
Yes, the market keyword associated with the report is "Home Exchange Service," which aids in identifying and referencing the specific market segment covered.
12. How do I determine which pricing option suits my needs best?
The pricing options vary based on user requirements and access needs. Individual users may opt for single-user licenses, while businesses requiring broader access may choose multi-user or enterprise licenses for cost-effective access to the report.
13. Are there any additional resources or data provided in the Home Exchange Service report?
While the report offers comprehensive insights, it's advisable to review the specific contents or supplementary materials provided to ascertain if additional resources or data are available.
14. How can I stay updated on further developments or reports in the Home Exchange Service?
To stay informed about further developments, trends, and reports in the Home Exchange Service, consider subscribing to industry newsletters, following relevant companies and organizations, or regularly checking reputable industry news sources and publications.
Methodology
Step 1 - Identification of Relevant Samples Size from Population Database


Step 2 - Approaches for Defining Global Market Size (Value, Volume* & Price*)

Note*: In applicable scenarios
Step 3 - Data Sources
Primary Research
- Web Analytics
- Survey Reports
- Research Institute
- Latest Research Reports
- Opinion Leaders
Secondary Research
- Annual Reports
- White Paper
- Latest Press Release
- Industry Association
- Paid Database
- Investor Presentations

Step 4 - Data Triangulation
Involves using different sources of information in order to increase the validity of a study
These sources are likely to be stakeholders in a program - participants, other researchers, program staff, other community members, and so on.
Then we put all data in single framework & apply various statistical tools to find out the dynamic on the market.
During the analysis stage, feedback from the stakeholder groups would be compared to determine areas of agreement as well as areas of divergence